Datastream
The World’s Largest Shipping Hubs


The Briefing
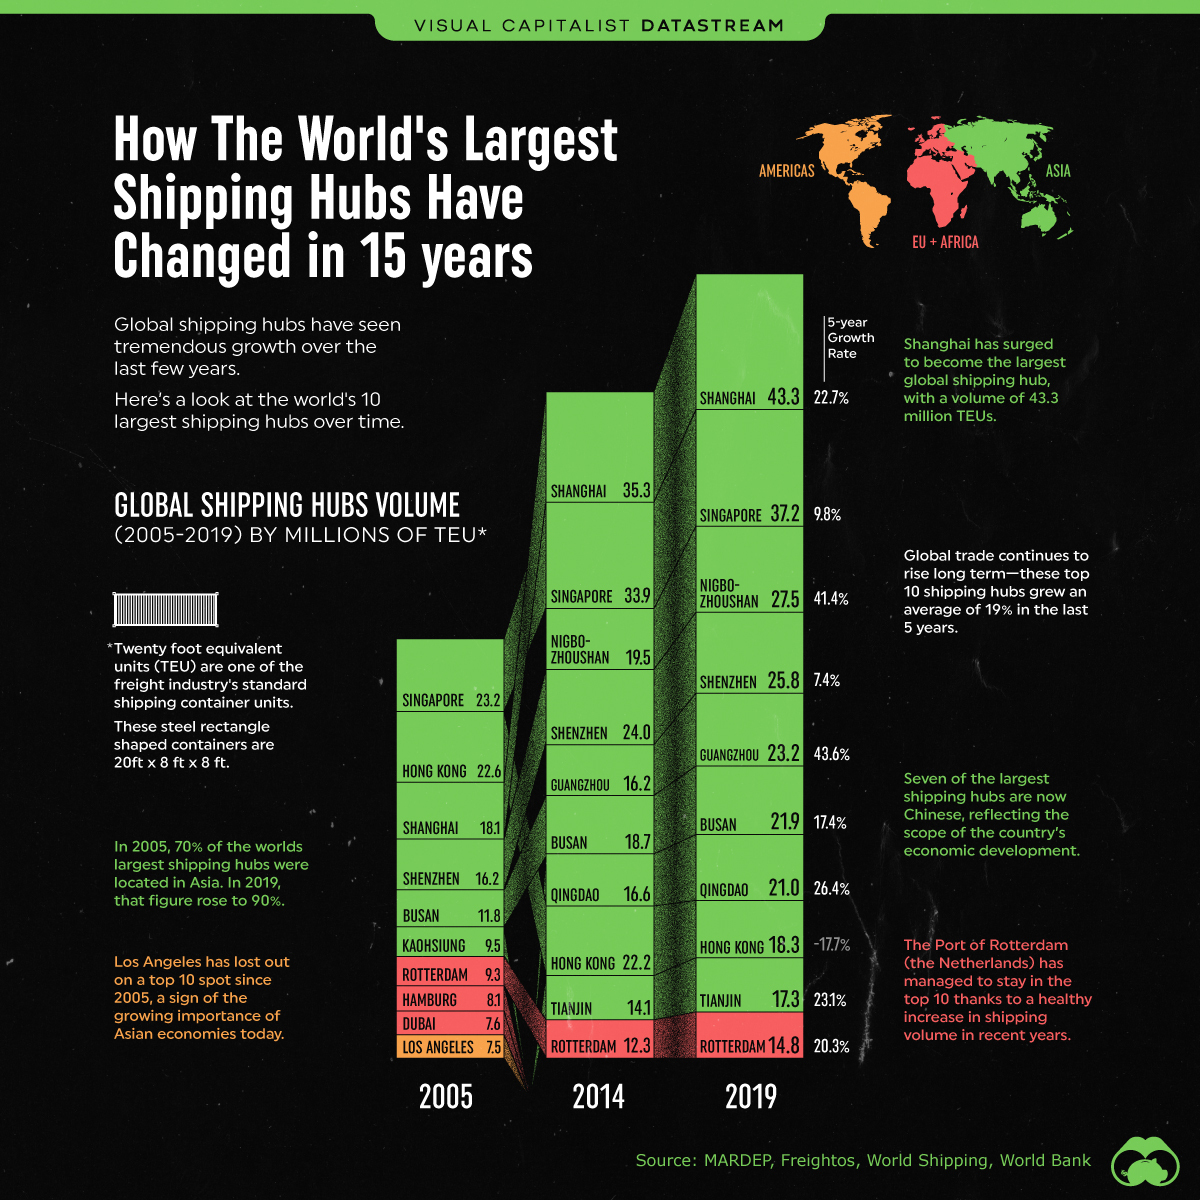
- The world’s 10 largest shipping hubs shipped 250 million TEUs (twenty foot equivalent units) in 2019
- The Asia-Pacific dominates the landscape with 9 out of 10 shipping hubs located in that region
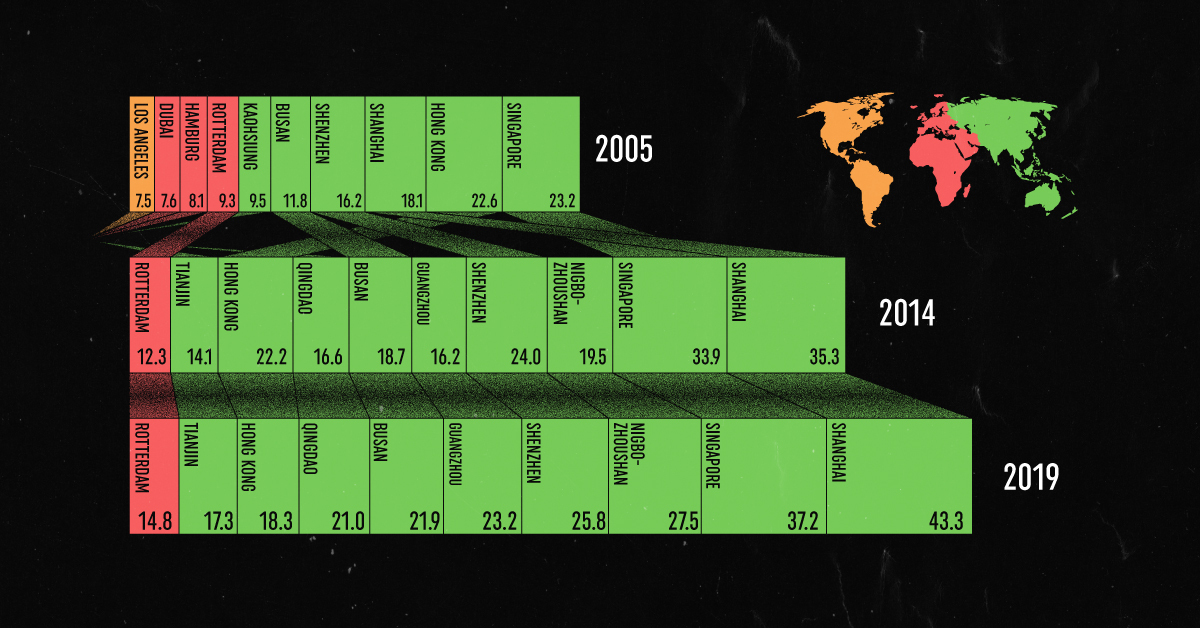
The World’s Largest Shipping Hubs (2005-2019)
As consumers, we often overlook the complexity and sheer size of global trade that is behind the goods and services we consume everyday.
Trade accounts for roughly 60% of global GDP—and emerging markets, particularly in the Asia Pacific region, have trade to thank in part for their economic growth in recent times.
When it comes to the movement of all these goods, shipping hubs are a crucial component of the trade ecosystem. The following data looks at the 10 largest global shipping hubs and their changes in throughput over time.
The 10 Largest Shipping Hubs (2005-2019, Thousands of TEUs)
| Rank | 2005 | 2010 | 2015 | 2019 |
|---|---|---|---|---|
| 1 | Singapore: 23,192 | Shanghai: 29,069 | Shanghai: 36,537 | Shanghai: 43,303 |
| 2 | Hong Kong: 22,602 | Singapore: 28,431 | Singapore: 30,922 | Singapore: 37,196 |
| 3 | Shanghai: 18,084 | Hong Kong: 23,699 | Shenzhen: 24,205 | Ningbo-Zhoushan: 27,535 |
| 4 | Shenzhen: 16,197 | Shenzhen: 22,510 | Ningbo-Zhoushan: 20,627 | Shenzhen: 25,769 |
| 5 | Busan: 11,843 | Busan: 14,194 | Hong Kong: 20,073 | Guangzhou: 23,223 |
| 6 | Kaohsiung: 9,471 | Ningbo-Zhoushan: 13,147 | Busan: 19,469 | Busan: 21,992 |
| 7 | Rotterdam: 9,288 | Guangzhou: 12,546 | Guangzhou: 17,625 | Qingdao: 21,012 |
| 8 | Hamburg: 8,088 | Qingdao: 12,012 | Qingdao: 17,436 | Hong Kong: 18,303 |
| 9 | Dubai: 7,619 | Dubai: 11,600 | Dubai: 15,592 | Tianjin: 17,301 |
| 10 | Los Angeles: 7,485 | Rotterdam: 11,148 | Tianjin: 14,111 | Rotterdam: 14,811 |
One of the biggest changes in recent years is the addition of the Yangshan Port in Shanghai. This massive port has already undergone four expansion phases since it opened in 2005.
Also noteworthy is Hong Kong’s falling position in this ranking. Only a decade ago, Hong Kong was the third-busiest port in the world. Today, facing fierce competition from nearby port facilities, Hong Kong sits in eighth place.
The Global Trade Machine
Trade and the transportation of goods and services are a fundamental component of the $88 trillion global economy. The value of all exports in 2019 was $24.9 trillion.
The Chinese economy continues to show immense strength, and the country is now the top trading partner of 128 countries around the world. China exported $2.6 trillion worth of goods last year, representing 18% of GDP and making them the largest exporter in the world. This economic prowess is also expressed through their enormous shipping hubs – 70% of the TEUs from the top 10 flow through China.
The aggregate volume of goods and services that move between the worlds largest shipping hubs has risen in relation to global trade figures over time, from 212 million TEUs in 2014 to 250 million in 2019.
Where does this data come from?
Source: Marine Department of Hong Kong
Notes: Latest data is as of 2019


Datastream
Can You Calculate Your Daily Carbon Footprint?
Discover how the average person’s carbon footprint impacts the environment and learn how carbon credits can offset your carbon footprint.


The Briefing
- A person’s carbon footprint is substantial, with activities such as food consumption creating as much as 4,500 g of CO₂ emissions daily.
- By purchasing carbon credits from Carbon Streaming Corporation, you can offset your own emissions and fund positive climate action.
Your Everyday Carbon Footprint
While many large businesses and countries have committed to net-zero goals, it is essential to acknowledge that your everyday activities also contribute to global emissions.
In this graphic, sponsored by Carbon Streaming Corporation, we will explore how the choices we make and the products we use have a profound impact on our carbon footprint.
Carbon Emissions by Activity
Here are some of the daily activities and products of the average person and their carbon footprint, according to Clever Carbon.
| Household Activities & Products | CO2 Emissions (g) |
|---|---|
| 💡 Standard Light Bulb (100 watts, four hours) | 172 g |
| 📱 Mobile Phone Use (195 minutes per day)* | 189 g |
| 👕 Washing Machine (0.63 kWh) | 275 g |
| 🔥 Electric Oven (1.56 kWh) | 675 g |
| ♨️ Tumble Dryer (2.5 kWh) | 1,000 g |
| 🧻 Toilet Roll (2 ply) | 1,300 g |
| 🚿 Hot Shower (10 mins) | 2,000 g |
| 🚙 Daily Commute (one hour, by car) | 3,360 g |
| 🍽️ Average Daily Food Consumption (three meals of 600 calories) | 4,500 g |
| *Phone use based on yearly use of 69kg per the source, Reboxed | |
Your choice of transportation plays a crucial role in determining your carbon footprint. For instance, a 15 km daily commute to work on public transport generates an average of 1,464 g of CO₂ emissions. Compared to 3,360 g—twice the volume for a journey the same length by car.
By opting for more sustainable modes of transport, such as cycling, walking, or public transportation, you can significantly reduce your carbon footprint.
Addressing Your Carbon Footprint
One way to compensate for your emissions is by purchasing high-quality carbon credits.
Carbon credits are used to help fund projects that avoid, reduce or remove CO₂ emissions. This includes nature-based solutions such as reforestation and improved forest management, or technology-based solutions such as the production of biochar and carbon capture and storage (CCS).
While carbon credits offer a potential solution for individuals to help reduce global emissions, public awareness remains a significant challenge. A BCG-Patch survey revealed that only 34% of U.S. consumers are familiar with carbon credits, and only 3% have purchased them in the past.
About Carbon Streaming
By financing the creation or expansion of carbon projects, Carbon Streaming Corporation secures the rights to future carbon credits generated by these sustainable projects. You can then purchase these carbon credits to help fund climate solutions around the world and compensate for your own emissions.
Ready to get involved?
>> Learn more about purchasing carbon credits at Carbon Streaming

-

 Real Estate2 weeks ago
Visualizing America’s Shortage of Affordable Homes
-

 Technology1 week ago
Ranked: Semiconductor Companies by Industry Revenue Share
-

 Money2 weeks ago
Which States Have the Highest Minimum Wage in America?
-

 Real Estate2 weeks ago
Ranked: The Most Valuable Housing Markets in America
-

 Business2 weeks ago
Charted: Big Four Market Share by S&P 500 Audits
-

 AI2 weeks ago
The Stock Performance of U.S. Chipmakers So Far in 2024
-

 Misc2 weeks ago
Almost Every EV Stock is Down After Q1 2024
-

 Money2 weeks ago
Where Does One U.S. Tax Dollar Go?