Financing
The World’s Largest IPOs Adjusted For Inflation


The World’s Largest IPOs Adjusted For Inflation
Billion-dollar initial public offerings (IPOs) are always eyebrow-raising events, and many have already made headlines in 2020.
Following the recent trend of tech IPOs outnumbering and out-hyping the competition, software has led the way. Cloud storage company Snowflake raised $3.4 billion in the largest ever software IPO, while gaming software developer Unity completed an IPO above its target price for a total of $1.3 billion and big data firm Palantir opted for a direct listing for a valuation of $22 billion.
More big names are still on the horizon. DoorDash just completed an above-range IPO and ended up raising $3.37 billion, and Airbnb raised $3.5 billion before shares opened more than 100% above the IPO price. It’s a big recovery for an IPO market that in 2019 saw major IPOs from Uber and Lyft underperform estimates.
But it was the last-minute cancellation of Ant Group’s IPO in November that would have been the largest public offering ever. At $34.5 billion, it would have eclipsed the massive $25.9 billion raised by energy giant Saudi Aramco in 2019.
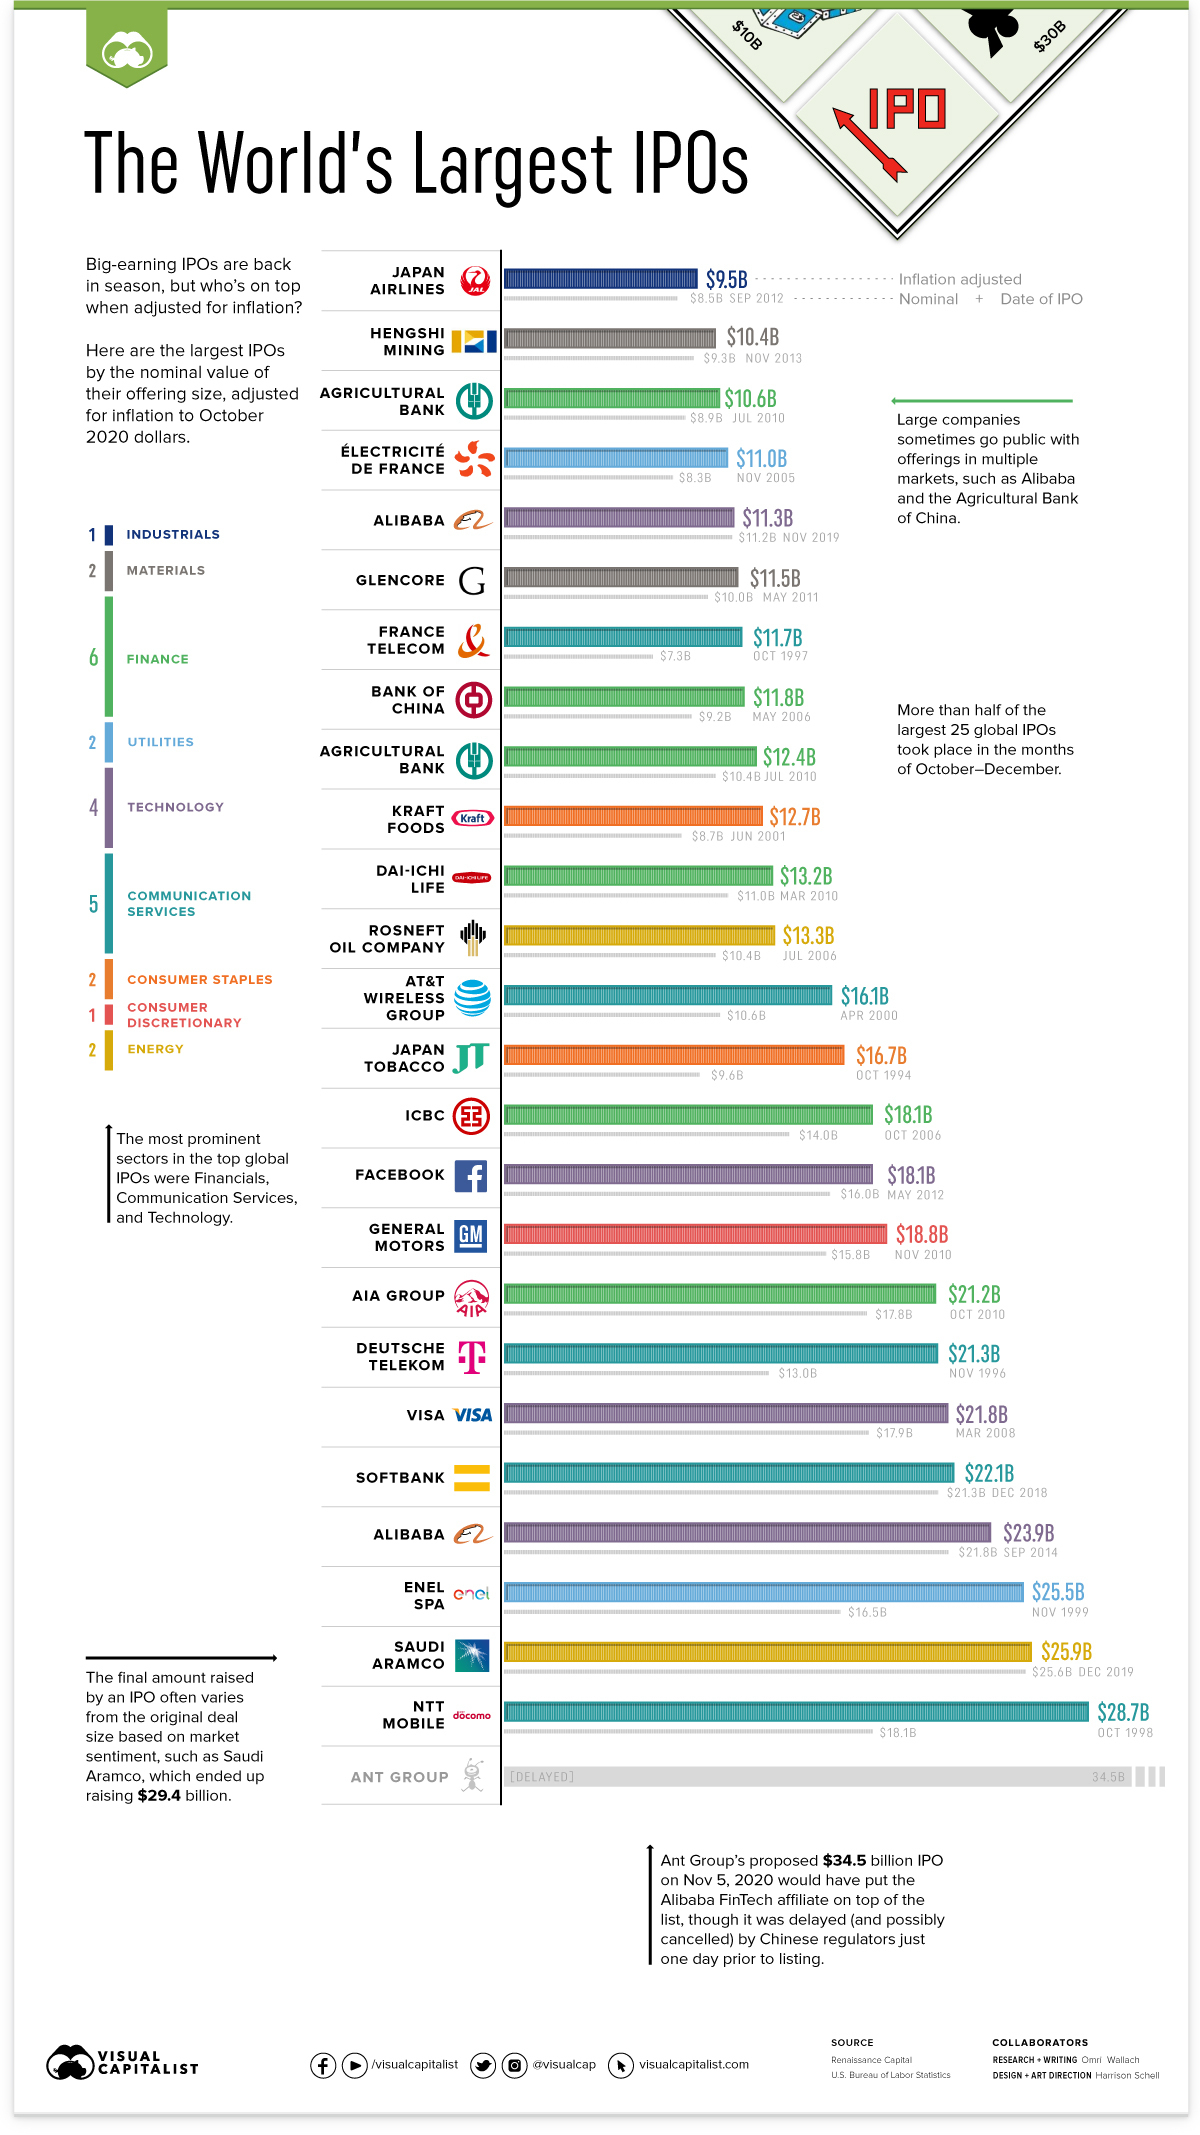
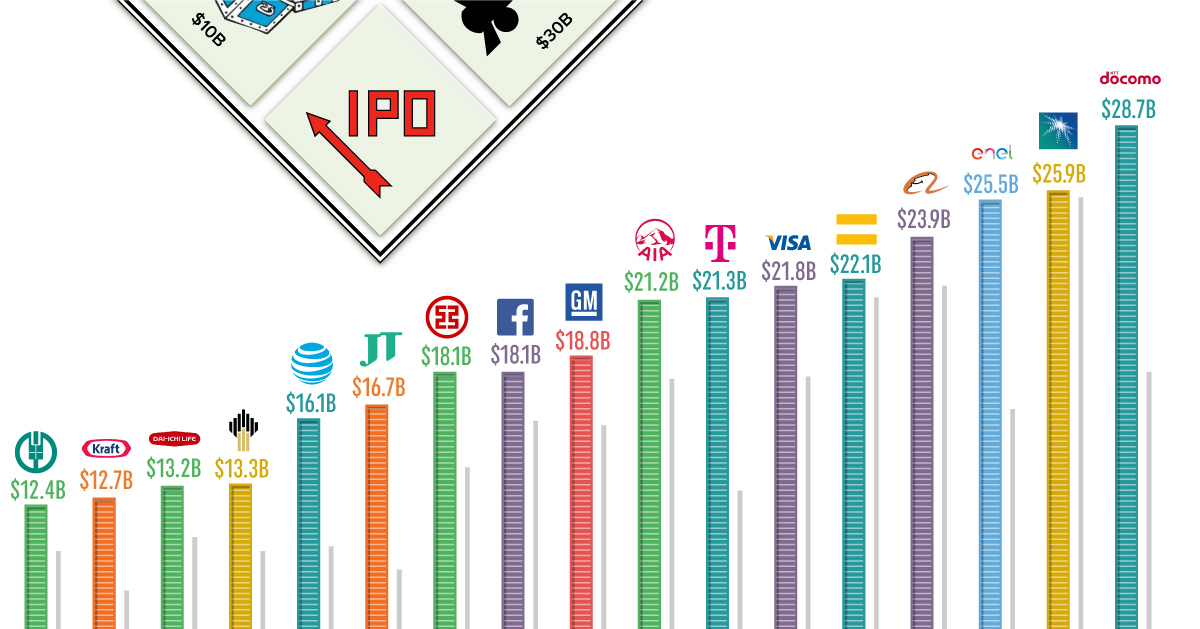
How would this have stacked up against the world’s largest IPOs in history? We took the 25 largest global IPOs by nominal offering size as tracked by research firm Renaissance Capital, and adjusted them for inflation to October 2020 dollars.
NTT Docomo Tops the (Adjusted) Chart
Unicorn IPOs might be the current flavor in 2020, but they pale in comparison to communication and resource giants.
When adjusted for inflation, the largest ever IPO was Japan’s major mobile phone carrier NTT Docomo. The company went public as NTT Mobile Communications Network for a then-record $18 billion in 1998, which is $28.7 billion when adjusted for inflation to 2020.
| Company | IPO Date | Industry | Deal Size ($B) | Inflation Adjusted ($B) |
|---|---|---|---|---|
| NTT Mobile | Oct 1998 | Communication Services | 18.1 | 28.7 |
| Saudi Aramco | Dec 2019 | Energy | 25.6 | 25.9 |
| ENEL SpA | Nov 1999 | Utilities | 16.5 | 25.5 |
| Alibaba (U.S.) | Sep 2014 | Technology | 21.8 | 23.9 |
| SoftBank Corp | Dec 2018 | Communication Services | 21.3 | 22.1 |
| Visa | Mar 2008 | Technology | 17.9 | 21.8 |
| Deutsche Telekom | Nov 1996 | Communication Services | 13 | 21.3 |
| AIA Group | Oct 2010 | Financials | 17.8 | 21.2 |
| General Motors | Nov 2010 | Consumer Discretionary | 15.8 | 18.8 |
| May 2012 | Technology | 16 | 18.1 | |
| ICBC | Oct 2006 | Financials | 14 | 18.1 |
| Japan Tobacco Inc. | Oct 1994 | Consumer Staples | 9.6 | 16.7 |
| AT&T Wireless Group | Apr 2000 | Communication Services | 10.6 | 16.1 |
| Rosneft Oil Company | Jul 2006 | Energy | 10.4 | 13.3 |
| Dai-ichi Life | Mar 2010 | Financials | 11 | 13.2 |
| Kraft Foods | Jun 2001 | Consumer Staples | 8.7 | 12.7 |
| Agricultural Bank (H.K.) | Jul 2010 | Financials | 10.4 | 12.4 |
| Bank of China | May 2006 | Financials | 9.2 | 11.8 |
| France Telecom | Oct 1997 | Communication Services | 7.3 | 11.7 |
| Glencore | May 2011 | Materials | 10 | 11.5 |
| Alibaba (H.K.) | Nov 2019 | Technology | 11.2 | 11.3 |
| Electricite De France | Nov 2005 | Utilities | 8.3 | 11 |
| Agricultural Bank (China) | Jul 2010 | Financials | 8.9 | 10.6 |
| Hengshi Mining | Nov 2013 | Materials | 9.3 | 10.4 |
| Japan Airlines | Sep 2012 | Industrials | 8.5 | 9.5 |
Despite the recent flurry of IPO activity, only two of the largest 10 inflation-adjusted IPOs occurred in the last two years, with second place Saudi Aramco and Japan’s communications and tech conglomerate SoftBank.
Including NTT Docomo, three of the top 10 occurred in the 1990’s. Italy’s energy giant ENEL SpA raised the equivalent of $25.9 billion in 1999, and German communications company Deutsche Telekom raised the equivalent of $21.3 billion in 1996.
Communications services accounted for five of the top 25 IPOs, and four of the top 10. Only the financials were more prominent with six of the top 25.
Final IPO Numbers can Outperform (and Underperform)
One important consideration to make is that the final amount raised by an IPO can vary from the original deal size.
Though they are underwritten by a large financial institution for a set amount at a specific price range, companies often grant underwriters the “greenshoe option” to sell more shares than the original issue amount, usually up to 15% more.
This over-allotment option lets an underwriter capitalize on a strong market by offering more shares at a surging share price (which they cover at the original price). In the opposite case of falling share prices, the underwriter can buy back shares at market rate to stabilize the price and cover their short position.
Many of the largest ever IPOs have managed to capitalize on their much-hyped debuts. Saudi Aramco ended up raising $29.4 billion, almost $4 billion more than its original offering. In similar fashion, Chinese e-commerce giant Alibaba raised $25 billion on an offering of $21.8 billion, and Visa raised $19.7 billion on an offering of $17.9 billion.
Additionally, large corporations can take advantage of market sentiment by going public in multiple equity markets. Alibaba’s $25 billion debut on the New York Stock Exchange in 2014 was followed by a secondary offering on the Hong Kong Stock Exchange in 2019 for $11.2 billion. Likewise, the Agricultural Bank of China listed on both the Hong Kong and Shanghai Stock Exchanges in 2010 for a combined $22.1 billion haul.
More IPOS on the Docket for 2021
With excitement around IPOs bubbling once again, more companies are lining up to become the next big breakthrough on public markets.
2021’s list of IPO candidates include shopping app Wish (which has already filed for an offering), gaming companies Epic Games and Roblox, payment processing firm Stripe and even dating app Bumble.
And Ant Group’s massive potential IPO shadow looms over all, though regulatory overhauls in China might push it back to 2022 and lower the size of the offering.
For now, the list of the world’s largest IPOs looks to be relatively stable. But with social media giant Facebook cracking the Top 10 list in 2012, and SoftBank’s massive IPO in 2018, the next +$10 billion dollar IPO is always around the corner.


Finance
Charted: How Long Does it Take Unicorns to Exit?
There are roughly 1,400 unicorns—startups worth $1 billion or more. How many years does it take these giants to get acquired or go public?
 Creator Program
How Long Does it Take For Unicorns to Exit?
For most unicorns—startups with a $1 billion valuation or more—it can take years to see a liquidity event.
Take Twitter, which went public seven years after its 2006 founding. Or Uber, which had an IPO after a decade of operation in 2019. After all, companies first have to succeed and build up their valuation in order to not go bankrupt or dissolve. Few are able to succeed and capitalize in a quick and tidy manner.
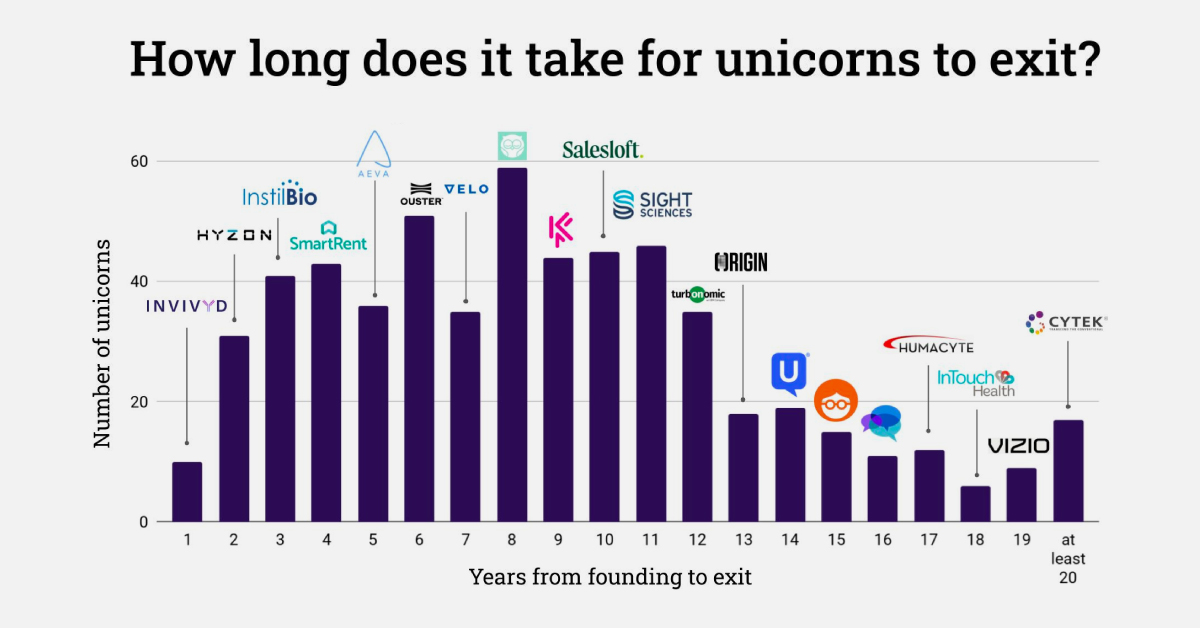
So when do unicorns exit, either successfully through an IPO or acquisition, or unsuccessfully through bankruptcy or liquidation? The above visualization from Ilya Strebulaev breaks down the time it took for 595 unicorns to exit from 1997 to 2022.
Unicorns: From Founding to Exit
Here’s how unicorn exits broke down over the last 25 years. Data was collected by Strebulaev at the Venture Capital Initiative in Stanford and covers exits up to October 2022:
| Years (Founding to Exit) | Unicorn Example | Number of Unicorns 1997‒2022 |
|---|---|---|
| 1 | YouTube | 10 |
| 2 | 31 | |
| 3 | Groupon | 41 |
| 4 | Zynga | 43 |
| 5 | Salesforce | 36 |
| 6 | Alphabet (Google) | 51 |
| 7 | Tesla | 35 |
| 8 | Zoom | 59 |
| 9 | Coursera | 44 |
| 10 | Uber Technologies | 45 |
| 11 | WeWork | 46 |
| 12 | Airbnb | 35 |
| 13 | Credit Karma | 18 |
| 14 | SimilarWeb | 19 |
| 15 | 23andMe | 15 |
| 16 | Sonos | 11 |
| 17 | Roblox | 12 |
| 18 | Squarespace | 6 |
| 19 | Vizio | 9 |
| >20 | Cytek | 17 |
Overall, unicorns exited after a median of eight years in business.
Companies like Facebook, LinkedIn, and Indeed are among the unicorns that exited in exactly eight years, which in total made up 10% of tracked exits. Another major example is Zoom, which launched in 2011 and went public in 2019 at a $9.2 billion valuation.
There were also many earlier exits, such as YouTube’s one-year turnaround from 2005 founding to 2006 acquisition by Google. Groupon also had an early exit just three years after its founding in 2008, after turning down an even earlier acquisition exit (also through Google).
In total, unicorn exits within 11 years or less accounted for just over three-quarters of tracked exits from 1997 to 2022. Many of the companies that took longer to exit also took longer to reach unicorn status, including website company Squarespace, which was founded in 2003 but didn’t reach a billion-dollar valuation until 2017 (and listed on the NYSE in 2021).
Unicorns, by Exit Strategy
Broadly speaking, there are three main types of exits: going public through an IPO, SPAC, or direct listing, being acquired, or liquidation/bankruptcy.
The most well-known are IPOs, or initial public offerings. These are the most common types of unicorn exits in strong market conditions, with 2021 seeing 79 unicorn IPOs globally, with $83 billion in proceeds.
| 2021 | 2022 | % Change | |
|---|---|---|---|
| # Unicorn IPOs | 79 | 13 | -84% |
| Proceeds | $82.9B | $5.3B | -94% |
But the number of IPOs drops drastically given weaker market performance, as seen above. At the end of 2022, an estimated 91% of unicorn IPOs listed since 2021 had share prices fall below their IPO price.
A less common unicorn exit is an SPAC (special purpose acquisition company), although they’ve been gaining momentum and were used by WeWork and BuzzFeed. With an SPAC, a shell company raises money in an IPO and merges with a private company to take it public.
Finally, while an IPO lists new shares to the public with an underwriter, a direct listing sells existing shares without an underwriter. Though it was historically seen as a cheaper IPO alternative, some well-known unicorns have used direct listings including Roblox and Coinbase.
And as valuations for unicorns (and their public listings) have grown, acquisitions have become less frequent. Additionally, many major firms have been buying back shares since 2022 to shore up investor confidence instead of engaging in acquisitions.
Slower Exit Activity
While the growth of unicorns has been exponential over the last decade, exit activity has virtually ground to a halt in 2023.
Investor caution and increased conservation of capital have contributed to the lack of unicorn exits. As of the second quarter of 2023, just eight unicorns in the U.S. exited. These include Mosaic ML, an artificial intelligence startup, and carbon recycling firm LanzaTech.
As exit activity declines, companies may halt listing plans and eventually slow expansion and cut costs. What’s uncertain is whether or not this lull in unicorn exits—and declining influx of private capital influx—is temporary or part of a long-term readjustment.

-

 Mining2 weeks ago
Charted: The Value Gap Between the Gold Price and Gold Miners
-

 Real Estate1 week ago
Ranked: The Most Valuable Housing Markets in America
-

 Business1 week ago
Charted: Big Four Market Share by S&P 500 Audits
-

 AI1 week ago
The Stock Performance of U.S. Chipmakers So Far in 2024
-

 Misc1 week ago
Almost Every EV Stock is Down After Q1 2024
-

 Money2 weeks ago
Where Does One U.S. Tax Dollar Go?
-

 Green2 weeks ago
Ranked: Top Countries by Total Forest Loss Since 2001
-

 Real Estate2 weeks ago
Visualizing America’s Shortage of Affordable Homes