Datastream
Visualized: the World’s Deadliest Pandemics by Population Impact


The Briefing
- As of May 27, 2021, COVID has claimed the lives of almost 3.5 million people worldwide
- That’s 0.04% of the global population
- We’ll be updating this graphic as the current pandemic continues
Visualizing the World’s Deadliest Pandemics
Humanity has been battling against disease for centuries.
And while most contagious outbreaks have never reached full-blown pandemic status, there have been several times throughout history when a disease has caused mass devastation.
Here’s a look at the world’s deadliest pandemics to date, viewed from the lens of the impact they had on the global population at the time.
Editor’s note: The above graphic was created in response to a popular request from users after viewing our popular history of pandemics infographic initially released a year ago.
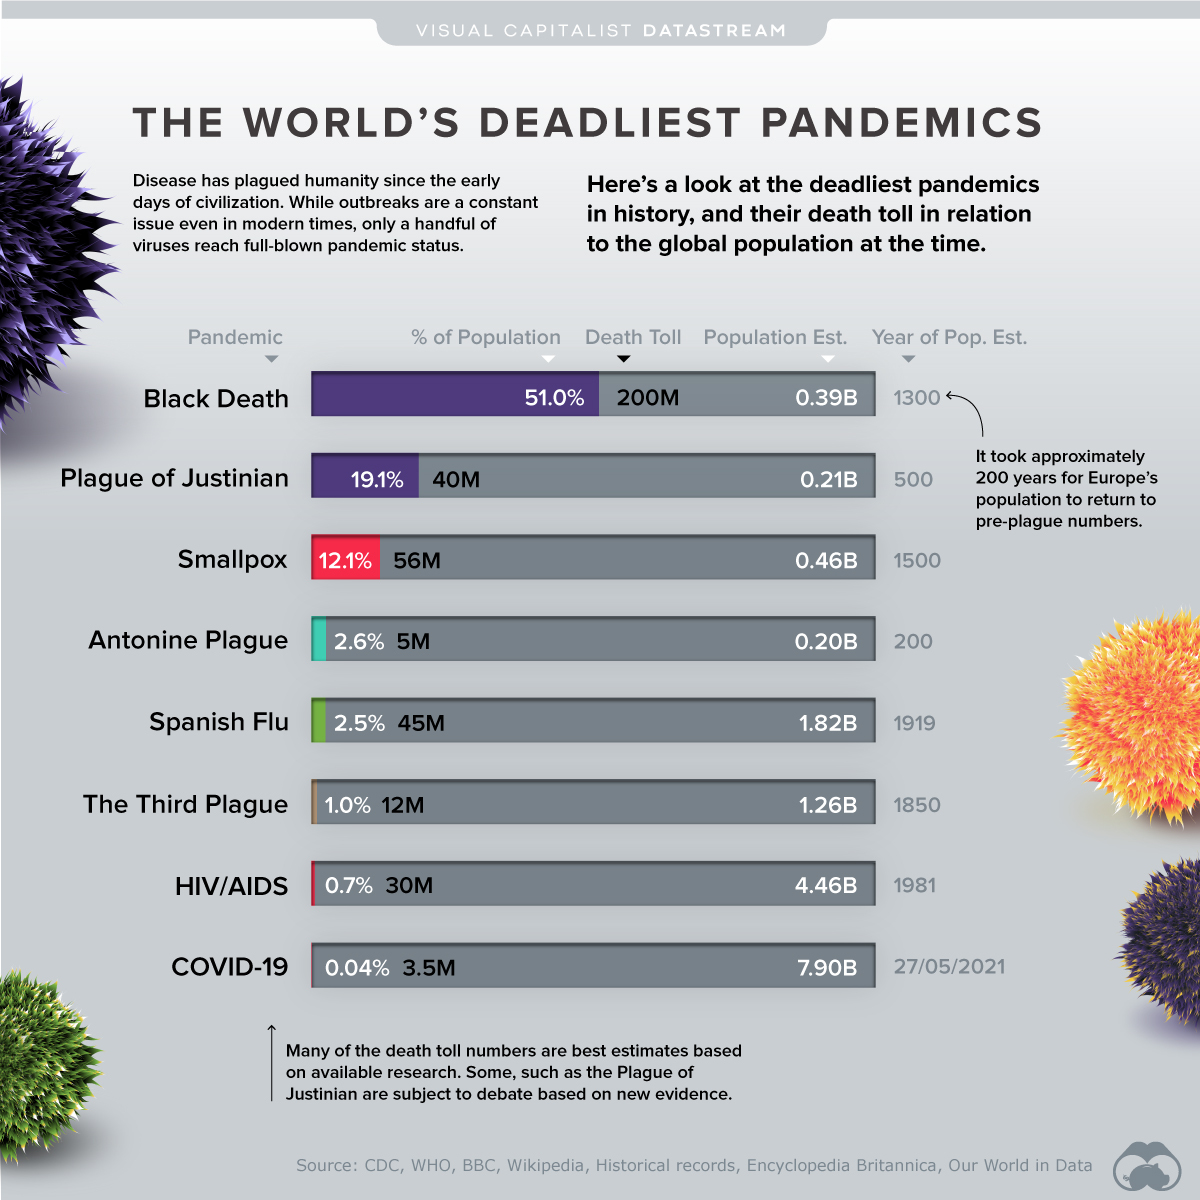
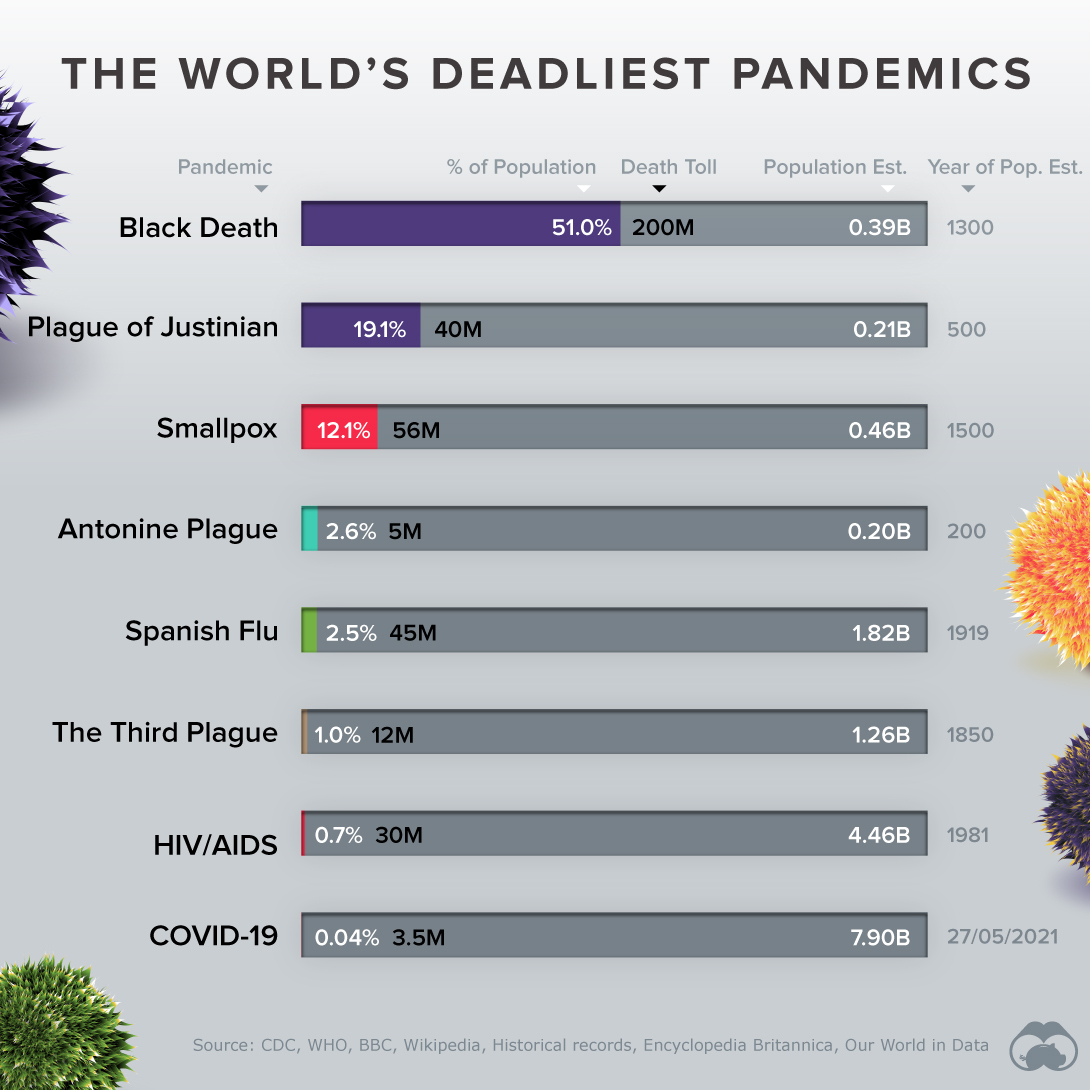
Death Toll, by Percent of Population
In the mid-1300s, a plague known as the Black Death claimed the lives of roughly 200 million people—more than 50% of the global population at that time.
Here’s how the death toll by population stacks up for other significant pandemics, including COVID-19 so far.
| Pandemic | Death Toll by % of Population | Year of Population Estimate |
|---|---|---|
| Black Death | 51.0% | 1300 |
| Plague of Justinian | 19.1% | 500 |
| Smallpox | 12.1% | 1500 |
| Antonine Plague | 2.6% | 200 |
| Spanish Flu | 2.5% | 1919 |
| The Third Plague | 1.0% | 1850 |
| HIV/AIDS | 0.7% | 1981 |
| COVID-19 | 0.04% | 2021 (as of May 27) |
The specific cause of the Black Death is still up for debate. Many experts claim the 14th-century pandemic was caused by a bubonic plague, meaning there was no human-to-human transmission, while others argue it was possibly pneumonic.
Interestingly, the plague still exists today—however, it’s significantly less deadly, thanks to modern antibiotics.
History Repeats, But at Least We Keep Learning
While we clearly haven’t eradicated infection diseases from our lives entirely, we’ve at least come a long way in our understanding of what causes illness in the first place.
In ancient times, people believed gods and spirits caused diseases and widespread destruction. But by the 19th century, a scientist named Louis Pasteur (based on findings by Robert Koch) discovered germ theory—the idea that small organisms caused disease.
What will we discover next, and how will it impact our response to disease in the future?
»Like this? Check out our full-length article The History of Pandemics
Where does this data come from?
Source:CDC, WHO, Johns Hopkins University, Encyclopedia Britannica, Historical Records
Notes: Many of the death toll numbers are best estimates based on available research. Some, such as the Plague of Justinian, are subject to debate based on new evidence


Datastream
Can You Calculate Your Daily Carbon Footprint?
Discover how the average person’s carbon footprint impacts the environment and learn how carbon credits can offset your carbon footprint.


The Briefing
- A person’s carbon footprint is substantial, with activities such as food consumption creating as much as 4,500 g of CO₂ emissions daily.
- By purchasing carbon credits from Carbon Streaming Corporation, you can offset your own emissions and fund positive climate action.
Your Everyday Carbon Footprint
While many large businesses and countries have committed to net-zero goals, it is essential to acknowledge that your everyday activities also contribute to global emissions.
In this graphic, sponsored by Carbon Streaming Corporation, we will explore how the choices we make and the products we use have a profound impact on our carbon footprint.
Carbon Emissions by Activity
Here are some of the daily activities and products of the average person and their carbon footprint, according to Clever Carbon.
| Household Activities & Products | CO2 Emissions (g) |
|---|---|
| 💡 Standard Light Bulb (100 watts, four hours) | 172 g |
| 📱 Mobile Phone Use (195 minutes per day)* | 189 g |
| 👕 Washing Machine (0.63 kWh) | 275 g |
| 🔥 Electric Oven (1.56 kWh) | 675 g |
| ♨️ Tumble Dryer (2.5 kWh) | 1,000 g |
| 🧻 Toilet Roll (2 ply) | 1,300 g |
| 🚿 Hot Shower (10 mins) | 2,000 g |
| 🚙 Daily Commute (one hour, by car) | 3,360 g |
| 🍽️ Average Daily Food Consumption (three meals of 600 calories) | 4,500 g |
| *Phone use based on yearly use of 69kg per the source, Reboxed | |
Your choice of transportation plays a crucial role in determining your carbon footprint. For instance, a 15 km daily commute to work on public transport generates an average of 1,464 g of CO₂ emissions. Compared to 3,360 g—twice the volume for a journey the same length by car.
By opting for more sustainable modes of transport, such as cycling, walking, or public transportation, you can significantly reduce your carbon footprint.
Addressing Your Carbon Footprint
One way to compensate for your emissions is by purchasing high-quality carbon credits.
Carbon credits are used to help fund projects that avoid, reduce or remove CO₂ emissions. This includes nature-based solutions such as reforestation and improved forest management, or technology-based solutions such as the production of biochar and carbon capture and storage (CCS).
While carbon credits offer a potential solution for individuals to help reduce global emissions, public awareness remains a significant challenge. A BCG-Patch survey revealed that only 34% of U.S. consumers are familiar with carbon credits, and only 3% have purchased them in the past.
About Carbon Streaming
By financing the creation or expansion of carbon projects, Carbon Streaming Corporation secures the rights to future carbon credits generated by these sustainable projects. You can then purchase these carbon credits to help fund climate solutions around the world and compensate for your own emissions.
Ready to get involved?
>> Learn more about purchasing carbon credits at Carbon Streaming

-

 Markets6 days ago
The Most Valuable Companies in Major EU Economies
-

 Wealth2 weeks ago
Charted: Which City Has the Most Billionaires in 2024?
-

 Technology2 weeks ago
All of the Grants Given by the U.S. CHIPS Act
-

 Green2 weeks ago
The Carbon Footprint of Major Travel Methods
-

 United States1 week ago
Visualizing the Most Common Pets in the U.S.
-

 Culture1 week ago
The World’s Top Media Franchises by All-Time Revenue
-

 voronoi1 week ago
Best Visualizations of April on the Voronoi App
-

 Wealth1 week ago
Charted: Which Country Has the Most Billionaires in 2024?