Technology
Which U.S. Generation Wields the Most Cultural Power?

Introducing our new index, which ranks U.S. generations on their economic, political, and cultural influence.


Which U.S. Generation Wields the Most Cultural Power?
This year, our team put together Visual Capitalist’s inaugural Generational Power Index (GPI), which looks at power dynamics across generations in America.
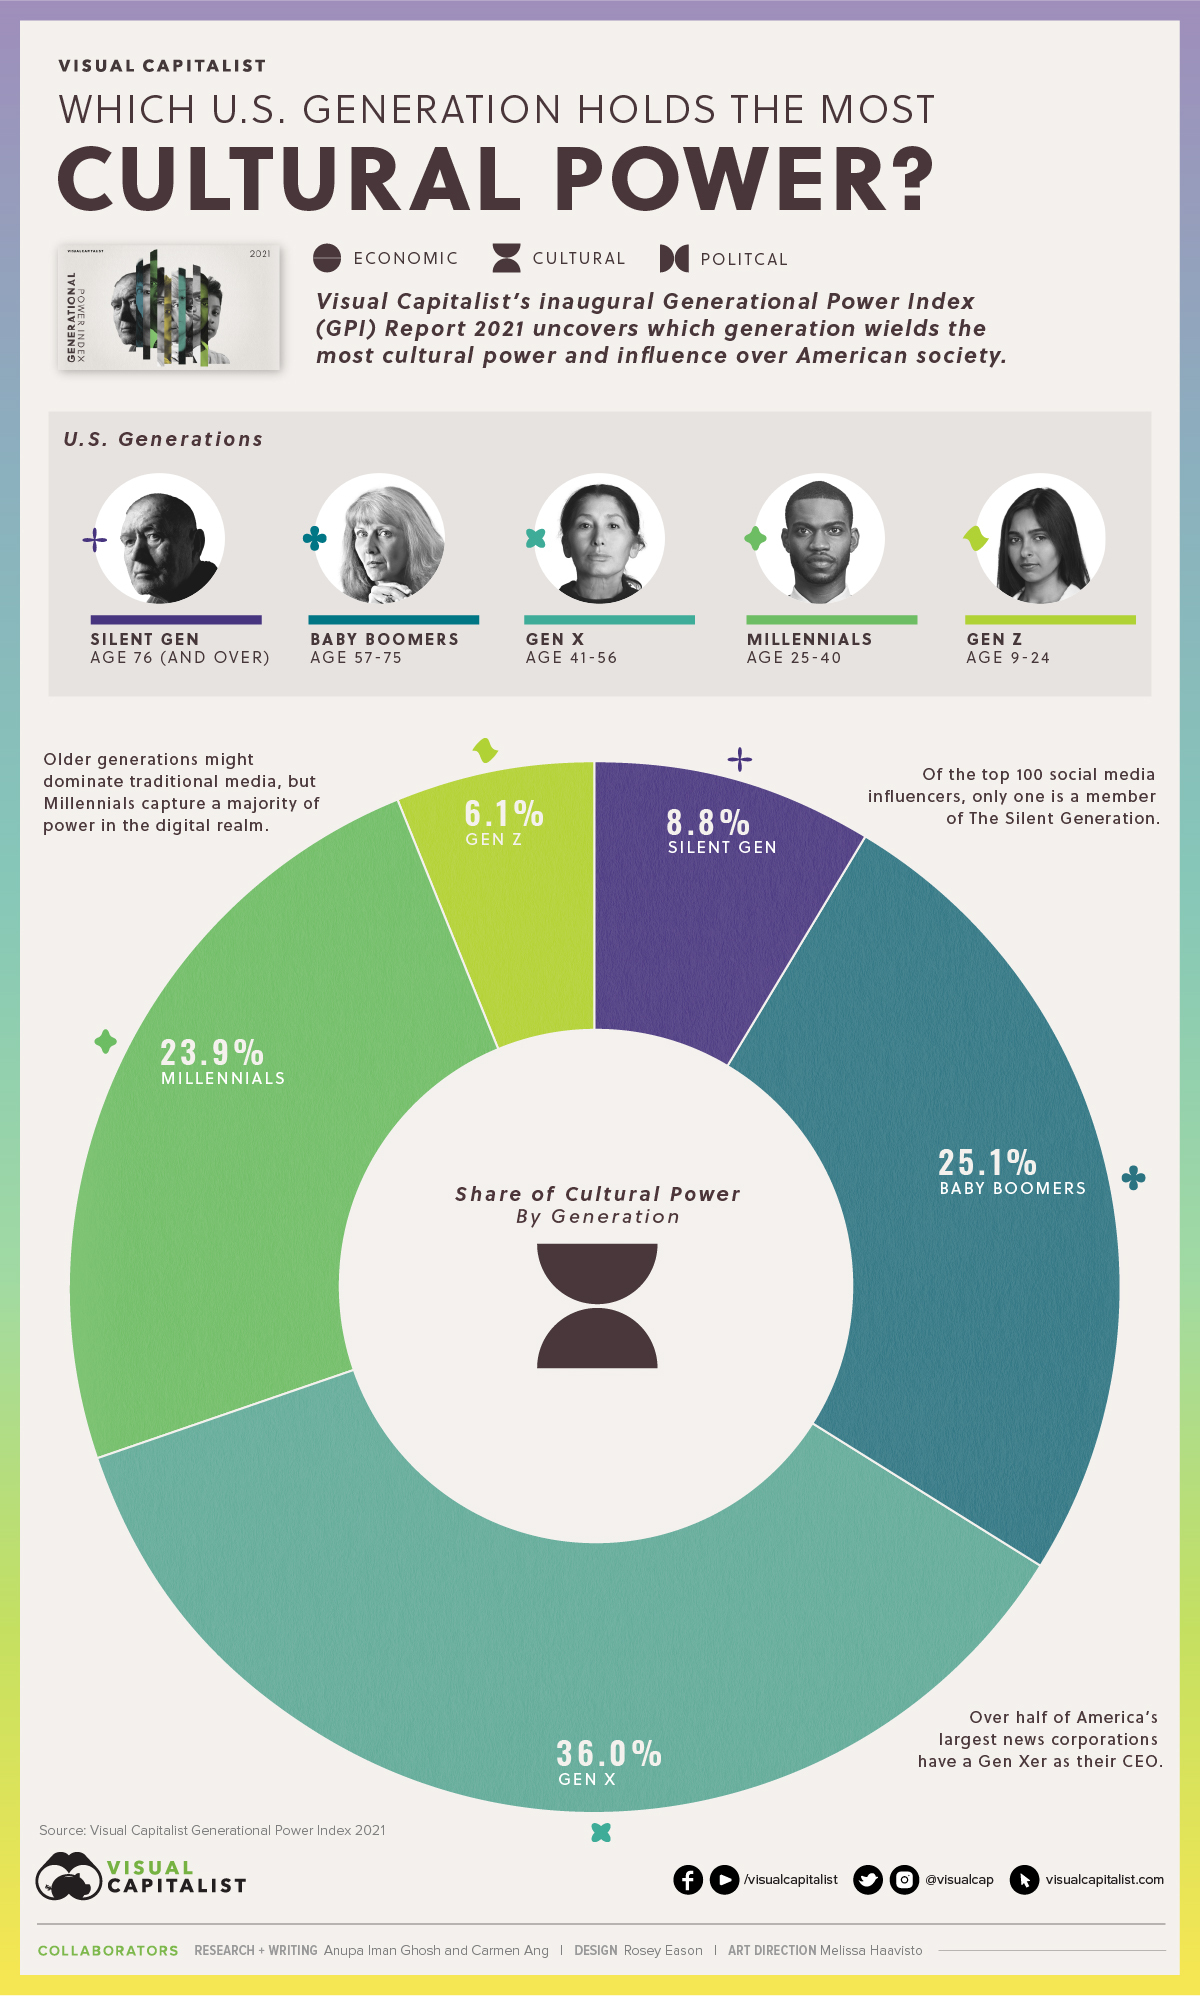
We considered three categories in our quest to quantify power: economics, political, and cultural. And while it turns out Baby Boomers dominate when it comes to economics and political factors—cultural influence is a different story.
Here’s a look at which U.S. generation holds the most cultural power, and how this power dynamic is expected to shift in the coming years.
Generations and Power, Defined
Before we get started, it’s important to clarify which generations we’ve included in our research, along with their age and birth year ranges.
| Generation | Age range (years) | Birth year range |
|---|---|---|
| The Silent Generation | 76 and over | 1928-1945 |
| Baby Boomers | 57-75 | 1946-1964 |
| Gen X | 41-56 | 1965-1980 |
| Millennials | 25-40 | 1981-1996 |
| Gen Z | 9-24 | 1997-2012 |
| Gen Alpha | 8 and below | 2013-present |
Using these age groups as a framework, we then calculated the Cultural Power category using these distinct equally-weighted variables:
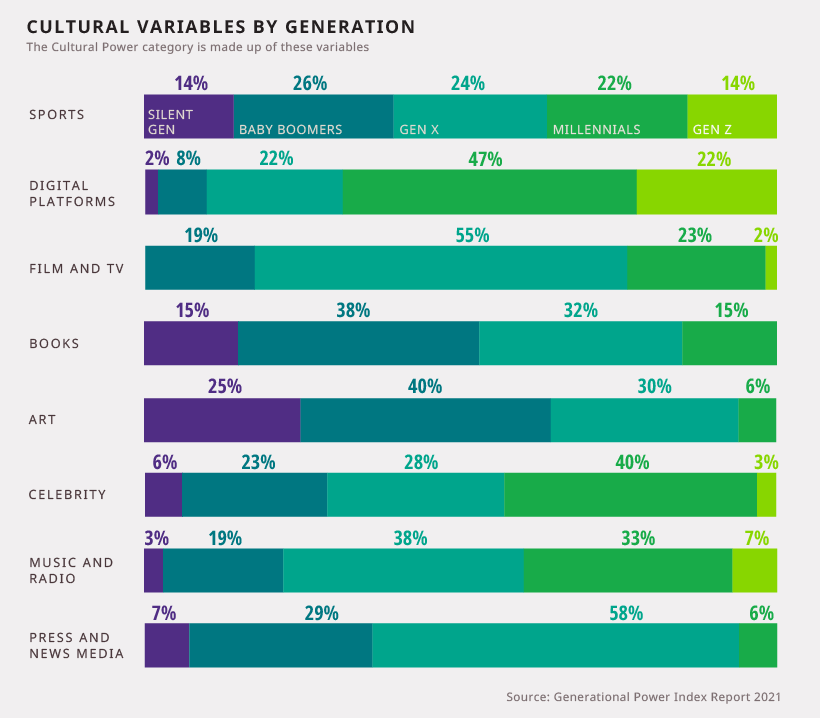
With this methodology in mind, here’s how the Cultural Power category shakes out, using insights from the GPI.
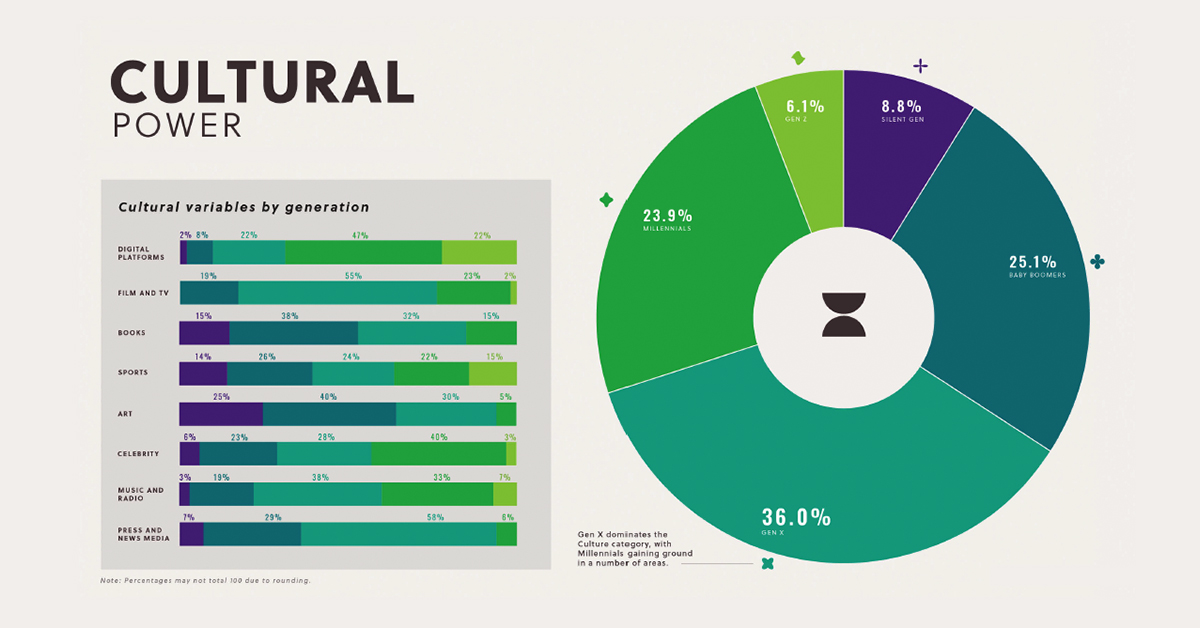
Share of Cultural Power by Generation
Overall, we found that Gen X captures the largest share of cultural power, at 36%.
| Generation | Cultural Power Share |
|---|---|
| The Silent Generation | 8.8% |
| Baby Boomers | 25.1% |
| Gen X | 36.0% |
| Millennials | 23.9% |
| Gen Z | 6.1% |
| Gen Alpha | 0.00% |
| Total | 99.9% |
*Note: figures may not add up to 100% due to rounding.
Gen X is particularly dominant in the film and TV industry, along with news media. For instance, over half of America’s largest news corporations have a Gen Xer as their CEO, and roughly 50% of Oscar winners in 2020 were members of Gen X.
Baby Boomers come in second place, capturing a 25% share of cultural power. They show particular dominance in traditional entertainment like books and art. For example, 42% of the authors on the NYT’s best-selling books list were Baby Boomers.
However, these older generations fall short in one critical category—digital platforms.
The Dominance of Digital
Why is digital so important when it comes to cultural power? Because digital media becoming increasingly more popular than traditional media sources (e.g. TV, radio).
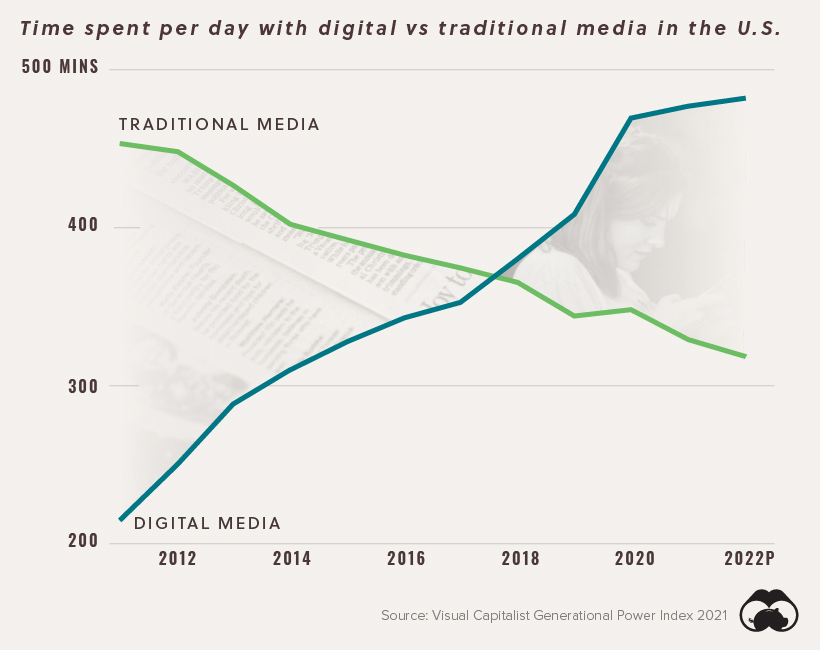
In 2020, Americans spent nearly 8 hours per day consuming digital media, nearly two hours more per day than they spent with traditional media.
This divide is expected to grow even further over the next few years. With younger generations dominating the digital space, Gen X may soon lose its place as the top dog of the culture category.
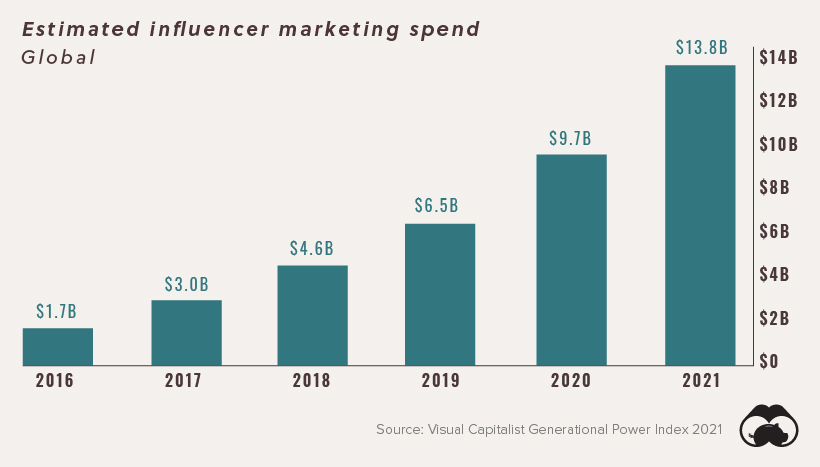
Celebrity 2.0: The Social Influencer
As audiences flock to online channels, advertisers have followed suit—and they’re willing to spend good money to gain access to their target demographics.
In fact, spend on influencer marketing has steadily increased in the last five years, and it’s expected to reach $13.8 billion by the end of 2021.
This shift to social media advertising is redefining the notion of celebrity, and who reaps the financial benefits of content creation. For instance, six-year-old Vlogger Like Nastya made an estimated $7.7 million per month from her YouTube channel in 2020. And keep in mind, this estimate is purely based on YouTube revenue—it doesn’t even include corporate partnerships and/or merchandise sales.
With all these shifts occurring, culture as we know it is at a crossroads. And as we continue to move towards a digital dominant society, those who hold power in traditional realms will either adapt or pass along the torch.
Download the Generational Power Report (.pdf)


Technology
Visualizing AI Patents by Country
See which countries have been granted the most AI patents each year, from 2012 to 2022.


Visualizing AI Patents by Country
This was originally posted on our Voronoi app. Download the app for free on iOS or Android and discover incredible data-driven charts from a variety of trusted sources.
This infographic shows the number of AI-related patents granted each year from 2010 to 2022 (latest data available). These figures come from the Center for Security and Emerging Technology (CSET), accessed via Stanford University’s 2024 AI Index Report.
From this data, we can see that China first overtook the U.S. in 2013. Since then, the country has seen enormous growth in the number of AI patents granted each year.
| Year | China | EU and UK | U.S. | RoW | Global Total |
|---|---|---|---|---|---|
| 2010 | 307 | 137 | 984 | 571 | 1,999 |
| 2011 | 516 | 129 | 980 | 581 | 2,206 |
| 2012 | 926 | 112 | 950 | 660 | 2,648 |
| 2013 | 1,035 | 91 | 970 | 627 | 2,723 |
| 2014 | 1,278 | 97 | 1,078 | 667 | 3,120 |
| 2015 | 1,721 | 110 | 1,135 | 539 | 3,505 |
| 2016 | 1,621 | 128 | 1,298 | 714 | 3,761 |
| 2017 | 2,428 | 144 | 1,489 | 1,075 | 5,136 |
| 2018 | 4,741 | 155 | 1,674 | 1,574 | 8,144 |
| 2019 | 9,530 | 322 | 3,211 | 2,720 | 15,783 |
| 2020 | 13,071 | 406 | 5,441 | 4,455 | 23,373 |
| 2021 | 21,907 | 623 | 8,219 | 7,519 | 38,268 |
| 2022 | 35,315 | 1,173 | 12,077 | 13,699 | 62,264 |
In 2022, China was granted more patents than every other country combined.
While this suggests that the country is very active in researching the field of artificial intelligence, it doesn’t necessarily mean that China is the farthest in terms of capability.
Key Facts About AI Patents
According to CSET, AI patents relate to mathematical relationships and algorithms, which are considered abstract ideas under patent law. They can also have different meaning, depending on where they are filed.
In the U.S., AI patenting is concentrated amongst large companies including IBM, Microsoft, and Google. On the other hand, AI patenting in China is more distributed across government organizations, universities, and tech firms (e.g. Tencent).
In terms of focus area, China’s patents are typically related to computer vision, a field of AI that enables computers and systems to interpret visual data and inputs. Meanwhile America’s efforts are more evenly distributed across research fields.
Learn More About AI From Visual Capitalist
If you want to see more data visualizations on artificial intelligence, check out this graphic that shows which job departments will be impacted by AI the most.

-

 Mining1 week ago
Gold vs. S&P 500: Which Has Grown More Over Five Years?
-

 Markets2 weeks ago
Ranked: The Most Valuable Housing Markets in America
-

 Money2 weeks ago
Which States Have the Highest Minimum Wage in America?
-

 AI2 weeks ago
Ranked: Semiconductor Companies by Industry Revenue Share
-

 Markets2 weeks ago
Ranked: The World’s Top Flight Routes, by Revenue
-

 Countries2 weeks ago
Population Projections: The World’s 6 Largest Countries in 2075
-

 Markets2 weeks ago
The Top 10 States by Real GDP Growth in 2023
-

 Demographics2 weeks ago
The Smallest Gender Wage Gaps in OECD Countries