Markets
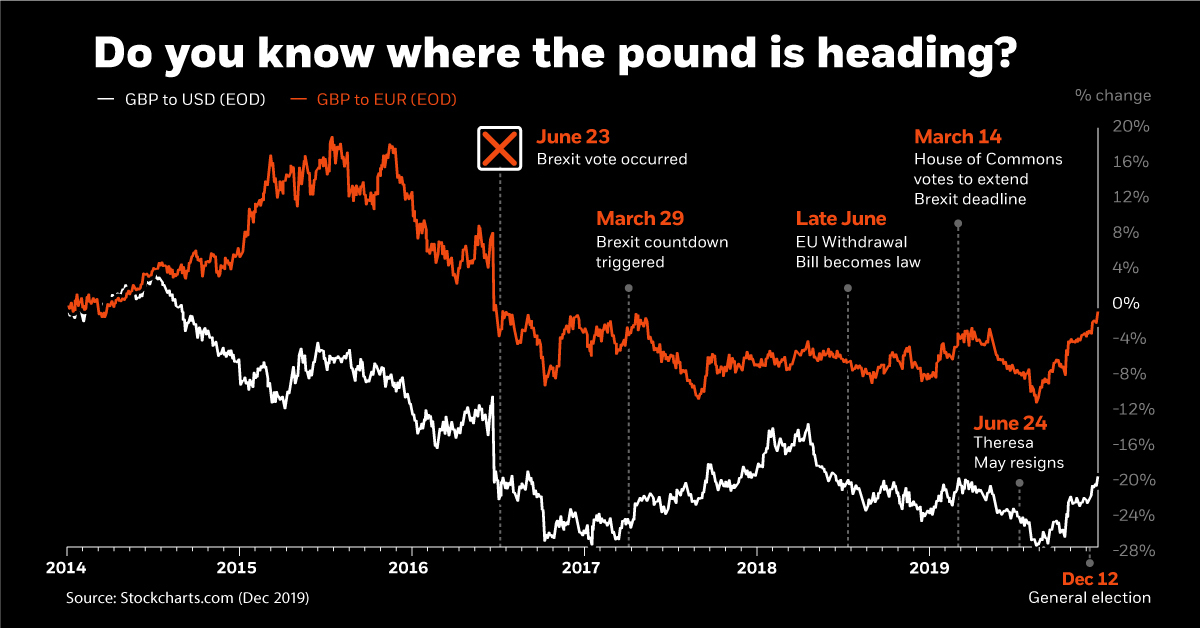
Do You Know Where the British Pound is Heading?
In developed economies around the world, it’s generally expected that currencies will retain their purchasing power over time.
While this is most often the case, sometimes there are situations in which currency markets begin acting in ways that are less predictable.
Growing amounts of political or economic uncertainty, for example, can cause a currency to experience amplified levels of volatility — an environment in which it may see bigger ups and downs than most market participants are used to.
Brexit, Currency Risk, and the Pound
Today’s infographic comes to us from BlackRock, and it focuses in on the recent volatility of the British pound to illustrate how currency risk can impact a UK investor’s portfolio, and how this risk can be mitigated through currency hedging techniques.

Currency risk is present in any unhedged portfolio that holds investments denominated in international currencies.
When currencies experience increased levels of volatility — such as the British pound over the last five years — it can make this risk even more evident, ultimately impacting investor returns.
Brexit in Focus
In the lead-up to the EU Referendum in June 2016, and certainly afterwards, it’s been clear that the sterling has decoupled from its typical trading patterns.
Sterling volatility, as you would know, is at emerging market levels and has decoupled from other advanced economy pairs.
– Mark Carney, Bank of England (September 2019)
Every twist and turn in the Brexit saga has helped stoke fluctuations in the value of the pound, especially in usually stable pairs such as EUR/GBP or USD/GBP. It is possible that these swings could continue throughout 2020, and even beyond.
What impact can these fluctuations have on investment portfolios, and what can investors do to avoid them?
Currency Risk 101
The challenge of currency risk is that it can affect returns, either positively or negatively.
In other words, in addition to the risk you are exposed to by owning a particular investment, you are also at the mercy of foreign exchange rates. This means the performance of your investment could be canceled out by currency fluctuations, or returns could be amplified if exchange rate movements are to your advantage.
For example, in a typical UK portfolio that holds 60% global equities and 40% global bonds, currency risk actually has the highest projected risk contribution:
Projected Risk Contribution (60/40 Global Portfolio)
- Foreign Exchange Risk: 4.55%
- Equity Risk: 3.36%
- Interest Rate Risk: 0.44%
- Spread Risk: 0.06%
- Total: 8.40%
When there is added volatility in currency markets, like in recent times, even a home-biased portfolio can be adversely affected. Given this, how can investors be sure they are getting a return from the underlying assets in a portfolio, instead of from unpredictable currency swings?
To Hedge, or Not to Hedge
There is a range of strategies that allow investors to hedge currency risk, but one simpler option may be to simply buy a fund (such as an ETF) that is hedged.
That said, not all investors may want to hedge currency risk. For example, an investor has a specific foreign exchange view (i.e. that a currency will go up or down in value) may want to purposefully get exposure to currency risk to take advantage of this view.
While it may not always make sense to use currency-hedged funds, they can reduce the overall investment risk on international exposures.
And if you are not so sure of where the pound is heading in coming months, now could potentially be a good time to explore such a tool.


Markets
U.S. Debt Interest Payments Reach $1 Trillion
U.S. debt interest payments have surged past the $1 trillion dollar mark, amid high interest rates and an ever-expanding debt burden.


U.S. Debt Interest Payments Reach $1 Trillion
This was originally posted on our Voronoi app. Download the app for free on iOS or Android and discover incredible data-driven charts from a variety of trusted sources.
The cost of paying for America’s national debt crossed the $1 trillion dollar mark in 2023, driven by high interest rates and a record $34 trillion mountain of debt.
Over the last decade, U.S. debt interest payments have more than doubled amid vast government spending during the pandemic crisis. As debt payments continue to soar, the Congressional Budget Office (CBO) reported that debt servicing costs surpassed defense spending for the first time ever this year.
This graphic shows the sharp rise in U.S. debt payments, based on data from the Federal Reserve.
A $1 Trillion Interest Bill, and Growing
Below, we show how U.S. debt interest payments have risen at a faster pace than at another time in modern history:
| Date | Interest Payments | U.S. National Debt |
|---|---|---|
| 2023 | $1.0T | $34.0T |
| 2022 | $830B | $31.4T |
| 2021 | $612B | $29.6T |
| 2020 | $518B | $27.7T |
| 2019 | $564B | $23.2T |
| 2018 | $571B | $22.0T |
| 2017 | $493B | $20.5T |
| 2016 | $460B | $20.0T |
| 2015 | $435B | $18.9T |
| 2014 | $442B | $18.1T |
| 2013 | $425B | $17.2T |
| 2012 | $417B | $16.4T |
| 2011 | $433B | $15.2T |
| 2010 | $400B | $14.0T |
| 2009 | $354B | $12.3T |
| 2008 | $380B | $10.7T |
| 2007 | $414B | $9.2T |
| 2006 | $387B | $8.7T |
| 2005 | $355B | $8.2T |
| 2004 | $318B | $7.6T |
| 2003 | $294B | $7.0T |
| 2002 | $298B | $6.4T |
| 2001 | $318B | $5.9T |
| 2000 | $353B | $5.7T |
| 1999 | $353B | $5.8T |
| 1998 | $360B | $5.6T |
| 1997 | $368B | $5.5T |
| 1996 | $362B | $5.3T |
| 1995 | $357B | $5.0T |
| 1994 | $334B | $4.8T |
| 1993 | $311B | $4.5T |
| 1992 | $306B | $4.2T |
| 1991 | $308B | $3.8T |
| 1990 | $298B | $3.4T |
| 1989 | $275B | $3.0T |
| 1988 | $254B | $2.7T |
| 1987 | $240B | $2.4T |
| 1986 | $225B | $2.2T |
| 1985 | $219B | $1.9T |
| 1984 | $205B | $1.7T |
| 1983 | $176B | $1.4T |
| 1982 | $157B | $1.2T |
| 1981 | $142B | $1.0T |
| 1980 | $113B | $930.2B |
| 1979 | $96B | $845.1B |
| 1978 | $84B | $789.2B |
| 1977 | $69B | $718.9B |
| 1976 | $61B | $653.5B |
| 1975 | $55B | $576.6B |
| 1974 | $50B | $492.7B |
| 1973 | $45B | $469.1B |
| 1972 | $39B | $448.5B |
| 1971 | $36B | $424.1B |
| 1970 | $35B | $389.2B |
| 1969 | $30B | $368.2B |
| 1968 | $25B | $358.0B |
| 1967 | $23B | $344.7B |
| 1966 | $21B | $329.3B |
Interest payments represent seasonally adjusted annual rate at the end of Q4.
At current rates, the U.S. national debt is growing by a remarkable $1 trillion about every 100 days, equal to roughly $3.6 trillion per year.
As the national debt has ballooned, debt payments even exceeded Medicaid outlays in 2023—one of the government’s largest expenditures. On average, the U.S. spent more than $2 billion per day on interest costs last year. Going further, the U.S. government is projected to spend a historic $12.4 trillion on interest payments over the next decade, averaging about $37,100 per American.
Exacerbating matters is that the U.S. is running a steep deficit, which stood at $1.1 trillion for the first six months of fiscal 2024. This has accelerated due to the 43% increase in debt servicing costs along with a $31 billion dollar increase in defense spending from a year earlier. Additionally, a $30 billion increase in funding for the Federal Deposit Insurance Corporation in light of the regional banking crisis last year was a major contributor to the deficit increase.
Overall, the CBO forecasts that roughly 75% of the federal deficit’s increase will be due to interest costs by 2034.

-

 Maps2 weeks ago
Mapped: Average Wages Across Europe
-

 Money1 week ago
Which States Have the Highest Minimum Wage in America?
-

 Real Estate1 week ago
Ranked: The Most Valuable Housing Markets in America
-

 Markets1 week ago
Charted: Big Four Market Share by S&P 500 Audits
-

 AI1 week ago
The Stock Performance of U.S. Chipmakers So Far in 2024
-

 Misc1 week ago
Almost Every EV Stock is Down After Q1 2024
-

 Money2 weeks ago
Where Does One U.S. Tax Dollar Go?
-

 Green2 weeks ago
Ranked: Top Countries by Total Forest Loss Since 2001