Markets
Where Investors Put Their Money in 2018

Where Investors Put Their Money in 2018
For most investors, 2018 was both an eventful and frustrating year.
Between the looming threat of trade wars and growing geopolitical uncertainty, the market also skipped a beat. Volatility took center stage, and the S&P 500 finished in negative territory for the first time in 10 years.
Although many asset classes finished in negative territory, a look at fund flows – essentially where investors put their money – helps paint a more intricate picture of the year for investors.
Visualizing 2018 Fund Flows
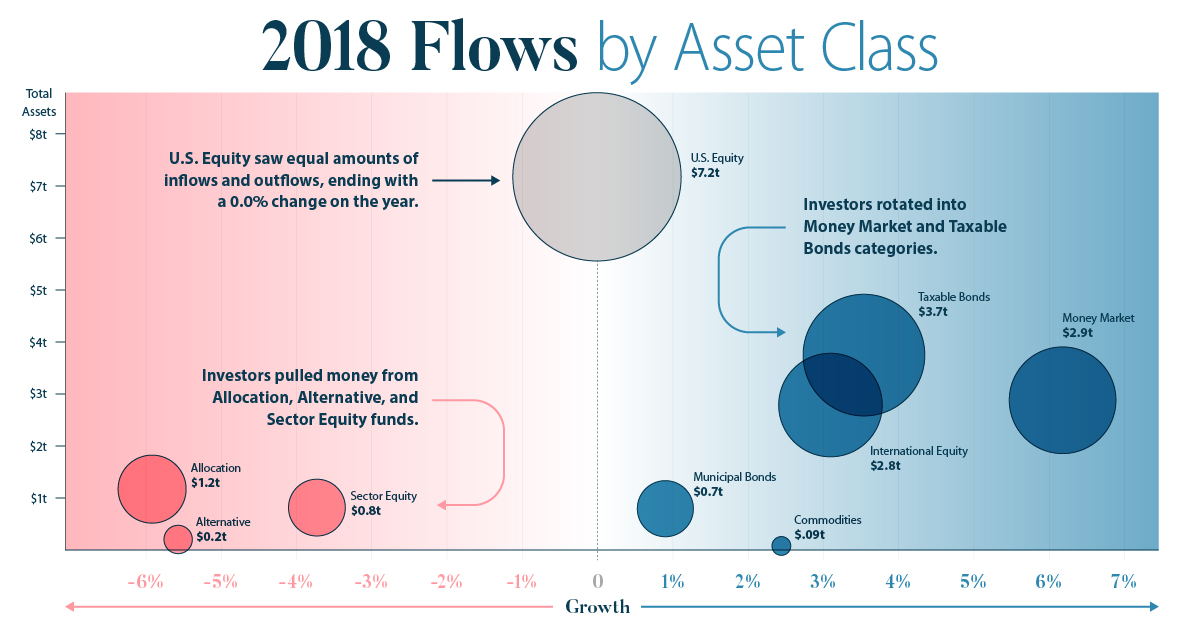
Today’s infographic comes to us from New York Life Investments, and it visualizes the flows in and out of U.S. funds for 2018.
It not only shows when investors poured money into mutual funds or ETFs, but it also breaks down these funds by various categorizations. For example, when did people buy funds that held U.S. equities, and when did they buy funds that primarily held money market securities?
Let’s dive into the data, to take a deeper look.
Mutual Funds vs. ETFs
For another year in a row, ETFs gained ground on mutual funds:
| Type of Fund | 2018 Fund Flows | Total Assets (End of Year) |
|---|---|---|
| ETFs | +$238.4 billion | $3.4 trillion (17.2%) |
| Mutual Funds | -$91.3 billion | $16.3 trillion (82.8%) |
However, despite growing for another year, ETFs still make up a smaller part of the overall fund universe.
Flows by Asset Class Group
Every fund gets classified by Morningstar based on the types of assets it holds.
For example, a fund that focuses on holding fast-growing, large tech companies in the U.S. would be classified broadly as “U.S. Equity”, and more specifically as “U.S. Equity – Large Growth”.
Here’s how flows went, within these broader groups:
| Fund Category Group | Total Assets ($mm) | Growth in 2018 |
|---|---|---|
| Allocation | $ 1,171,166 | -5.9% |
| Alternative | $ 203,343 | -5.7% |
| Commodities | $ 88,939 | 2.4% |
| International Equity | $ 2,787,400 | 3.1% |
| Money Market | $ 2,879,510 | 6.2% |
| Municipal Bonds | $ 795,132 | 0.9% |
| Sector Equity | $ 816,149 | -3.7% |
| Taxable Bonds | $ 3,747,268 | 3.5% |
| U.S. Equity | $ 7,173,902 | 0.0% |
Investors pulled money from Allocation, Alternative, and Sector Equity funds, while rotating into Money Market and Taxable Bonds categories. These latter assets are considered safer, and this shift is not surprising considering the market volatility towards the end of the year.
Also interesting here is that U.S. Equity – the biggest category overall by total assets – saw equal amounts of inflows and outflows, ending with a 0.0% change on the year.
U.S. Equity: A Closer Look
U.S. Equity ended the year with zero change, but it’s also the biggest and broadest category.
Let’s break it down further – first, we’ll look at what happened to flows by market capitalization (small, mid, and large cap stocks):
| Market Capitalization | Assets | Growth (2018) |
|---|---|---|
| Large Caps | $5.6 trillion | 0.2% |
| Mid Caps | $884 billion | -2.5% |
| Small Caps | $672 billion | 1.7% |
Investment in funds that held large cap stocks increased by 0.2%, while the money allocated to small caps rose by 1.7% over 2018. Interestingly, investors pulled money out of mid caps (-2.5%).
Now, let’s look at U.S. Equity by type of strategy:
| Fund Strategy | Assets | Growth (2018) |
|---|---|---|
| Growth | $2.0 trillion | -2.1% |
| Value | $1.4 trillion | -2.8% |
| Blend | $3.8 trillion | 2.2% |
According to these flows, investors pulled money from funds focused solely on value or growth, while instead preferring funds that were a blend of the two strategies.
International Equities
Finally, let’s see the types of international funds that investors bought and sold over 2018.
| Region | Growth (2018) |
|---|---|
| China | 35.5% |
| Diversified Emerging Markets | 4.9% |
| Latin America | 4.3% |
| Foreign/World | 3.9% |
| Diversified Asia/Pacific | -5.6% |
| Pacific/Asia ex-Japan | -7.1% |
| Japan | -9.0% |
| India | -11.3% |
| Europe | -23.4% |
Investors eschewed funds that had a primary focus on European, Indian, and Japanese markets, while piling into funds that held Chinese equities. Meanwhile, Latin America and emerging markets also got some love from investors.
Conclusion
While 2018 was an eventful year for markets, this recap shows that investors are adjusting their portfolios accordingly.
Where will investors put their money in 2019?


Markets
U.S. Debt Interest Payments Reach $1 Trillion
U.S. debt interest payments have surged past the $1 trillion dollar mark, amid high interest rates and an ever-expanding debt burden.


U.S. Debt Interest Payments Reach $1 Trillion
This was originally posted on our Voronoi app. Download the app for free on iOS or Android and discover incredible data-driven charts from a variety of trusted sources.
The cost of paying for America’s national debt crossed the $1 trillion dollar mark in 2023, driven by high interest rates and a record $34 trillion mountain of debt.
Over the last decade, U.S. debt interest payments have more than doubled amid vast government spending during the pandemic crisis. As debt payments continue to soar, the Congressional Budget Office (CBO) reported that debt servicing costs surpassed defense spending for the first time ever this year.
This graphic shows the sharp rise in U.S. debt payments, based on data from the Federal Reserve.
A $1 Trillion Interest Bill, and Growing
Below, we show how U.S. debt interest payments have risen at a faster pace than at another time in modern history:
| Date | Interest Payments | U.S. National Debt |
|---|---|---|
| 2023 | $1.0T | $34.0T |
| 2022 | $830B | $31.4T |
| 2021 | $612B | $29.6T |
| 2020 | $518B | $27.7T |
| 2019 | $564B | $23.2T |
| 2018 | $571B | $22.0T |
| 2017 | $493B | $20.5T |
| 2016 | $460B | $20.0T |
| 2015 | $435B | $18.9T |
| 2014 | $442B | $18.1T |
| 2013 | $425B | $17.2T |
| 2012 | $417B | $16.4T |
| 2011 | $433B | $15.2T |
| 2010 | $400B | $14.0T |
| 2009 | $354B | $12.3T |
| 2008 | $380B | $10.7T |
| 2007 | $414B | $9.2T |
| 2006 | $387B | $8.7T |
| 2005 | $355B | $8.2T |
| 2004 | $318B | $7.6T |
| 2003 | $294B | $7.0T |
| 2002 | $298B | $6.4T |
| 2001 | $318B | $5.9T |
| 2000 | $353B | $5.7T |
| 1999 | $353B | $5.8T |
| 1998 | $360B | $5.6T |
| 1997 | $368B | $5.5T |
| 1996 | $362B | $5.3T |
| 1995 | $357B | $5.0T |
| 1994 | $334B | $4.8T |
| 1993 | $311B | $4.5T |
| 1992 | $306B | $4.2T |
| 1991 | $308B | $3.8T |
| 1990 | $298B | $3.4T |
| 1989 | $275B | $3.0T |
| 1988 | $254B | $2.7T |
| 1987 | $240B | $2.4T |
| 1986 | $225B | $2.2T |
| 1985 | $219B | $1.9T |
| 1984 | $205B | $1.7T |
| 1983 | $176B | $1.4T |
| 1982 | $157B | $1.2T |
| 1981 | $142B | $1.0T |
| 1980 | $113B | $930.2B |
| 1979 | $96B | $845.1B |
| 1978 | $84B | $789.2B |
| 1977 | $69B | $718.9B |
| 1976 | $61B | $653.5B |
| 1975 | $55B | $576.6B |
| 1974 | $50B | $492.7B |
| 1973 | $45B | $469.1B |
| 1972 | $39B | $448.5B |
| 1971 | $36B | $424.1B |
| 1970 | $35B | $389.2B |
| 1969 | $30B | $368.2B |
| 1968 | $25B | $358.0B |
| 1967 | $23B | $344.7B |
| 1966 | $21B | $329.3B |
Interest payments represent seasonally adjusted annual rate at the end of Q4.
At current rates, the U.S. national debt is growing by a remarkable $1 trillion about every 100 days, equal to roughly $3.6 trillion per year.
As the national debt has ballooned, debt payments even exceeded Medicaid outlays in 2023—one of the government’s largest expenditures. On average, the U.S. spent more than $2 billion per day on interest costs last year. Going further, the U.S. government is projected to spend a historic $12.4 trillion on interest payments over the next decade, averaging about $37,100 per American.
Exacerbating matters is that the U.S. is running a steep deficit, which stood at $1.1 trillion for the first six months of fiscal 2024. This has accelerated due to the 43% increase in debt servicing costs along with a $31 billion dollar increase in defense spending from a year earlier. Additionally, a $30 billion increase in funding for the Federal Deposit Insurance Corporation in light of the regional banking crisis last year was a major contributor to the deficit increase.
Overall, the CBO forecasts that roughly 75% of the federal deficit’s increase will be due to interest costs by 2034.

-

 Markets2 weeks ago
Visualizing America’s Shortage of Affordable Homes
-

 Technology1 week ago
Ranked: Semiconductor Companies by Industry Revenue Share
-

 Money1 week ago
Which States Have the Highest Minimum Wage in America?
-

 Real Estate1 week ago
Ranked: The Most Valuable Housing Markets in America
-

 Business2 weeks ago
Charted: Big Four Market Share by S&P 500 Audits
-

 AI2 weeks ago
The Stock Performance of U.S. Chipmakers So Far in 2024
-

 Misc2 weeks ago
Almost Every EV Stock is Down After Q1 2024
-

 Money2 weeks ago
Where Does One U.S. Tax Dollar Go?