Money
The Wealthiest and Poorest County in Every State
View a high resolution version of this graphic.
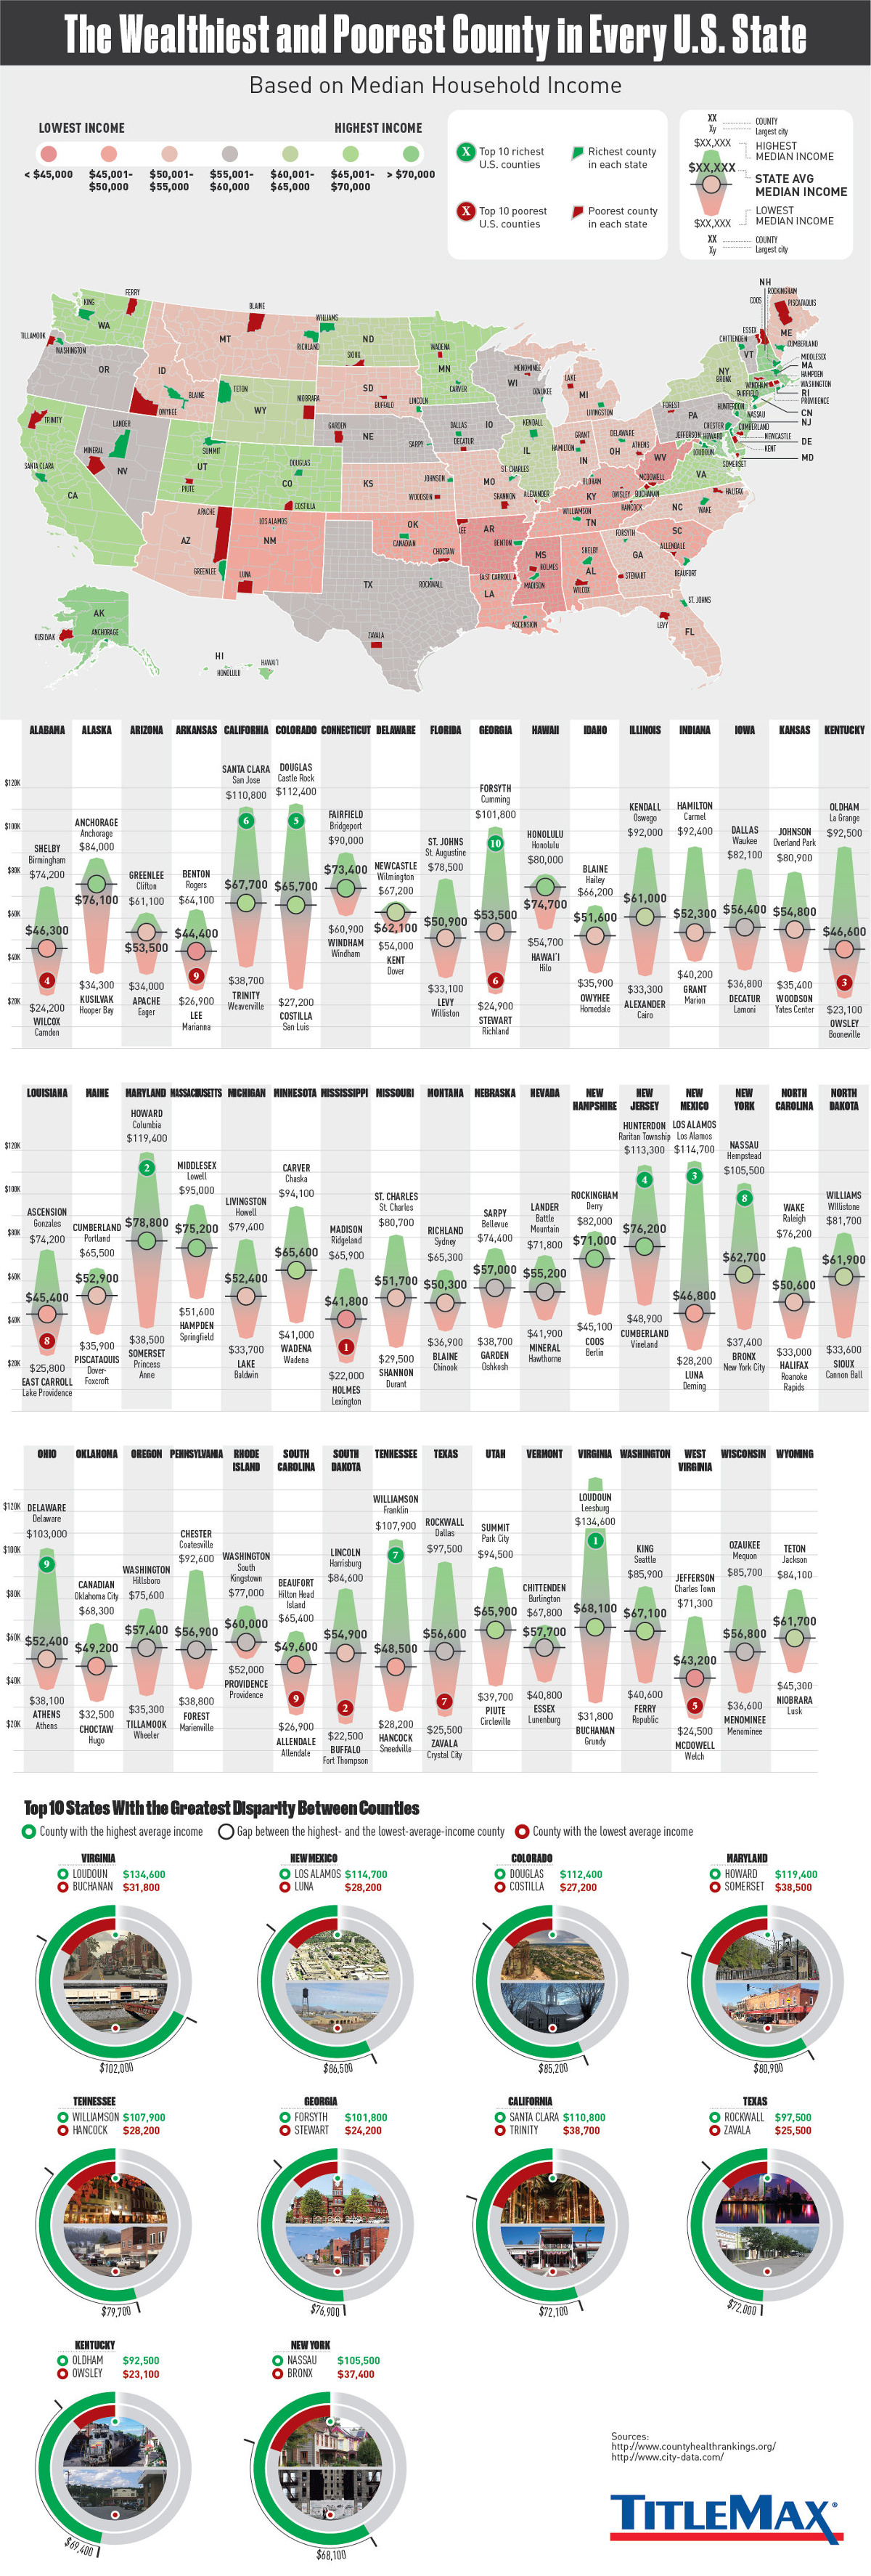
The Wealthiest and Poorest County in Every U.S. State
View the high resolution version of today’s graphic by clicking here.
The average U.S. state is made up of 62 counties.
With so many counties spread throughout each state in the nation, it’s not surprising that we can find counties that exemplify almost any part of the American experience.
In this case, we’re comparing county-level data to look at the differences in economic opportunity within each state. More specifically, we are looking at the range of median household income, which is one proxy for the difference in economic status between counties.
Disparity by State
Today’s infographic comes to us from TitleMax, and it looks at the wealthiest and poorest counties in each individual U.S. state based on the measure of median household income.
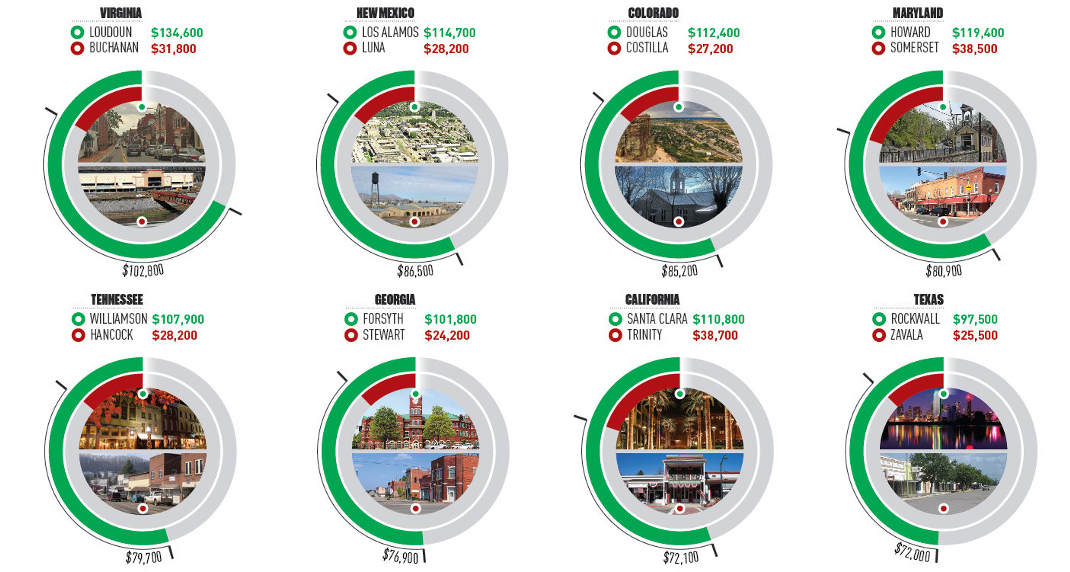
Here are the five states with the biggest disparity between rich and poor counties:
1. Virginia: $102,800
Loudoun is about an hour’s drive to D.C., and it also happens to be the richest county in the U.S. in terms of median income. Further west in the state, bordering Kentucky and West Virginia, lies Buchanan County, which has a median household income of just $31,800.
| County Name | Median Income | |
|---|---|---|
| Richest | Loudoun | $134,600 |
| Poorest | Buchanan | $31,800 |
| Differential | $102,800 |
2. New Mexico: $86,500
In Los Alamos, known as the birthplace of the atomic bomb, median household income has exploded to $114,700 – meanwhile, along the Mexico border lies Luna, the poorest county in the state.
| County Name | Median Income | |
|---|---|---|
| Richest | Los Alamos | $114,700 |
| Poorest | Luna | $28,200 |
| Differential | $86,500 |
3. Colorado: $85,200
Just like the Colorado has a difference in elevation, it also holds a large difference in median income. Folks in Douglas County, which lies between Denver and Colorado Springs, take home $112,400 in income on average, while folks in Costilla bring in about $27,200 per year.
| County Name | Median Income | |
|---|---|---|
| Richest | Douglas | $112,400 |
| Poorest | Costilla | $27,200 |
| Differential | $85,200 |
4. Maryland: $80,900
Howard County, which lies between Baltimore and Washington D.C., has the highest median household income in the state. Meanwhile, it’s Somerset County at the south of the Delmarva Peninsula that has the lowest.
| County Name | Median Income | |
|---|---|---|
| Richest | Howard | $119,400 |
| Poorest | Somerset | $38,500 |
| Differential | $80,900 |
5. Tennessee: $79,700
Just to the south of the Music City sits Williamson County – a wealthy part of the state with $107,900 in median income. Hancock County is the poorest, and it’s tucked away in the northeast corner of the state.
| County Name | Median Income | |
|---|---|---|
| Richest | Williamson | $107,900 |
| Poorest | Hancock | $28,200 |
| Differential | $79,700 |
A Note on Cost of Living
While median household income can help point to disparities between counties, it is just one indicator.
It’s worth noting that the cost of living can often be cheaper in counties with lower median incomes, and this can partially offset the difference in some instances. For example, while Trinity County is the poorest county in California by median income, it’s also far away from San Francisco, Los Angeles, or Sacramento, and has a much cheaper cost of living and a different way of life.
In some ways it is comparing apples to oranges. Trinity County is completely rural, holds zero incorporated cities, and holds just 3,600 people in its largest community (Weaverville) – a far cry from the urban sprawl of L.A. or the booming Bay Area.


Money
Charted: Who Has Savings in This Economy?
Older, better-educated adults are winning the savings game, reveals a January survey by the National Opinion Research Center at the University of Chicago.


Who Has Savings in This Economy?
This was originally posted on our Voronoi app. Download the app for free on iOS or Android and discover incredible data-driven charts from a variety of trusted sources.
Two full years of inflation have taken their toll on American households. In 2023, the country’s collective credit card debt crossed $1 trillion for the first time. So who is managing to save money in the current economic environment?
We visualize the percentage of respondents to the statement “I have money leftover at the end of the month” categorized by age and education qualifications. Data is sourced from a National Endowment for Financial Education (NEFE) report, published last month.
The survey for NEFE was conducted from January 12-14, 2024, by the National Opinion Research Center at the University of Chicago. It involved 1,222 adults aged 18+ and aimed to be representative of the U.S. population.
Older Americans Save More Than Their Younger Counterparts
General trends from this dataset indicate that as respondents get older, a higher percentage of them are able to save.
| Age | Always/Often | Sometimes | Rarely/Never |
|---|---|---|---|
| 18–29 | 29% | 33% | 38% |
| 30–44 | 36% | 27% | 37% |
| 45–59 | 39% | 23% | 38% |
| Above 60 | 49% | 28% | 23% |
| All Adults | 39% | 33% | 27% |
Note: Percentages are rounded and may not sum to 100.
Perhaps not surprisingly, those aged 60+ are the age group with the highest percentage saying they have leftover money at the end of the month. This age group spent the most time making peak earnings in their careers, are more likely to have investments, and are more likely to have paid off major expenses like a mortgage or raising a family.
The Impact of Higher Education on Earnings and Savings
Based on this survey, higher education dramatically improves one’s ability to save. Shown in the table below, those with a bachelor’s degree or higher are three times more likely to have leftover money than those without a high school diploma.
| Education | Always/Often | Sometimes | Rarely/Never |
|---|---|---|---|
| No HS Diploma | 18% | 26% | 56% |
| HS Diploma | 28% | 33% | 39% |
| Associate Degree | 33% | 31% | 36% |
| Bachelor/Higher Degree | 59% | 21% | 20% |
| All Adults | 39% | 33% | 27% |
Note: Percentages are rounded and may not sum to 100.
As the Bureau of Labor Statistics notes, earnings improve with every level of education completed.
For example, those with a high school diploma made 25% more than those without in 2022. And as the qualifications increase, the effects keep stacking.
Meanwhile, a Federal Reserve study also found that those with more education tended to make financial decisions that contributed to building wealth, of which the first step is to save.

-

 Markets1 week ago
U.S. Debt Interest Payments Reach $1 Trillion
-

 Markets2 weeks ago
Ranked: The Most Valuable Housing Markets in America
-

 Money2 weeks ago
Which States Have the Highest Minimum Wage in America?
-

 AI2 weeks ago
Ranked: Semiconductor Companies by Industry Revenue Share
-

 Markets2 weeks ago
Ranked: The World’s Top Flight Routes, by Revenue
-

 Demographics2 weeks ago
Population Projections: The World’s 6 Largest Countries in 2075
-

 Markets2 weeks ago
The Top 10 States by Real GDP Growth in 2023
-

 Money2 weeks ago
The Smallest Gender Wage Gaps in OECD Countries