Markets
Walmart Nation: Mapping America’s Biggest Employers
Walmart Nation: Mapping America’s Biggest Employers
In America, approximately 150 million people are currently employed, doing everything from neurosurgery to greeting customers at your local Walmart Supercenter.
While there is a breathtaking variety of jobs out there, a few large-scale organizations stand out as the top employer in each state.
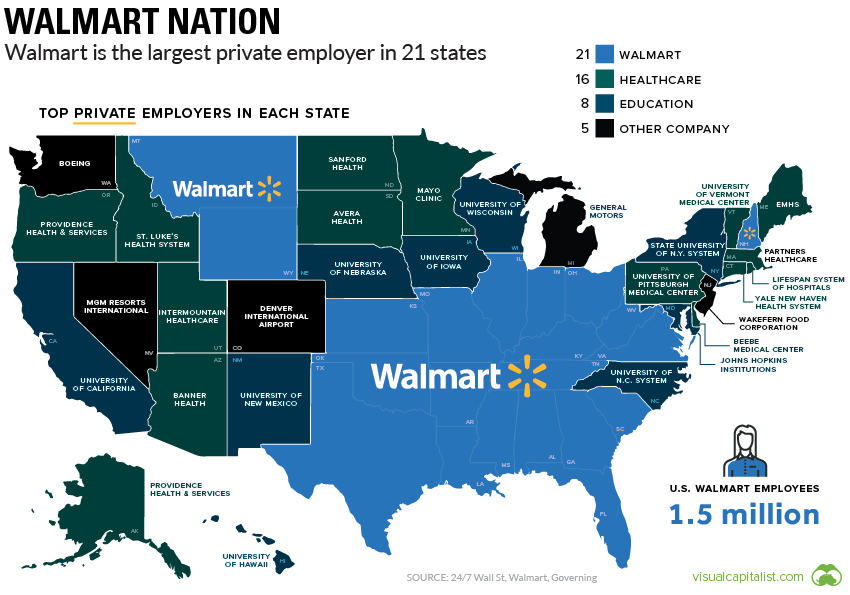
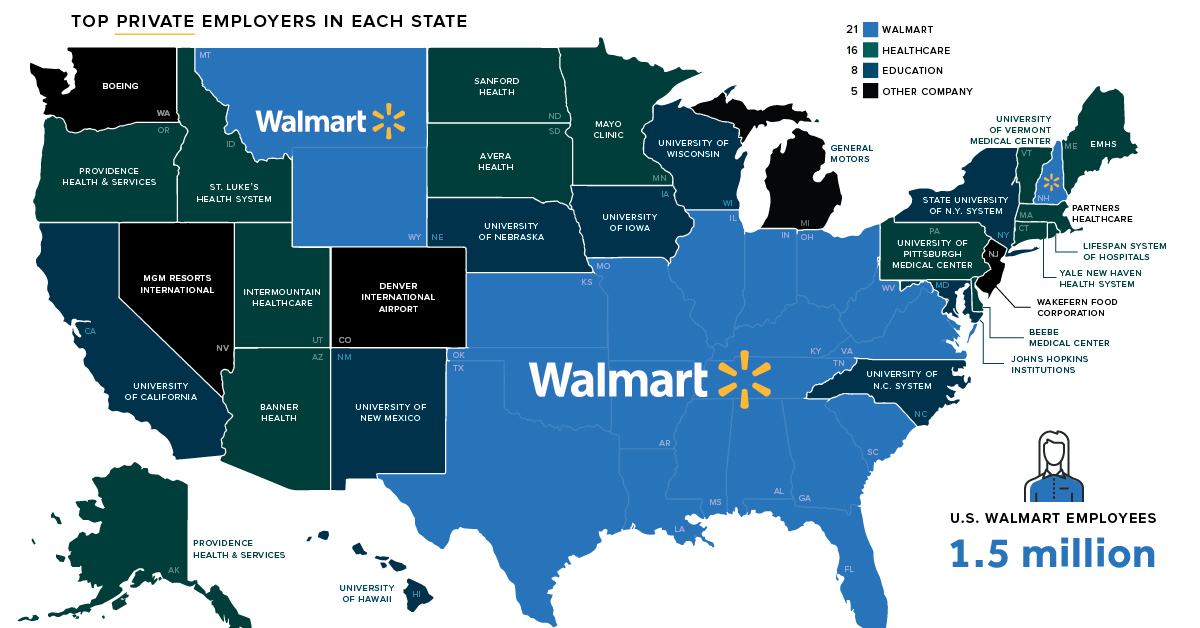
The Largest Employer in Each State
The U.S. is the third most populous country in the world, so it takes a lot of manpower to keep the government running. It’ll come as no surprise that, in most states, either the state or federal government is the top employer. California alone employs a quarter of a million federal workers.
New York State is a unique case as NYC’s municipal workforce is the top employer.
Technically, the largest employer on the planet is the U.S. Department of Defense, and in eight states, there are more active military personnel than any single private employer.
Non-Government Employers
When we exclude direct government and military employment, a few trends emerge. Universities and hospitals – there is often some overlap between the two – are top employers in nearly half of the states.
In a handful of cases, the top employer reflects an industry that is well known in the region. General Motors, for example, is still the top employer in Michigan. In Nevada? MGM Resorts International, with over 55,000 employees.
When it comes to large-scale employment, there’s one regional trend that stands out the most – the broad blue expanse of Walmart country.
View the high resolution version of today’s graphic by clicking here.
Walmart Nation
Walmart is the biggest company in the world by revenue, and there are over 3,500 Walmart Supercenters spread around the United States alone. It takes about 1% of private sector workforce in the United States to keep this massive fleet of big box stores running. In Arkansas, that figure jumps up to 4%, with about one-third of the total retail workforce employed at the retail giant.
Here’s a full look at the 21 states where Walmart is the top employer.
| State | # of Walmart Employees |
|---|---|
| Texas | 168,403 |
| Florida | 107,460 |
| Georgia | 60,002 |
| Illinois | 53,687 |
| Arkansas | 52,367 |
| Ohio | 50,186 |
| Virginia | 43,623 |
| Missouri | 42,029 |
| Tennessee | 40,598 |
| Indiana | 39,875 |
| Alabama | 37,207 |
| Louisiana | 36,309 |
| Oklahoma | 32,713 |
| South Carolina | 32,165 |
| Kentucky | 29,554 |
| Mississippi | 24,180 |
| Kansas | 20,103 |
| West Virginia | 11,864 |
| New Hampshire | 7,593 |
| Montana | 4,861 |
| Wyoming | 4,648 |
What About Amazon?
When we talk about the retail industry, it’s impossible to avoid discussing Amazon. The e-commerce company is growing at an impressive clip, and is now the second largest private employer in the country, with over half a million employees.
That said, even with the acquisition of Whole Foods, Amazon still has a long way to go to catch up to Walmart’s massive employee count. The company’s reliance on contract workers and supply chain automation means that this map is unlikely to turn orange in the near future.


Markets
U.S. Debt Interest Payments Reach $1 Trillion
U.S. debt interest payments have surged past the $1 trillion dollar mark, amid high interest rates and an ever-expanding debt burden.


U.S. Debt Interest Payments Reach $1 Trillion
This was originally posted on our Voronoi app. Download the app for free on iOS or Android and discover incredible data-driven charts from a variety of trusted sources.
The cost of paying for America’s national debt crossed the $1 trillion dollar mark in 2023, driven by high interest rates and a record $34 trillion mountain of debt.
Over the last decade, U.S. debt interest payments have more than doubled amid vast government spending during the pandemic crisis. As debt payments continue to soar, the Congressional Budget Office (CBO) reported that debt servicing costs surpassed defense spending for the first time ever this year.
This graphic shows the sharp rise in U.S. debt payments, based on data from the Federal Reserve.
A $1 Trillion Interest Bill, and Growing
Below, we show how U.S. debt interest payments have risen at a faster pace than at another time in modern history:
| Date | Interest Payments | U.S. National Debt |
|---|---|---|
| 2023 | $1.0T | $34.0T |
| 2022 | $830B | $31.4T |
| 2021 | $612B | $29.6T |
| 2020 | $518B | $27.7T |
| 2019 | $564B | $23.2T |
| 2018 | $571B | $22.0T |
| 2017 | $493B | $20.5T |
| 2016 | $460B | $20.0T |
| 2015 | $435B | $18.9T |
| 2014 | $442B | $18.1T |
| 2013 | $425B | $17.2T |
| 2012 | $417B | $16.4T |
| 2011 | $433B | $15.2T |
| 2010 | $400B | $14.0T |
| 2009 | $354B | $12.3T |
| 2008 | $380B | $10.7T |
| 2007 | $414B | $9.2T |
| 2006 | $387B | $8.7T |
| 2005 | $355B | $8.2T |
| 2004 | $318B | $7.6T |
| 2003 | $294B | $7.0T |
| 2002 | $298B | $6.4T |
| 2001 | $318B | $5.9T |
| 2000 | $353B | $5.7T |
| 1999 | $353B | $5.8T |
| 1998 | $360B | $5.6T |
| 1997 | $368B | $5.5T |
| 1996 | $362B | $5.3T |
| 1995 | $357B | $5.0T |
| 1994 | $334B | $4.8T |
| 1993 | $311B | $4.5T |
| 1992 | $306B | $4.2T |
| 1991 | $308B | $3.8T |
| 1990 | $298B | $3.4T |
| 1989 | $275B | $3.0T |
| 1988 | $254B | $2.7T |
| 1987 | $240B | $2.4T |
| 1986 | $225B | $2.2T |
| 1985 | $219B | $1.9T |
| 1984 | $205B | $1.7T |
| 1983 | $176B | $1.4T |
| 1982 | $157B | $1.2T |
| 1981 | $142B | $1.0T |
| 1980 | $113B | $930.2B |
| 1979 | $96B | $845.1B |
| 1978 | $84B | $789.2B |
| 1977 | $69B | $718.9B |
| 1976 | $61B | $653.5B |
| 1975 | $55B | $576.6B |
| 1974 | $50B | $492.7B |
| 1973 | $45B | $469.1B |
| 1972 | $39B | $448.5B |
| 1971 | $36B | $424.1B |
| 1970 | $35B | $389.2B |
| 1969 | $30B | $368.2B |
| 1968 | $25B | $358.0B |
| 1967 | $23B | $344.7B |
| 1966 | $21B | $329.3B |
Interest payments represent seasonally adjusted annual rate at the end of Q4.
At current rates, the U.S. national debt is growing by a remarkable $1 trillion about every 100 days, equal to roughly $3.6 trillion per year.
As the national debt has ballooned, debt payments even exceeded Medicaid outlays in 2023—one of the government’s largest expenditures. On average, the U.S. spent more than $2 billion per day on interest costs last year. Going further, the U.S. government is projected to spend a historic $12.4 trillion on interest payments over the next decade, averaging about $37,100 per American.
Exacerbating matters is that the U.S. is running a steep deficit, which stood at $1.1 trillion for the first six months of fiscal 2024. This has accelerated due to the 43% increase in debt servicing costs along with a $31 billion dollar increase in defense spending from a year earlier. Additionally, a $30 billion increase in funding for the Federal Deposit Insurance Corporation in light of the regional banking crisis last year was a major contributor to the deficit increase.
Overall, the CBO forecasts that roughly 75% of the federal deficit’s increase will be due to interest costs by 2034.

-

 Green1 week ago
Ranked: The Countries With the Most Air Pollution in 2023
-

 Automotive2 weeks ago
Almost Every EV Stock is Down After Q1 2024
-

 AI2 weeks ago
The Stock Performance of U.S. Chipmakers So Far in 2024
-

 Markets2 weeks ago
Charted: Big Four Market Share by S&P 500 Audits
-

 Real Estate2 weeks ago
Ranked: The Most Valuable Housing Markets in America
-

 Money2 weeks ago
Which States Have the Highest Minimum Wage in America?
-

 AI2 weeks ago
Ranked: Semiconductor Companies by Industry Revenue Share
-

 Travel2 weeks ago
Ranked: The World’s Top Flight Routes, by Revenue