Markets
Walmart’s Domination of the U.S. Grocery Market
Walmart’s Domination of the U.S. Grocery Market
One wouldn’t expect the grocery department of a big box retailer to spark debate, but Walmart’s high market concentration in the grocery space is doing just that.
By now, Walmart’s rise to the top of the retail pyramid is well documented. The Supercenters that dot the American landscape have had a dramatic ripple effect on surrounding communities, often resulting in decreased competition and reduced selection for consumers. Today, in some communities, Walmart takes in a whopping $19 for every $20 spent on groceries.
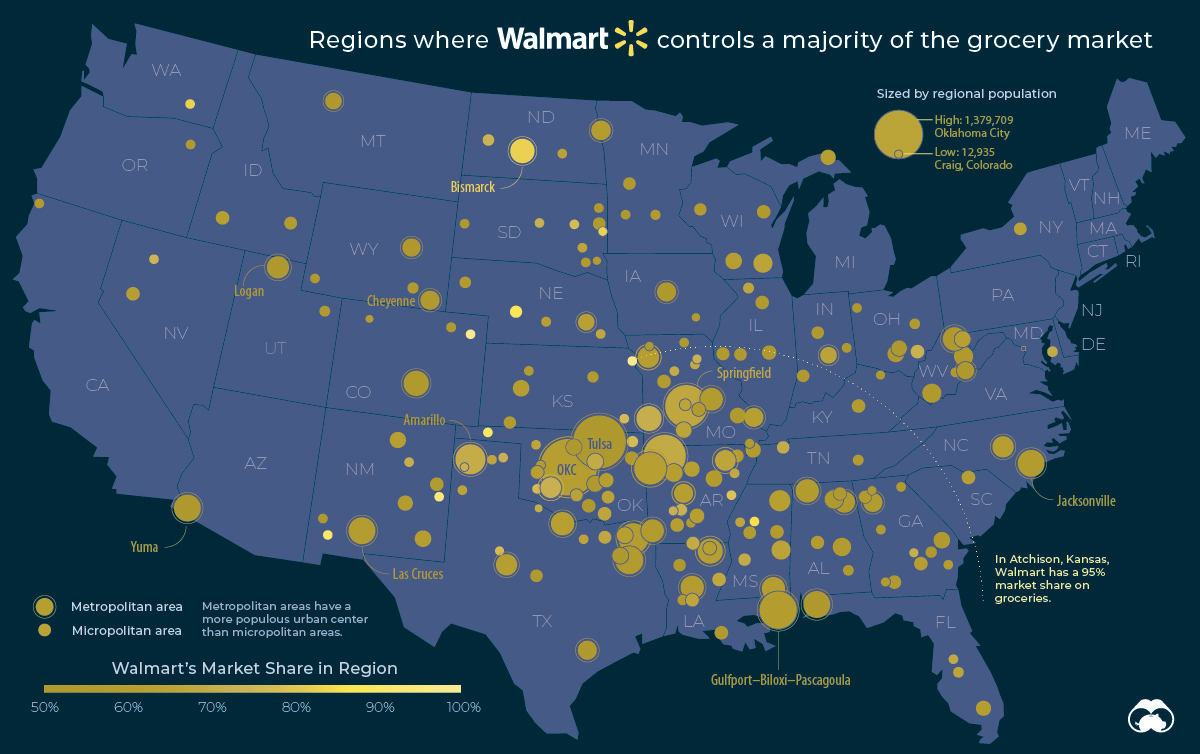
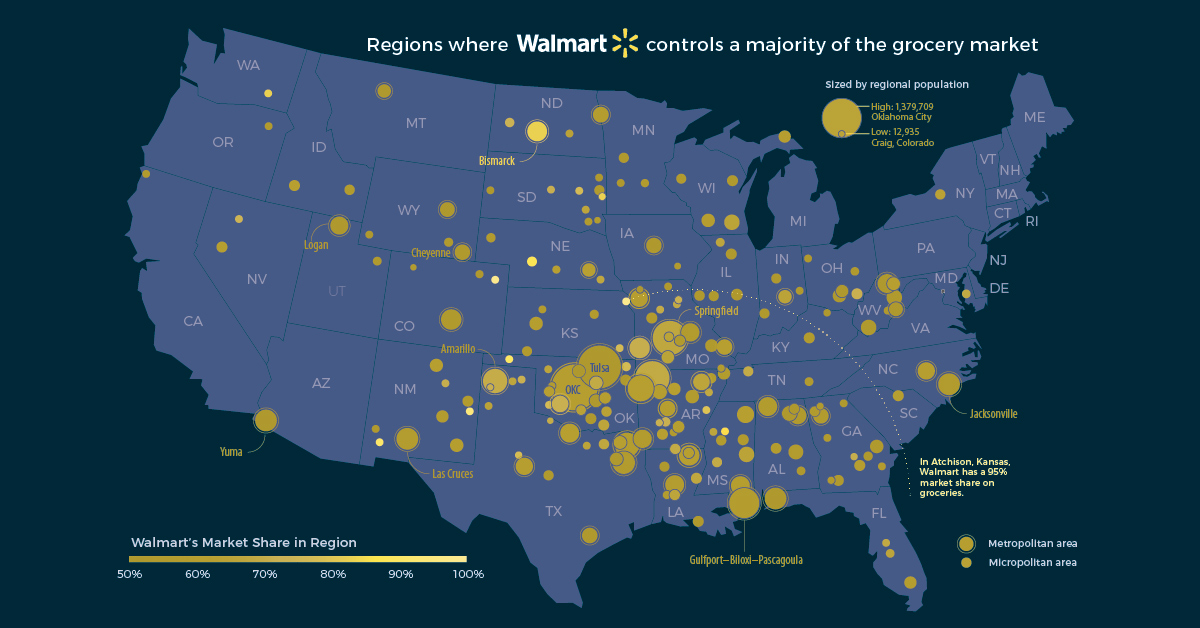
Today’s map, based on a report from the Institute for Local Self-Reliance, looks at which places in America are most reliant on Walmart to put food on the table.
The Weight of Walmart
Walmart has an unprecedented amount of control over the food system, now capturing a quarter of every single dollar spent on groceries in the United States.
Walmart isn’t just a major player — in some cases it’s become the only game in town. In a few of the communities listed in the report, Walmart commands a 90% market share and higher.
Here’s a breakdown of the top 20 towns dominated by Walmart in America:
| Rank | Metro/Region | Population | Walmart Market Share |
|---|---|---|---|
| #1 | Atchison, Kansas | 16,580 | 95% |
| #2 | Portales, New Mexico | 19,730 | 95% |
| #3 | Sterling, Colorado | 22,068 | 91% |
| #4 | Deming, New Mexico | 24,699 | 90% |
| #5 | Guymon, Oklahoma | 21,385 | 90% |
| #6 | North Platte, Nebraska | 37,043 | 87% |
| #7 | Wahpeton, N.D.– Minnesota | 23,036 | 84% |
| #8 | Coffeyville, Kansas | 33,434 | 83% |
| #9 | Othello, Washington | 19,806 | 83% |
| #10 | Bismarck, North Dakota | 135,654 | 83% |
| #11 | Helena-West Helena, Arkansas | 20,176 | 80% |
| #12 | Altus, Oklahoma | 25,931 | 77% |
| #13 | Parsons, Kansas | 20,761 | 77% |
| #14 | Miami, Oklahoma | 32,260 | 77% |
| #15 | Sweetwater, Texas | 15,101 | 77% |
| #16 | Grenada, Mississippi | 21,706 | 76% |
| #17 | Huron, South Dakota | 18,082 | 75% |
| #18 | Greensburg, Indiana | 26,711 | 74% |
| #19 | Clarksdale, Mississippi | 25,085 | 74% |
| #20 | Dumas, Texas | 22,485 | 74% |
While it’s more likely for a small town to become dominated by a single grocer, Walmart’s clout isn’t exclusive to rural America. Even in Springfield, Missouri — with a regional population of half a million people — the big box retailer still boasts a sizable market share of 66%.
Super Market Concentration
Under guidelines established by the Justice Department’s Antitrust Division, markets in which one corporation captures more than 50% of revenue are defined as “highly concentrated.” Walmart’s market share meets or exceeds this measure in 43 metropolitan areas and 160 smaller markets around the United States.
In some states, this trend is even more pronounced. In Oklahoma, for example, 86% of the state’s population lives in a region where Walmart has the majority market share in the grocery sector. In Arkansas — the home state of the megaretailer — half the population lives in this “highly concentrated” grocery market situation.
This degree of market concentration means that a retailer could cut certain products or manipulate prices without fear of losing customers. Worse yet, a company could close up shop and leave thousands of people without adequate grocery access.
An Interesting Caveat
There is a flip side to this story, however.
Walmart has shown a willingness to expand their grocery business to areas that were considered “food deserts” (i.e. low-income areas without easy access to a supermarket).
In a 2011 initiative, the retailer committed to open or expand 1,500 supermarkets across America to help give more people access to fresh food.
With the ground game clearly won, America’s largest grocer is now focused on dominating the next frontier of the grocery market – delivery. Stiff competition from companies like Amazon and Instacart will keep Walmart’s online market concentration in check for the time being.


Markets
U.S. Debt Interest Payments Reach $1 Trillion
U.S. debt interest payments have surged past the $1 trillion dollar mark, amid high interest rates and an ever-expanding debt burden.


U.S. Debt Interest Payments Reach $1 Trillion
This was originally posted on our Voronoi app. Download the app for free on iOS or Android and discover incredible data-driven charts from a variety of trusted sources.
The cost of paying for America’s national debt crossed the $1 trillion dollar mark in 2023, driven by high interest rates and a record $34 trillion mountain of debt.
Over the last decade, U.S. debt interest payments have more than doubled amid vast government spending during the pandemic crisis. As debt payments continue to soar, the Congressional Budget Office (CBO) reported that debt servicing costs surpassed defense spending for the first time ever this year.
This graphic shows the sharp rise in U.S. debt payments, based on data from the Federal Reserve.
A $1 Trillion Interest Bill, and Growing
Below, we show how U.S. debt interest payments have risen at a faster pace than at another time in modern history:
| Date | Interest Payments | U.S. National Debt |
|---|---|---|
| 2023 | $1.0T | $34.0T |
| 2022 | $830B | $31.4T |
| 2021 | $612B | $29.6T |
| 2020 | $518B | $27.7T |
| 2019 | $564B | $23.2T |
| 2018 | $571B | $22.0T |
| 2017 | $493B | $20.5T |
| 2016 | $460B | $20.0T |
| 2015 | $435B | $18.9T |
| 2014 | $442B | $18.1T |
| 2013 | $425B | $17.2T |
| 2012 | $417B | $16.4T |
| 2011 | $433B | $15.2T |
| 2010 | $400B | $14.0T |
| 2009 | $354B | $12.3T |
| 2008 | $380B | $10.7T |
| 2007 | $414B | $9.2T |
| 2006 | $387B | $8.7T |
| 2005 | $355B | $8.2T |
| 2004 | $318B | $7.6T |
| 2003 | $294B | $7.0T |
| 2002 | $298B | $6.4T |
| 2001 | $318B | $5.9T |
| 2000 | $353B | $5.7T |
| 1999 | $353B | $5.8T |
| 1998 | $360B | $5.6T |
| 1997 | $368B | $5.5T |
| 1996 | $362B | $5.3T |
| 1995 | $357B | $5.0T |
| 1994 | $334B | $4.8T |
| 1993 | $311B | $4.5T |
| 1992 | $306B | $4.2T |
| 1991 | $308B | $3.8T |
| 1990 | $298B | $3.4T |
| 1989 | $275B | $3.0T |
| 1988 | $254B | $2.7T |
| 1987 | $240B | $2.4T |
| 1986 | $225B | $2.2T |
| 1985 | $219B | $1.9T |
| 1984 | $205B | $1.7T |
| 1983 | $176B | $1.4T |
| 1982 | $157B | $1.2T |
| 1981 | $142B | $1.0T |
| 1980 | $113B | $930.2B |
| 1979 | $96B | $845.1B |
| 1978 | $84B | $789.2B |
| 1977 | $69B | $718.9B |
| 1976 | $61B | $653.5B |
| 1975 | $55B | $576.6B |
| 1974 | $50B | $492.7B |
| 1973 | $45B | $469.1B |
| 1972 | $39B | $448.5B |
| 1971 | $36B | $424.1B |
| 1970 | $35B | $389.2B |
| 1969 | $30B | $368.2B |
| 1968 | $25B | $358.0B |
| 1967 | $23B | $344.7B |
| 1966 | $21B | $329.3B |
Interest payments represent seasonally adjusted annual rate at the end of Q4.
At current rates, the U.S. national debt is growing by a remarkable $1 trillion about every 100 days, equal to roughly $3.6 trillion per year.
As the national debt has ballooned, debt payments even exceeded Medicaid outlays in 2023—one of the government’s largest expenditures. On average, the U.S. spent more than $2 billion per day on interest costs last year. Going further, the U.S. government is projected to spend a historic $12.4 trillion on interest payments over the next decade, averaging about $37,100 per American.
Exacerbating matters is that the U.S. is running a steep deficit, which stood at $1.1 trillion for the first six months of fiscal 2024. This has accelerated due to the 43% increase in debt servicing costs along with a $31 billion dollar increase in defense spending from a year earlier. Additionally, a $30 billion increase in funding for the Federal Deposit Insurance Corporation in light of the regional banking crisis last year was a major contributor to the deficit increase.
Overall, the CBO forecasts that roughly 75% of the federal deficit’s increase will be due to interest costs by 2034.

-

 Real Estate2 weeks ago
Visualizing America’s Shortage of Affordable Homes
-

 Technology1 week ago
Ranked: Semiconductor Companies by Industry Revenue Share
-

 Money1 week ago
Which States Have the Highest Minimum Wage in America?
-

 Real Estate1 week ago
Ranked: The Most Valuable Housing Markets in America
-

 Business2 weeks ago
Charted: Big Four Market Share by S&P 500 Audits
-

 AI2 weeks ago
The Stock Performance of U.S. Chipmakers So Far in 2024
-

 Misc2 weeks ago
Almost Every EV Stock is Down After Q1 2024
-

 Money2 weeks ago
Where Does One U.S. Tax Dollar Go?