Green
Visualizing What the World Thinks About Waste
View the full-size infographic by clicking here
Visualizing What the World Thinks About Waste
See the high resolution of this graphic by clicking here for best viewing.
Waste is a seemingly inseparable part of modern life.
In every industrialized society, humans consume many goods ranging from fresh food to automobiles. Inevitably, the majority of these goods are associated with waste that ends up clogging up our landfills, recycling systems, or even our oceans.
While garbage is widely universal, our perceptions on it vary from culture to culture – and when it comes to thinking about the future of our planet, these differences are important to think about.
Waste by Country
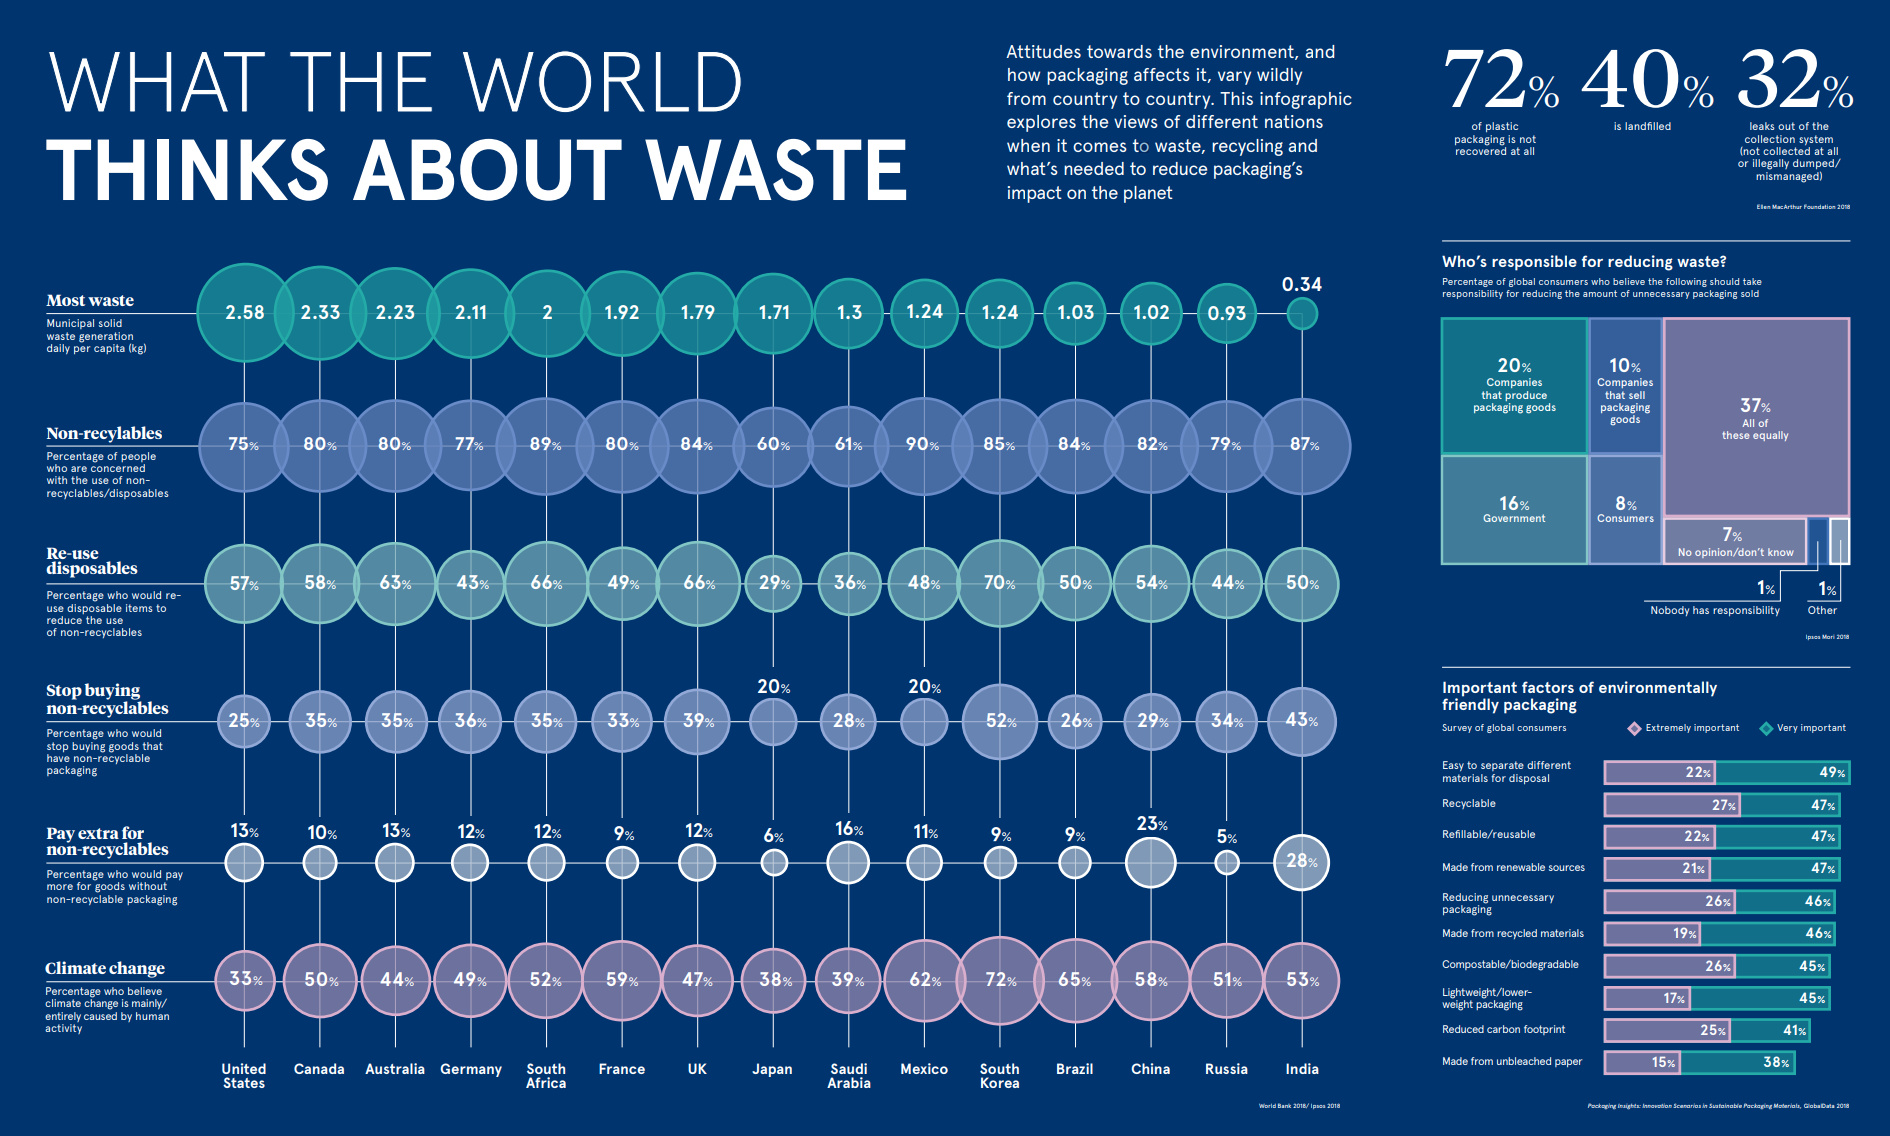
Today’s infographic comes to us from Raconteur, and it shows global attitudes towards waste, recycling, and the environment.
Using data from select countries, here is the amount of solid waste created per capita on a daily basis:
| Country | Daily Solid Waste (per capita) |
|---|---|
| United States | 2.58 kg |
| Canada | 2.33 kg |
| Australia | 2.23 kg |
| Germany | 2.11 kg |
| United Kingdom | 1.79 kg |
| Japan | 1.71 kg |
| Mexico | 1.24 kg |
| China | 1.02 kg |
| India | 0.34 kg |
The U.S. leads the way in waste, but Western countries like Canada, Germany, and Australia are not far behind.
In India and China, waste numbers are low per capita right now, but they will continue to creep closer to Western figures as their economies further urbanize and increase consumption.
Global Attitudes Towards Waste
About 72% of plastic packaging does not get recovered at all, with 40% of all waste going to the landfill and 32% leaking out of the collection system (not collected, illegally dumped, or mismanaged).
With this in mind, who is responsible for reducing plastic packaging?
- 20% of global respondents say that the companies producing packaged goods should be responsible
- 16% say the government should be responsible
- 10% say the companies selling packaged goods should be responsible
- 8% say consumers
- 37% say all the above are equally responsible
- 9% say other, including having no opinion or being undecided
Interestingly, looking at individual countries reveals different perceptions than broader, global norms.
Attitudes Differ by Country
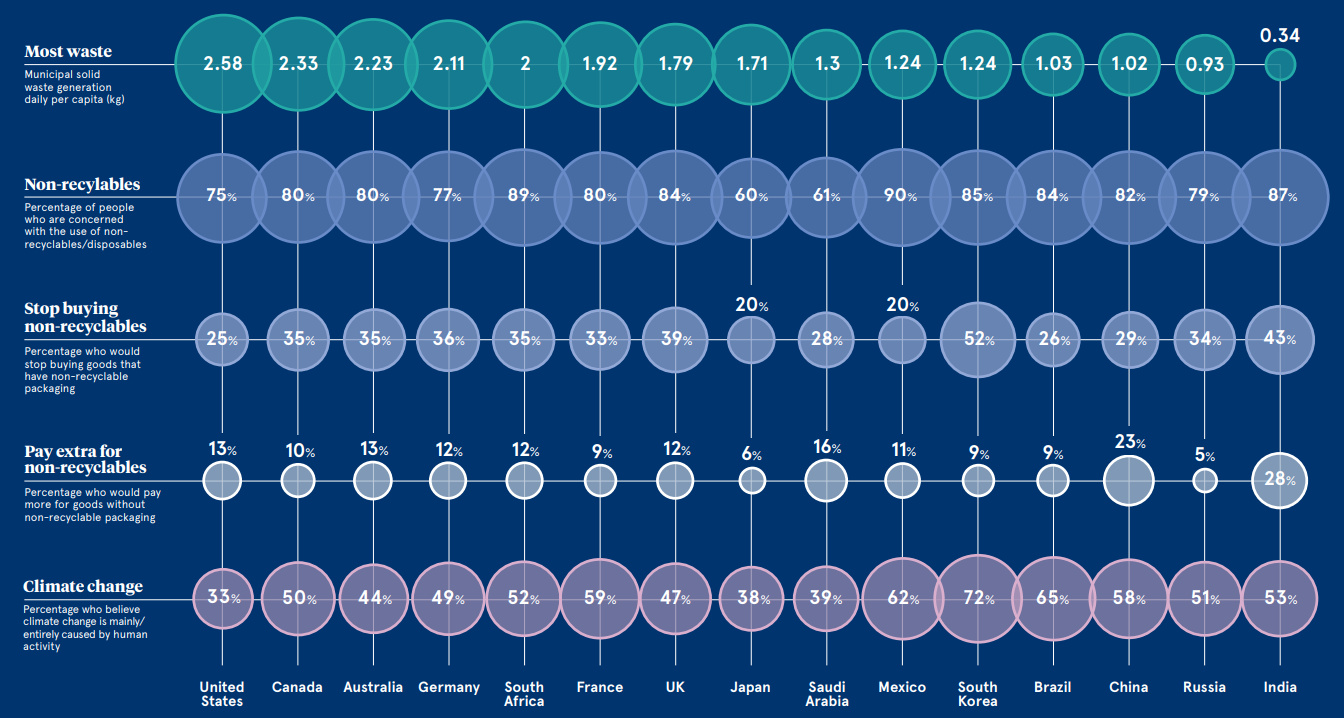
The infographic highlights the specific differences in attitudes towards waste between a multitude of countries.
While one expects big differences between countries like China and Germany, it can be shown that opinions on waste vary even between geographically proximate countries with similar levels of economic development. In South Korea and Japan, for example, waste attitudes differ considerably.
Per person, Japan produces 1.71 kg of solid waste per day, about 38% more than South Korea (1.24 kg).
South Koreans are more worried about the use of non-recyclable packaging, with 85% of people expressing concern about the issue. Roughly 60% of Japanese people felt the same.
To address this issue, 52% of Koreans said that they are willing to stop buying goods that have non-recyclable packaging – and only 20% in Japan concurred.
Even views of something broader like climate change differ between the two countries. In Japan, 38% of the population sees climate change as being caused by human activity, while 72% of Koreans see climate change the same way.


Green
How Carbon Credits Can Help Close the Climate Funding Gap
To keep a 1.5℃ world within reach, global emissions need to fall by as much as 45% by 2030, and carbon credits could help close the gap.


How Carbon Credits Can Help Close the Climate Funding Gap
Governments around the world have committed to the goals of the Paris Agreement, but their climate pledges are insufficient. To keep a 1.5℃ world within reach, global emissions need to fall by as much as 45% by 2030.
Bold and immediate action is essential, but so are resources that will make it happen.
In this graphic, we have partnered with Carbon Streaming to look at the role that the voluntary carbon market and carbon credits can play in closing that gap.
More Funds are Needed for Climate Finance
According to data from the Climate Policy Initiative, climate finance, which includes funds for both adaptation and mitigation, needs to increase at least five-fold, from $1.3T in 2021/2022, to an average $8.6T annually until 2030, and then to just over $10T in the two decades leading up to 2050.
That adds up to a very large number, but consider that in 2022, $7.0T went to fossil fuel subsidies, which almost covers the annual estimated outlay. And the world has shown that when pressed, governments can come up with the money, if the global pandemic is any indication.
Mobilizing Carbon Finance to the Developing World
But the same cannot be said of the developing world, where debt, inequality, and poverty reduce the ability of governments to act. And this is where carbon credits can play an important role. According to analyses from Ecosystem Marketplace, carbon credits help move capital from developed countries, to where funds are needed in the developing world.
For example, in 2019, 69.2% of the carbon credits by volume in the voluntary carbon market were purchased by buyers in Europe, and nearly a third from North America. Compare that to over 90% of the volume of carbon credits sold in the voluntary carbon market in 2022 came from projects that were located outside of those two regions.
Carbon Credits Can Complement Decarbonization Efforts
Carbon credits can also complement decarbonization efforts in the corporate world, where more and more companies have been signing up to reduce emissions. According to the 2022 monitoring report from the Science Based Targets initiative, 4,230 companies around the world had approved targets and commitments, which represented an 88% increase from the prior year. However, as of year end 2022, combined scope 1 and 2 emissions covered by science-based targets totaled approximately 2 GtCO2e, which represents just a fraction of global emissions.
The fine print is that this is just scope 1 and 2 emissions, and doesn’t include scope 3 emissions, which can account for more than 70% of a company’s total emissions. And as these emissions come under greater and greater scrutiny the closer we get to 2030 and beyond, the voluntary carbon credit market could expand exponentially to help meet the need to compensate for these emissions.
Potential Carbon Credit Market Size in 2030
OK, but how big? In 2022, the voluntary carbon credit market was around $2B, but some analysts predict that it could grow to between $5–250 billion by 2030.
| Firm | Low Estimate | High Estimate |
|---|---|---|
| Bain & Company | $15B | $30B |
| Barclays | N/A | $250B |
| Citigroup | $5B | $50B |
| McKinsey & Company | $5B | $50B |
| Morgan Stanley | N/A | $100B |
| Shell / Boston Consulting Group | $10B | $40B |
Morgan Stanley and Barclays were the most bullish on the size of the voluntary carbon credit market in 2030, but the latter firm was even more optimistic about 2050, and predicted that the voluntary carbon credit market could grow to a colossal $1.5 trillion.
Carbon Streaming is Focused on Carbon Credit Integrity
Ultimately, carbon credits could have an important role to play in marshaling the resources needed to keep the world on track to net zero by 2050, and avoiding the worst consequences of a warming world.
Carbon Streaming uses streaming transactions, a proven and flexible funding model, to scale high-integrity carbon credit projects to advance global climate action and UN Sustainable Development Goals.
Learn more at www.carbonstreaming.com.

-

 Green1 week ago
Ranking the Top 15 Countries by Carbon Tax Revenue
This graphic highlights France and Canada as the global leaders when it comes to generating carbon tax revenue.
-

 Green2 weeks ago
Ranked: The Countries With the Most Air Pollution in 2023
South Asian nations are the global hotspot for pollution. In this graphic, we rank the world’s most polluted countries according to IQAir.
-

 Environment2 weeks ago
Top Countries By Forest Growth Since 2001
One country is taking reforestation very seriously, registering more than 400,000 square km of forest growth in two decades.
-

 Green3 weeks ago
Ranked: Top Countries by Total Forest Loss Since 2001
The country with the most forest loss since 2001 lost as much forest cover as the next four countries combined.
-

 Markets2 months ago
The World’s Top Cocoa Producing Countries
Here are the largest cocoa producing countries globally—from Côte d’Ivoire to Brazil—as cocoa prices hit record highs.
-

 Environment2 months ago
Charted: Share of World Forests by Country
We visualize which countries have the biggest share of world forests by area—and while country size plays a factor, so too, does the environment.


-

 Energy1 week ago
The World’s Biggest Nuclear Energy Producers
-

 Money2 weeks ago
Which States Have the Highest Minimum Wage in America?
-

 Technology2 weeks ago
Ranked: Semiconductor Companies by Industry Revenue Share
-

 Markets2 weeks ago
Ranked: The World’s Top Flight Routes, by Revenue
-

 Countries2 weeks ago
Population Projections: The World’s 6 Largest Countries in 2075
-

 Markets2 weeks ago
The Top 10 States by Real GDP Growth in 2023
-

 Demographics2 weeks ago
The Smallest Gender Wage Gaps in OECD Countries
-

 United States2 weeks ago
Where U.S. Inflation Hit the Hardest in March 2024