Technology
Visualizing Social Media Use by Generation
Visualizing Social Media Use by Generation
Our world has never been more connected than it is today.
Nearly two-thirds of the world’s population is plugged into the matrix, with over 4.4 billion internet users across multiple device types. We use these devices for work and for play—and social media has altered the way we interact both online and offline.
Today’s infographic from Global Web Index compares key generational and regional differences of social media use based on data from nearly 114,000 internet users, highlighting how pervasive social media has become in our lives.
Note: China is excluded from the usage data regarding specific social networks and apps.
From Age to Age: Social Media by Generation
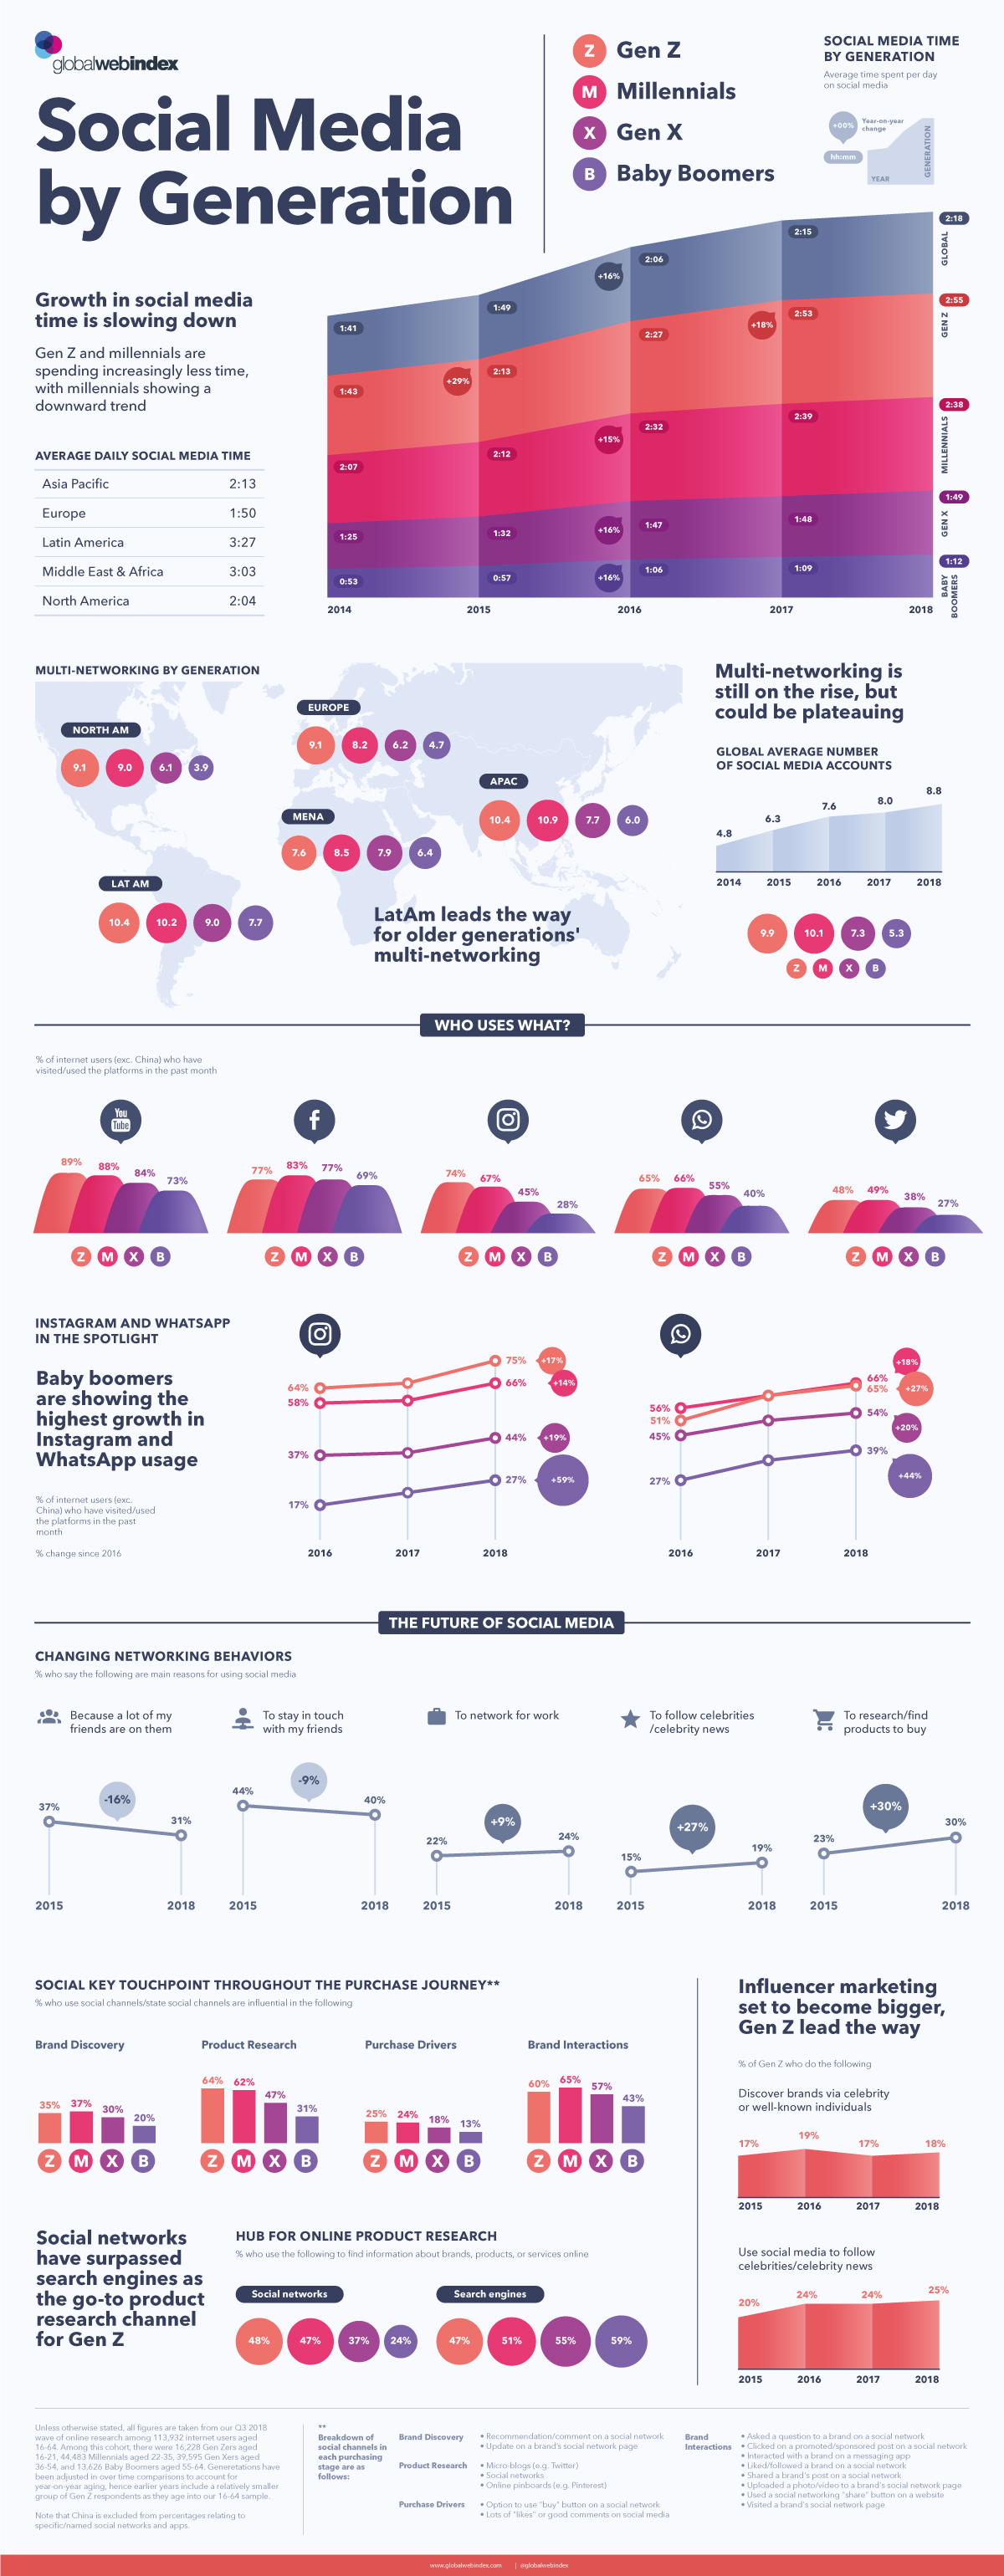
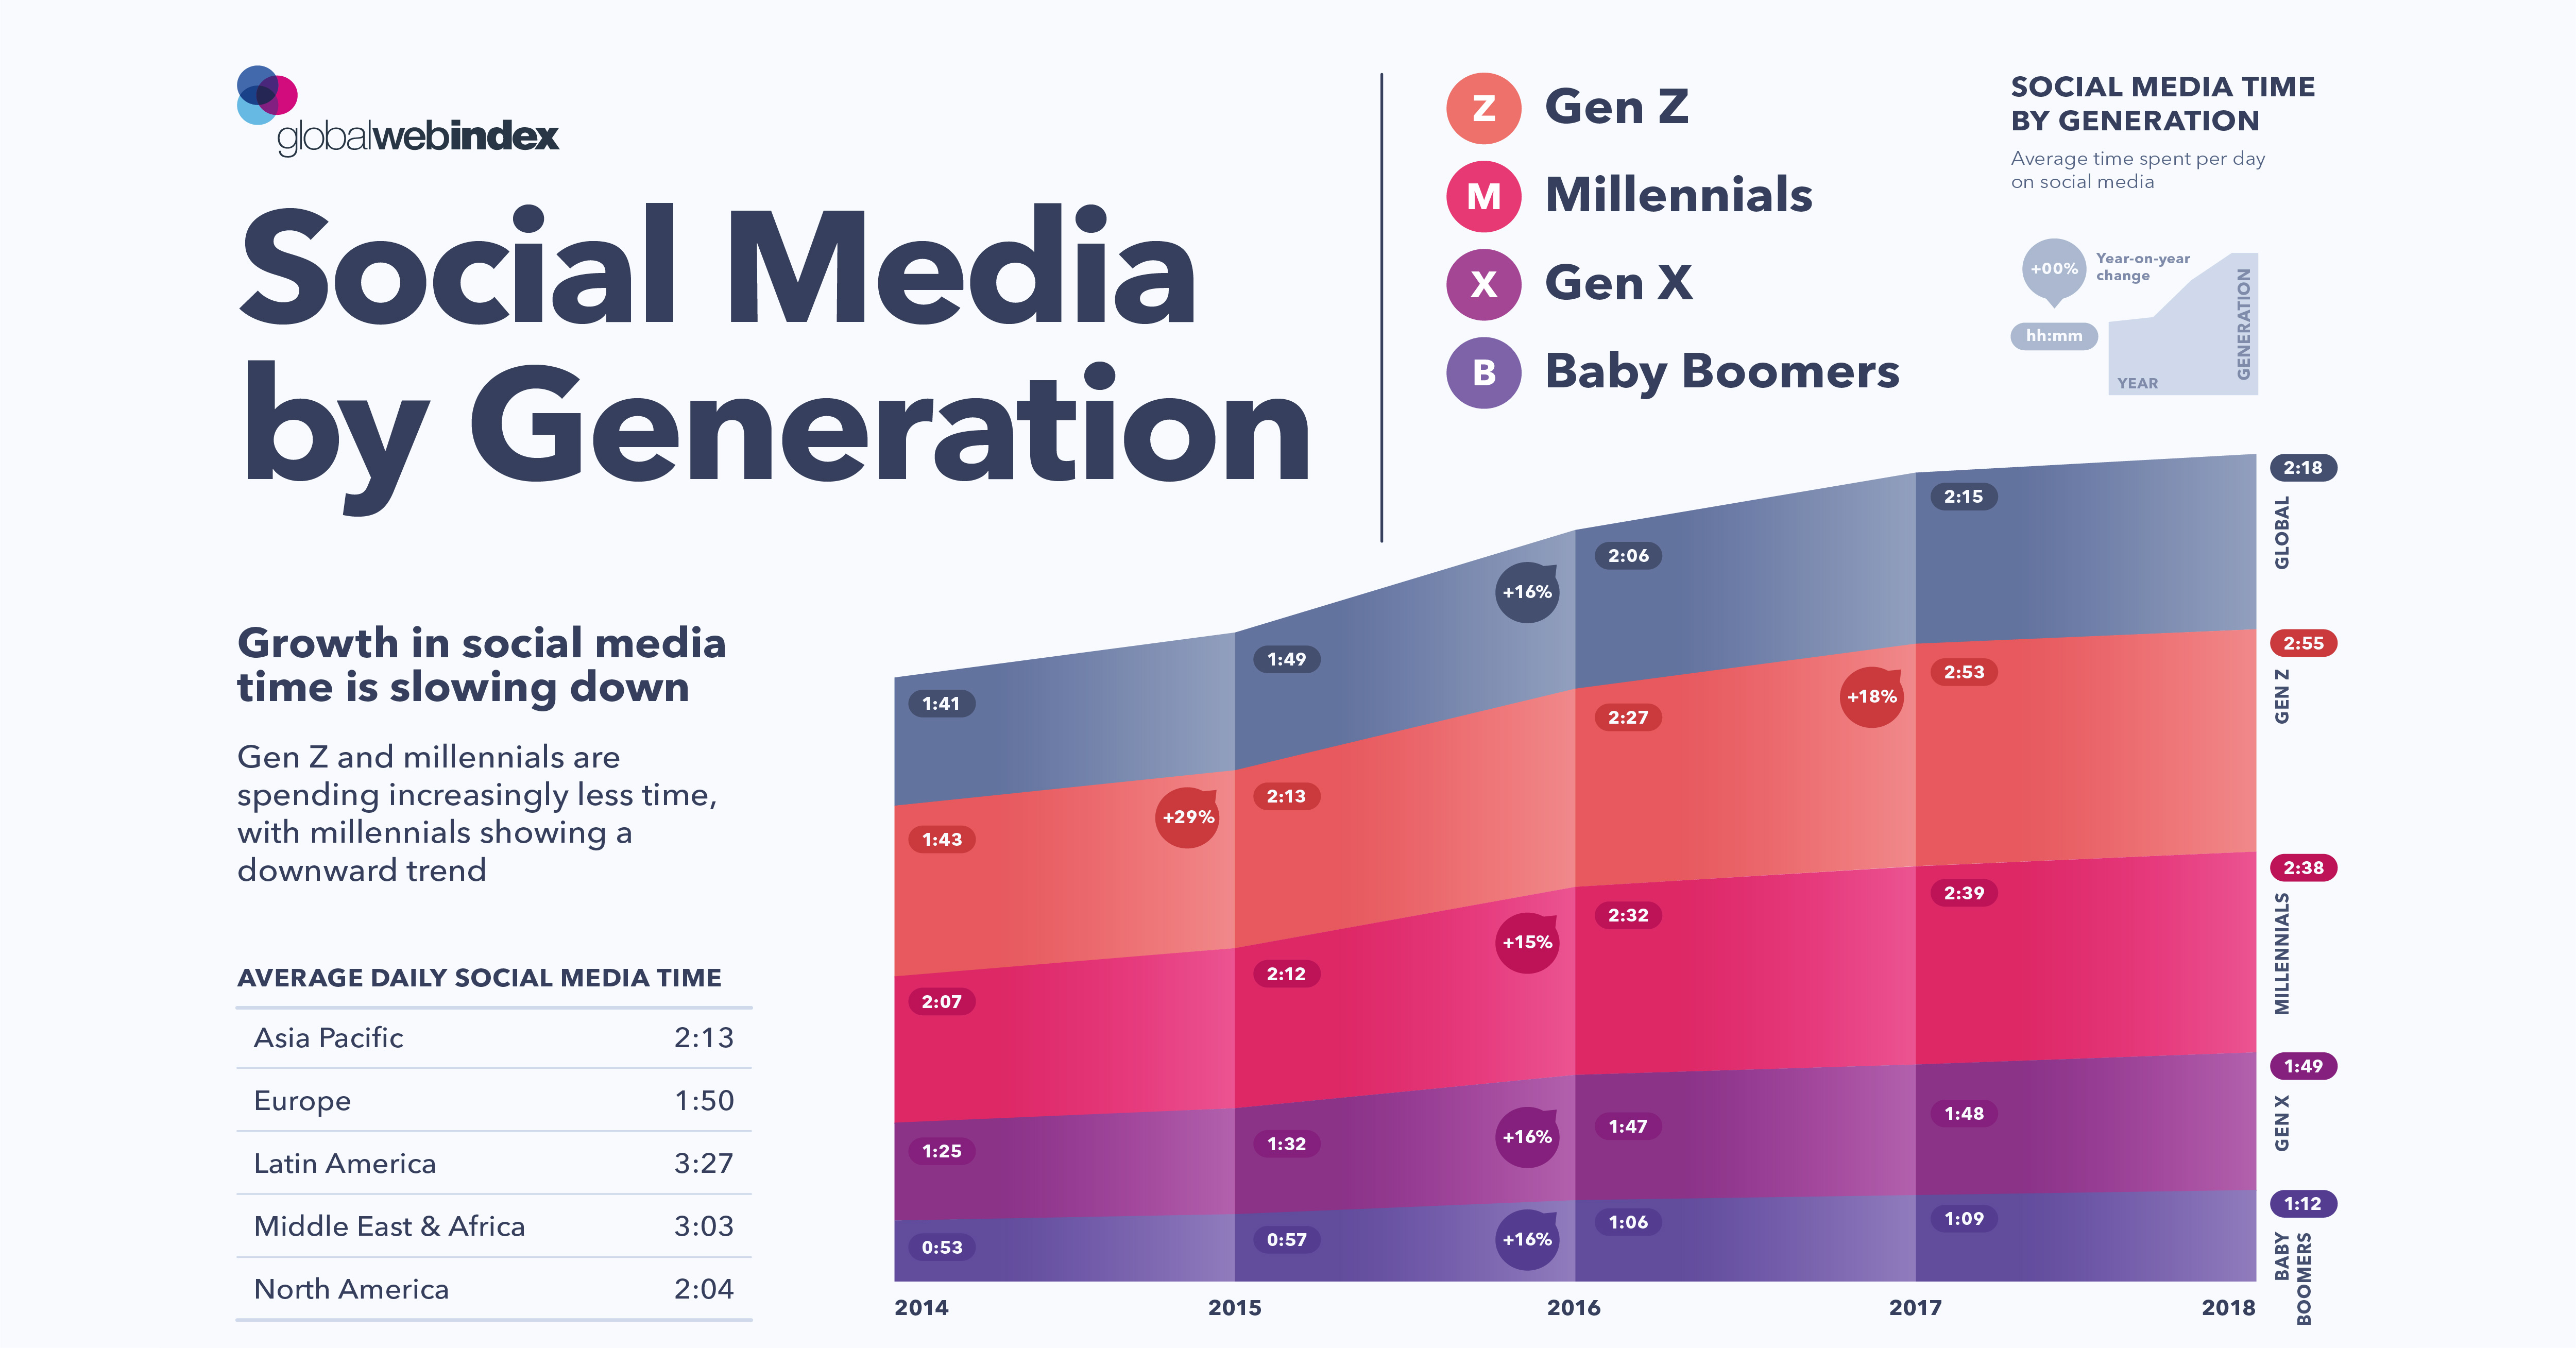
How does the use of social media vary by generation?
Baby Boomers
Boomers currently rank last in nearly every category and metric when it comes to technology and social media use. This generation didn’t grow up inundated with technology in the way today’s youth are.
However, Boomers are showing the greatest increase in activity on social media platforms. For example, usage of Instagram and WhatsApp is up 59% and 44% respectively for this group since 2016, which is more than double the global average.
Generation X
Also known as the ‘MTV Generation’, the Gen X group was the last generation to grow up before the Internet truly took off. The early years of this group were marked by a burst of new technologies, from wireless phones to personal computers.
On average, Gen Xers spend nearly two hours on social media per day—less than Millennials and Gen Z, but more than Boomers.
Millennials
Perhaps surprisingly, Millennials show a slow down in the time spent on social media. From 2017-2018, screen time for Millennials on social media decreased by one minute, to 2 hours 38 minutes per day. This trend points to Millennials seeking real-life experiences and better engagement from the brands they interact with online, rather than passive scrolling.
Other factors also play a role in this evolution─nearly 50% of Millennials admit that their activity on social media has caused them to overspend to impress their networks.
Generation Z
Gen Z is the first group in history that has never known a world without the Internet. Immersed in the online world since birth, Gen Z surpasses Millennials in daily activity on social media with 2 hours 55 minutes spent per day.
North American, Latin American, and European Generation Z-ers lead in the number of social accounts they’re actively using. Many are also moving away from platforms like Facebook in favor of multimedia-heavy sites such as YouTube and Instagram.
Social Media by the Numbers
Social media sites measure the number of unique users on the platform each month as a metric of success. Below is a snapshot of the five major social media sites shown in today’s graphic and their active user count.
Monthly Active Users (MAU) as of July 2019
- Facebook: 2.4 billion
- YouTube: 2 billion
- WhatsApp: 1.6 billion
- Instagram: 1 billion
- Twitter: 330 million
Even more striking is what happens in a social media minute:
- 41.6 million messages sent over Facebook Messenger and WhatsApp
- 347,222 people are scrolling Instagram
- 87,500 people posting to Twitter
- 4.5 million videos on YouTube being watched
Social Media’s Role in Retail
Social media has evolved from simply keeping us connected to our friends. Users can now access career tools, engage with their favorite companies, stay current with global events, and find love.
Across all regions and generations, social media has propelled e-commerce into the limelight. More than ever before, social media sites are being used for product research, brand engagement, and online purchases. For example, Instagram now offers one-click shop features that allow users to buy what they see immediately, with a simple tap on their screens.
The greatest growth in e-commerce, however, has been the influencer industry. These star-studded internet personalities boast massive online followings from a wide range of demographics—and companies are taking notice.
In 2018, 72% of major brands stated that they were outsourcing a significant portion of their marketing resources to online influencers. Followers feel as though they’re getting a product recommendation from a friend, making them more likely to buy quickly.
Social Media Growth
Despite the rate of social media growth slowing down, social media use is still growing. From 2017 to 2018, the average person increased usage by three minutes per day, while becoming a new user of 0.8 social media accounts.
Social media is a broad, multi-faceted, and complex industry that appeals to a wide range of cultures, age groups, and personalities. While growth in social media activity may be slowing down, a growing global population may mean we’ll see more opportunities to stay connected.


Brands
How Tech Logos Have Evolved Over Time
From complete overhauls to more subtle tweaks, these tech logos have had quite a journey. Featuring: Google, Apple, and more.


How Tech Logos Have Evolved Over Time
This was originally posted on our Voronoi app. Download the app for free on iOS or Android and discover incredible data-driven charts from a variety of trusted sources.
One would be hard-pressed to find a company that has never changed its logo. Granted, some brands—like Rolex, IBM, and Coca-Cola—tend to just have more minimalistic updates. But other companies undergo an entire identity change, thus necessitating a full overhaul.
In this graphic, we visualized the evolution of prominent tech companies’ logos over time. All of these brands ranked highly in a Q1 2024 YouGov study of America’s most famous tech brands. The logo changes are sourced from 1000logos.net.
How Many Times Has Google Changed Its Logo?
Google and Facebook share a 98% fame rating according to YouGov. But while Facebook’s rise was captured in The Social Network (2010), Google’s history tends to be a little less lionized in popular culture.
For example, Google was initially called “Backrub” because it analyzed “back links” to understand how important a website was. Since its founding, Google has undergone eight logo changes, finally settling on its current one in 2015.
| Company | Number of Logo Changes |
|---|---|
| 8 | |
| HP | 8 |
| Amazon | 6 |
| Microsoft | 6 |
| Samsung | 6 |
| Apple | 5* |
Note: *Includes color changes. Source: 1000Logos.net
Another fun origin story is Microsoft, which started off as Traf-O-Data, a traffic counter reading company that generated reports for traffic engineers. By 1975, the company was renamed. But it wasn’t until 2012 that Microsoft put the iconic Windows logo—still the most popular desktop operating system—alongside its name.
And then there’s Samsung, which started as a grocery trading store in 1938. Its pivot to electronics started in the 1970s with black and white television sets. For 55 years, the company kept some form of stars from its first logo, until 1993, when the iconic encircled blue Samsung logo debuted.
Finally, Apple’s first logo in 1976 featured Isaac Newton reading under a tree—moments before an apple fell on his head. Two years later, the iconic bitten apple logo would be designed at Steve Jobs’ behest, and it would take another two decades for it to go monochrome.

-

 Travel1 week ago
Airline Incidents: How Do Boeing and Airbus Compare?
-

 Markets2 weeks ago
Visualizing America’s Shortage of Affordable Homes
-

 Green2 weeks ago
Ranked: Top Countries by Total Forest Loss Since 2001
-

 Money2 weeks ago
Where Does One U.S. Tax Dollar Go?
-

 Misc2 weeks ago
Almost Every EV Stock is Down After Q1 2024
-

 AI2 weeks ago
The Stock Performance of U.S. Chipmakers So Far in 2024
-

 Markets2 weeks ago
Charted: Big Four Market Share by S&P 500 Audits
-

 Real Estate2 weeks ago
Ranked: The Most Valuable Housing Markets in America