Science
Zooming In: Visualizing the Relative Size of Particles
View the full-size version of this infographic.


Zooming In: Visualizing the Relative Size of Particles
View the full-size version of this infographic.
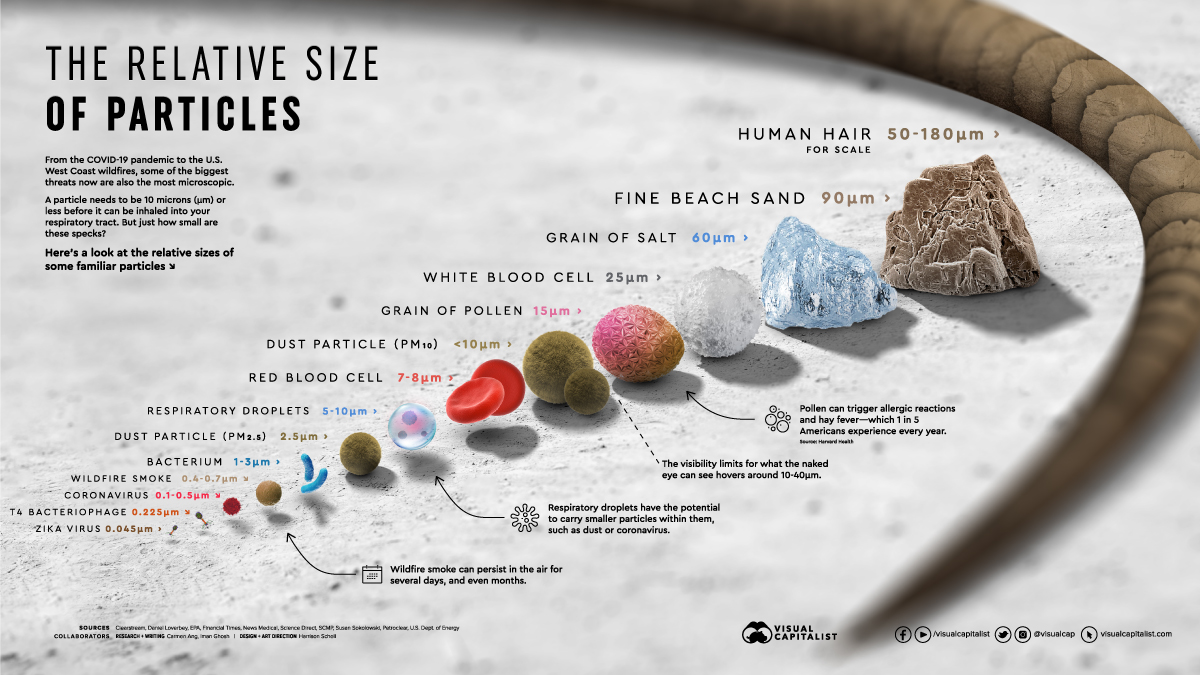
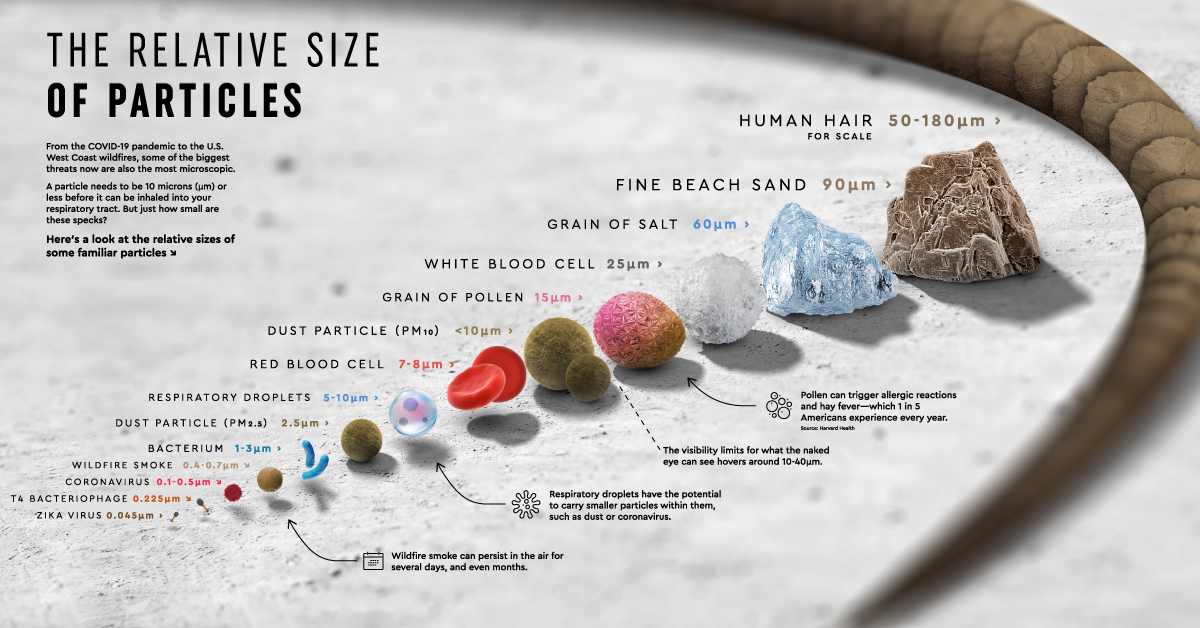
Lately, the world’s biggest threats have been microscopic in size.
From the global COVID-19 pandemic to wildfires ripping through the U.S. West Coast, it seems as though our lungs can’t catch a break, or more aptly, a breath.
But just how small are the particles we’re currently battling? And how does their size compare to other tiny molecules?
Specks Too Small to See
While the coronavirus that causes COVID-19 is relatively small in size, it isn’t the smallest virus particle out there.
Both the Zika virus and the T4 Bacteriophage—responsible for E. coli—are just a fraction of the size, although they have not nearly claimed as many lives as COVID-19 to date.
Coronavirus particles are smaller than both red or white blood cells, however, a single blood cell is still virtually invisible to the naked eye. For scale, we’ve also added in a single human hair as a benchmark on the upper end of the size range.
| Particles | Average Size (microns, μm) |
|---|---|
| Zika virus | 45nm |
| T4 Bacteriophage | 225nm |
| Coronavirus COVID-19 (SARS-CoV-2) | 0.1-0.5μm |
| Bacterium | 1-3μm |
| Light dust particle | 1μm |
| Dust particle: PM2.5 | ≤2.5μm |
| Respiratory droplets containing COVID-19 | 5-10μm |
| Red blood cell | 7-8μm |
| Dust particle: PM10 | ≤10μm |
| Pollen grain | 15μm |
| White blood cell | 25μm |
| Visibility threshold (Limit of what the naked eye can see) | 10-40μm |
| Grain of salt | 60μm |
| Fine beach sand | 90μm |
| Human hair | 50-180μm |
On the other end of the spectrum, pollen, salt, and sand are significantly larger than viruses or bacteria. Because of their higher relative sizes, our body is usually able to block them out—a particle needs to be smaller than 10 microns before it can be inhaled into your respiratory tract.
Because of this, pollen or sand typically get trapped in the nose and throat before they enter our lungs. The smaller particles particles, however, are able to slip through more easily.
Smoky Skies: Air Pollution and Wildfires
While the virus causing COVID-19 is certainly the most topical particle right now, it’s not the only speck that poses a health risk. Air pollution is one of the leading causes of death worldwide—it’s actually deadlier than smoking, malaria, or AIDS.
One major source of air pollution is particulate matter, which can contain dust, dirt, soot, and smoke particles. Averaging around 2.5 microns, these particles can often enter human lungs.
At just a fraction of the size between 0.4-0.7 microns, wildfire smoke poses even more of a health hazard. Research has also linked wildfire exposures to not just respiratory issues, but also cardiovascular and neurological issues.
Here’s an animated map by Flowing Data, showing how things heated up in peak wildfire season between August-September 2020:
What’s the main takeaway from all this?
There are many different kinds of specks that are smaller than the eye can see, and it’s worth knowing how they can impact human health.


Science
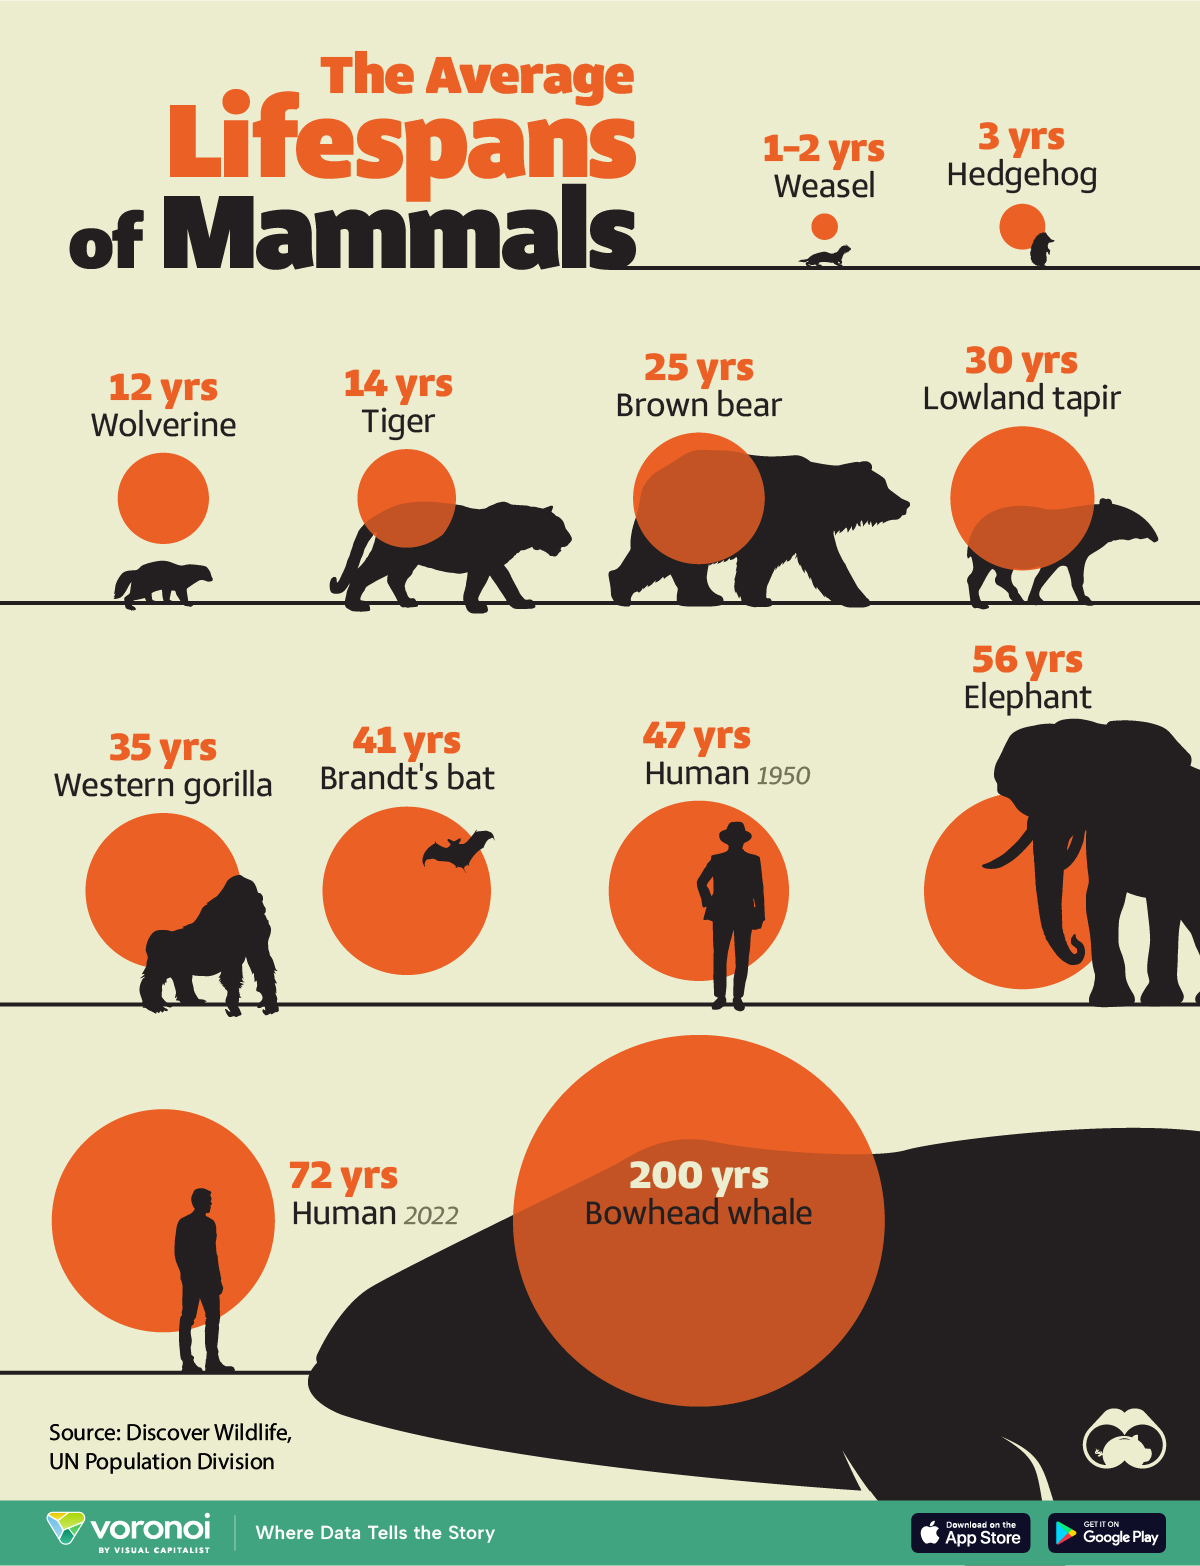
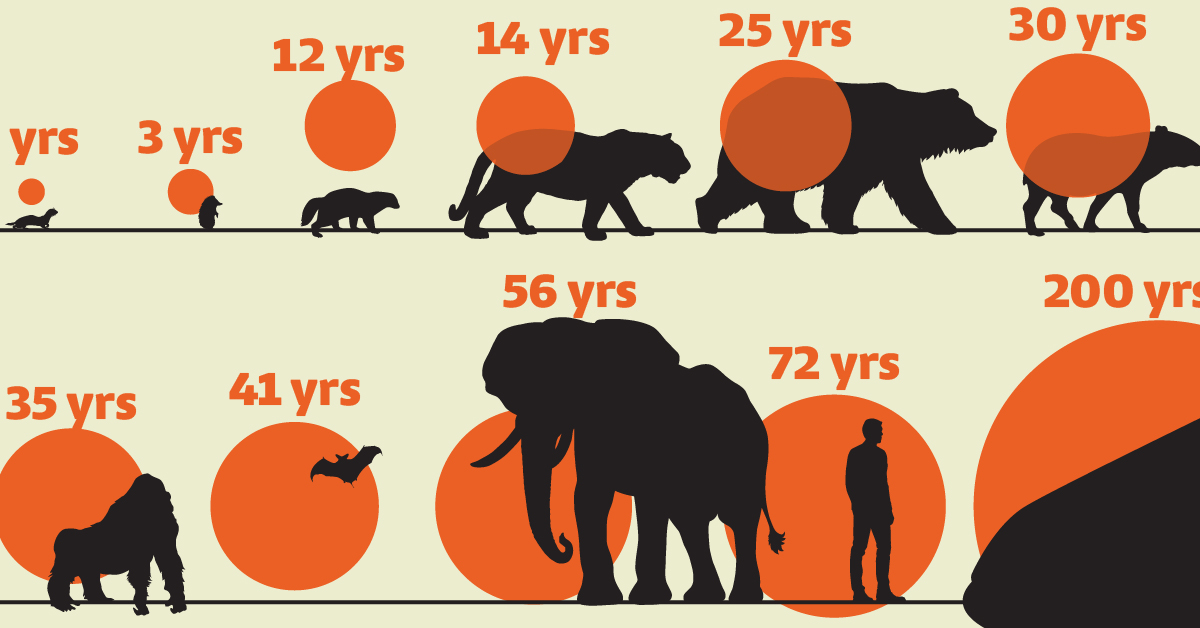
Visualizing the Average Lifespans of Mammals
While smaller animals such as weasels typically live 1-2 years, larger counterparts can thrive for decades.
Visualizing the Average Lifespans of Mammals
This was originally posted on our Voronoi app. Download the app for free on iOS or Android and discover incredible data-driven charts from a variety of trusted sources.
Mammals, though comprising a small fraction of Earth’s creatures, hold vital ecological roles globally. They are crucial for maintaining ecosystem health through services like pollination, seed dispersal, and predator-prey dynamics.
In this visualization, we depict the average lifespans of mammals, using data from Discover Wildlife and the United Nations.
Human Lifespans on the Rise
Defined as warm-blooded creatures with hair or fur, mammals nurse their young with milk from mammary glands. While smaller animals such as weasels typically live 1-2 years, larger counterparts like elephants can thrive for decades, and bowhead whales can live for 200 years, or even longer.
| Animal | Average lifespan (years) |
|---|---|
| Weasel | 1 to 2 |
| Hedgehog | 3 |
| Wolverine | 12 |
| Tiger | 14 |
| Brown bear | 25 |
| Lowland tapir | 30 |
| Western gorilla | 35 |
| Brandt's bat | 41 |
| Humans (1950) | 47 |
| Elephant | 56 |
| Humans (2022) | 72 |
| Bowhead whale | 200 |
Notably, human lifespans have experienced a remarkable surge. According to the UN Population Division, the global average life expectancy has surged from 47 years in 1950 to 72 years in 2022, marking a 25-year increase. This is attributed to advancements in nutrition, medication, and essential resources.
However, as human longevity flourishes, it can have an adverse effect on wildlife mammal populations. To put this into numbers, over the past 100,000 years, the surge in human population has precipitated an 85% reduction in wild mammal biomass.
Today, livestock dominates 62% of the world’s mammal biomass, with humans accounting for 34%, while wild mammals comprise only 4%.
Despite a decline in mammal diversity, the total biomass of terrestrial mammals has significantly increased, expanding approximately ninefold over the past 10,000 years.
Curious to learn more about mammals? Check out this graphic that shows the biomass of all the world’s mammals.

-

 Markets1 week ago
U.S. Debt Interest Payments Reach $1 Trillion
-

 Business2 weeks ago
Charted: Big Four Market Share by S&P 500 Audits
-

 Real Estate2 weeks ago
Ranked: The Most Valuable Housing Markets in America
-

 Money2 weeks ago
Which States Have the Highest Minimum Wage in America?
-

 AI2 weeks ago
Ranked: Semiconductor Companies by Industry Revenue Share
-

 Markets2 weeks ago
Ranked: The World’s Top Flight Routes, by Revenue
-

 Demographics2 weeks ago
Population Projections: The World’s 6 Largest Countries in 2075
-

 Markets2 weeks ago
The Top 10 States by Real GDP Growth in 2023