Green
Visualizing Mismanaged Plastic Waste by Country


Visualizing Mismanaged Plastic Waste by Country
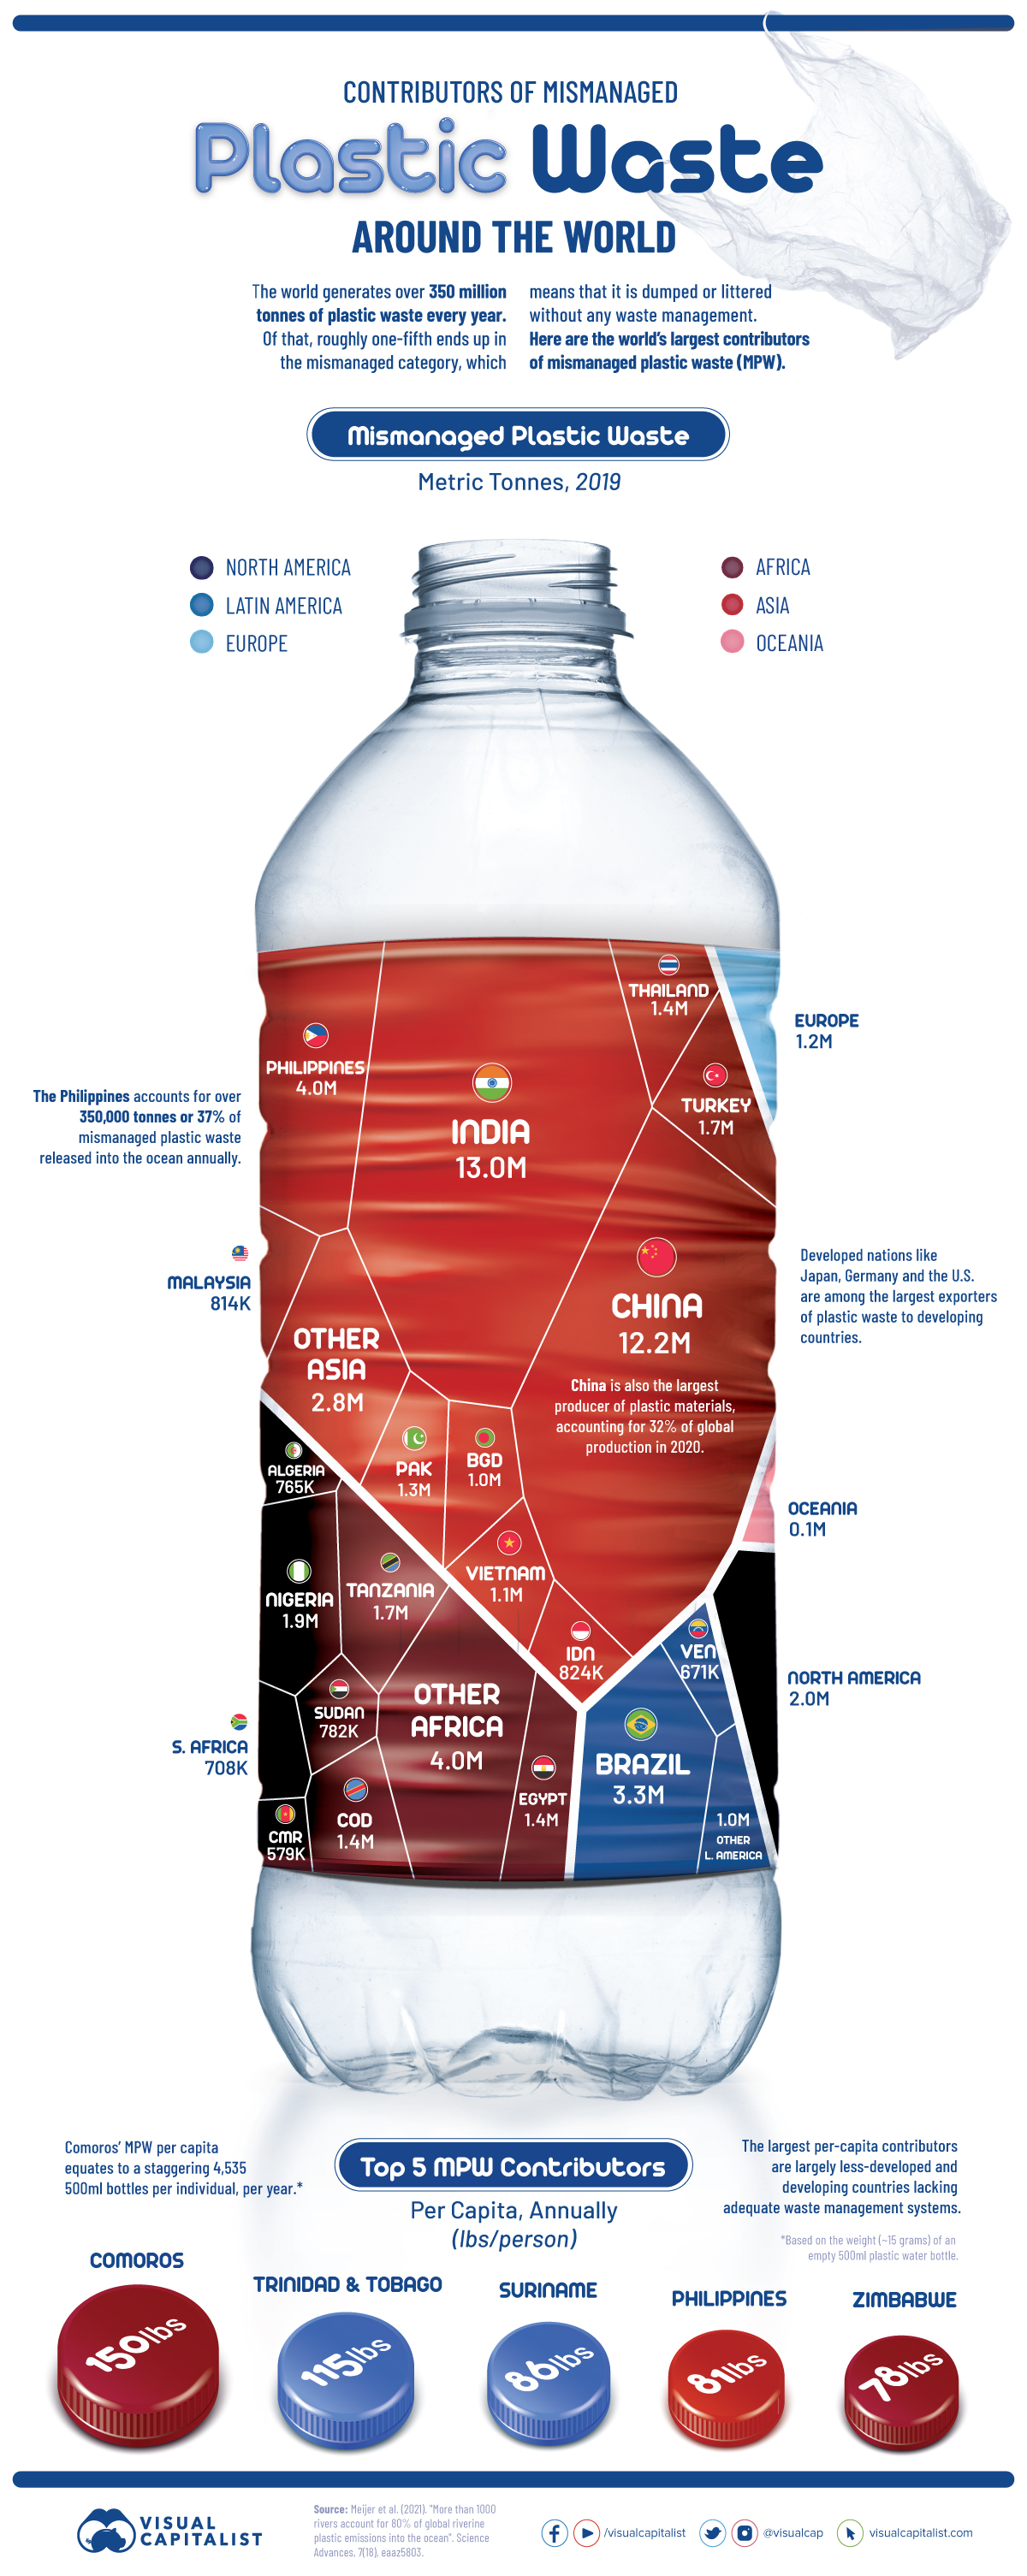
Plastic is one of the most useful materials around, but its proliferating use has created a ballooning heap of plastic waste, with more than 350 million tonnes generated each year.
Only a fraction of plastic waste is recycled, and about one-fifth ends up in the mismanaged category, meaning that it is dumped or littered without proper waste management practices. Mismanaged plastic waste threatens the land and marine environments, and most of it doesn’t decompose, polluting the environment for hundreds of years.
The above infographic visualizes the largest contributors of mismanaged plastic waste in 2019, based on data from a study by Meijer et al. published in the Science Advances journal.
The Largest Contributors of Mismanaged Plastic Waste
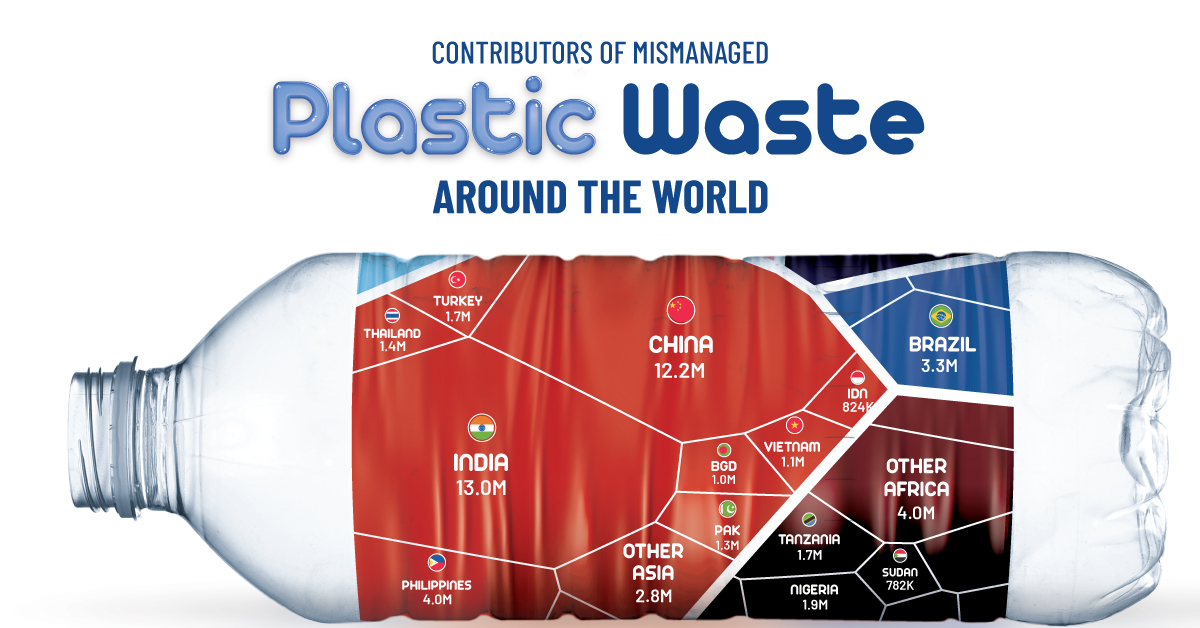
Asian countries account for the majority of global mismanaged plastic waste (MPW), and many of the top plastic-emitting rivers are concentrated in the region.
India and China are the only countries to account for over 10 million tonnes of MPW, although that could partly be driven by their sheer population numbers.
| Country/Region | MPW created in 2019 (tonnes) | % of total |
|---|---|---|
| India 🇮🇳 | 12,994,100 | 21% |
| China 🇨🇳 | 12,272,200 | 20% |
| Philippines 🇵🇭 | 4,025,300 | 7% |
| Brazil 🇧🇷 | 3,296,700 | 5% |
| Nigeria 🇳🇬 | 1,948,950 | 3% |
| North America 🌎 | 1,927,484 | 3% |
| Tanzania 🇹🇿 | 1,716,400 | 3% |
| Turkey 🇹🇷 | 1,656,110 | 3% |
| Egypt 🇪🇬 | 1,435,510 | 2% |
| DR Congo 🇨🇩 | 1,369,730 | 2% |
| Thailand 🇹🇭 | 1,361,690 | 2% |
| Pakistan 🇵🇰 | 1,346,460 | 2% |
| Europe 🌍 | 1,179,881 | 2% |
| Vietnam 🇻🇳 | 1,112,790 | 2% |
| Bangladesh 🇧🇩 | 1,021,990 | 2% |
| Indonesia 🇮🇩 | 824,234 | 1% |
| Malaysia 🇲🇾 | 814,454 | 1% |
| Sudan 🇸🇩 | 781,625 | 1% |
| Algeria 🇩🇿 | 764,578 | 1% |
| South Africa 🇿🇦 | 708,467 | 1% |
| Venezuela 🇻🇪 | 671,431 | 1% |
| Cameroon 🇨🇲 | 578,798 | 1% |
| Oceania 🌎 | 136,506 | 0.2% |
| Other 🗺 | 7,828,312 | 13% |
| Total | 61,773,700 | 100% |
Generally, the top countries in the above table are developing economies that tend to have inadequate waste management infrastructure.
The Philippines is the third-largest contributor and accounts for 37% of all MPW released into the ocean at over 350,000 tonnes per year. Solid waste management remains a major environmental issue in the Philippines. The country recently closed down 335 illegal dumpsites to encourage the use of sanitary landfills and proper waste segregation.
The three continents of North America, Europe, and Oceania together account for just 5% of global mismanaged plastic waste. However, it’s important to note that these figures do not reflect the amount of waste that is exported overseas, and many rich nations are known to export some portions of their waste to poorer nations.
The State of Plastic Waste Trade
In 2019, the Philippines famously shipped back 69 containers of dumped garbage back to Canada, joining other nations in rejecting waste from rich countries.
Until 2017, China was the largest importer of overseas plastic waste, accounting for roughly 50% of global plastic waste imports. Then, it imposed an import ban on almost all types of plastic waste, resulting in a decline in the overall global plastic scrap trade.
In 2021, global plastic waste imports were just over one-third of 2017 levels. However, countries including Malaysia, Indonesia, and Vietnam have been importing more plastic waste since China’s ban, slightly offsetting the impact.
Mismanaged Plastic Waste Per Capita
On a per capita basis, the archipelago of Comoros in East Africa tops the list. Its per capita MPW is equivalent to over 4,500 empty 500ml plastic bottles per person, per year.
| Country | MPW per capita | GDP per capita (2021, current US$) |
|---|---|---|
| Comoros 🇰🇲 | 150lbs (68kg) | $1,495 |
| Trinidad and Tobago 🇹🇹 | 115lbs (52kg) | $15,243 |
| Suriname 🇸🇷 | 86lbs (39kg) | $4,836 |
| Philippines 🇵🇭 | 81lbs (37kg) | $3,549 |
| Zimbabwe 🇿🇼 | 78lbs (35kg) | $1,737 |
While there isn’t much information available on waste management in Comoros, it is one of the world’s least-developed nations. In fact, household consumption accounts for almost 100% of its annual gross domestic product.
Trinidad and Tobago is an outlier due to its high-income status, but a lack of waste segregation among households, alongside inefficient waste management systems, contributes to its high per capita figure.
The Impact of Plastic Waste
Plastic waste has various negative implications for the environment, especially as it can take hundreds of years to decompose.
Millions of tonnes of plastic waste flows into the oceans every year, accounting for at least 85% of all marine garbage. This poses a major threat to aquatic life because fish and other organisms can get entangled in plastic waste and ingest plastics.
On land, plastic waste threatens the quality of the soil and its surrounding ecosystem. Additionally, burning plastic waste releases toxic particles that have a detrimental impact on air quality.
If current trends continue, over 12 billion tonnes of plastic waste is expected to end up in landfills by 2050. Although recycling rates are expected to improve, increasing the availability of adequate waste management systems will be important in preventing plastic waste from entering the environment.


Green
How Carbon Credits Can Help Close the Climate Funding Gap
To keep a 1.5℃ world within reach, global emissions need to fall by as much as 45% by 2030, and carbon credits could help close the gap.


How Carbon Credits Can Help Close the Climate Funding Gap
Governments around the world have committed to the goals of the Paris Agreement, but their climate pledges are insufficient. To keep a 1.5℃ world within reach, global emissions need to fall by as much as 45% by 2030.
Bold and immediate action is essential, but so are resources that will make it happen.
In this graphic, we have partnered with Carbon Streaming to look at the role that the voluntary carbon market and carbon credits can play in closing that gap.
More Funds are Needed for Climate Finance
According to data from the Climate Policy Initiative, climate finance, which includes funds for both adaptation and mitigation, needs to increase at least five-fold, from $1.3T in 2021/2022, to an average $8.6T annually until 2030, and then to just over $10T in the two decades leading up to 2050.
That adds up to a very large number, but consider that in 2022, $7.0T went to fossil fuel subsidies, which almost covers the annual estimated outlay. And the world has shown that when pressed, governments can come up with the money, if the global pandemic is any indication.
Mobilizing Carbon Finance to the Developing World
But the same cannot be said of the developing world, where debt, inequality, and poverty reduce the ability of governments to act. And this is where carbon credits can play an important role. According to analyses from Ecosystem Marketplace, carbon credits help move capital from developed countries, to where funds are needed in the developing world.
For example, in 2019, 69.2% of the carbon credits by volume in the voluntary carbon market were purchased by buyers in Europe, and nearly a third from North America. Compare that to over 90% of the volume of carbon credits sold in the voluntary carbon market in 2022 came from projects that were located outside of those two regions.
Carbon Credits Can Complement Decarbonization Efforts
Carbon credits can also complement decarbonization efforts in the corporate world, where more and more companies have been signing up to reduce emissions. According to the 2022 monitoring report from the Science Based Targets initiative, 4,230 companies around the world had approved targets and commitments, which represented an 88% increase from the prior year. However, as of year end 2022, combined scope 1 and 2 emissions covered by science-based targets totaled approximately 2 GtCO2e, which represents just a fraction of global emissions.
The fine print is that this is just scope 1 and 2 emissions, and doesn’t include scope 3 emissions, which can account for more than 70% of a company’s total emissions. And as these emissions come under greater and greater scrutiny the closer we get to 2030 and beyond, the voluntary carbon credit market could expand exponentially to help meet the need to compensate for these emissions.
Potential Carbon Credit Market Size in 2030
OK, but how big? In 2022, the voluntary carbon credit market was around $2B, but some analysts predict that it could grow to between $5–250 billion by 2030.
| Firm | Low Estimate | High Estimate |
|---|---|---|
| Bain & Company | $15B | $30B |
| Barclays | N/A | $250B |
| Citigroup | $5B | $50B |
| McKinsey & Company | $5B | $50B |
| Morgan Stanley | N/A | $100B |
| Shell / Boston Consulting Group | $10B | $40B |
Morgan Stanley and Barclays were the most bullish on the size of the voluntary carbon credit market in 2030, but the latter firm was even more optimistic about 2050, and predicted that the voluntary carbon credit market could grow to a colossal $1.5 trillion.
Carbon Streaming is Focused on Carbon Credit Integrity
Ultimately, carbon credits could have an important role to play in marshaling the resources needed to keep the world on track to net zero by 2050, and avoiding the worst consequences of a warming world.
Carbon Streaming uses streaming transactions, a proven and flexible funding model, to scale high-integrity carbon credit projects to advance global climate action and UN Sustainable Development Goals.
Learn more at www.carbonstreaming.com.

-

 Green1 week ago
Ranking the Top 15 Countries by Carbon Tax Revenue
This graphic highlights France and Canada as the global leaders when it comes to generating carbon tax revenue.
-

 Green1 week ago
Ranked: The Countries With the Most Air Pollution in 2023
South Asian nations are the global hotspot for pollution. In this graphic, we rank the world’s most polluted countries according to IQAir.
-

 Environment2 weeks ago
Top Countries By Forest Growth Since 2001
One country is taking reforestation very seriously, registering more than 400,000 square km of forest growth in two decades.
-

 Green3 weeks ago
Ranked: Top Countries by Total Forest Loss Since 2001
The country with the most forest loss since 2001 lost as much forest cover as the next four countries combined.
-

 Markets2 months ago
The World’s Top Cocoa Producing Countries
Here are the largest cocoa producing countries globally—from Côte d’Ivoire to Brazil—as cocoa prices hit record highs.
-

 Environment2 months ago
Charted: Share of World Forests by Country
We visualize which countries have the biggest share of world forests by area—and while country size plays a factor, so too, does the environment.


-

 Markets1 week ago
U.S. Debt Interest Payments Reach $1 Trillion
-

 Markets2 weeks ago
Ranked: The Most Valuable Housing Markets in America
-

 Money2 weeks ago
Which States Have the Highest Minimum Wage in America?
-

 AI2 weeks ago
Ranked: Semiconductor Companies by Industry Revenue Share
-

 Markets2 weeks ago
Ranked: The World’s Top Flight Routes, by Revenue
-

 Countries2 weeks ago
Population Projections: The World’s 6 Largest Countries in 2075
-

 Markets2 weeks ago
The Top 10 States by Real GDP Growth in 2023
-

 Money2 weeks ago
The Smallest Gender Wage Gaps in OECD Countries