Environment
Visualizing Global Per Capita CO2 Emissions


Highest Per Capita CO2 Emissions
Developing countries like China, India, and Russia are some of the highest producers of CO2 worldwide and will be so for a while. But the situation is far from straightforward—and looking at CO2 emissions per capita can add nuance to the overall story.
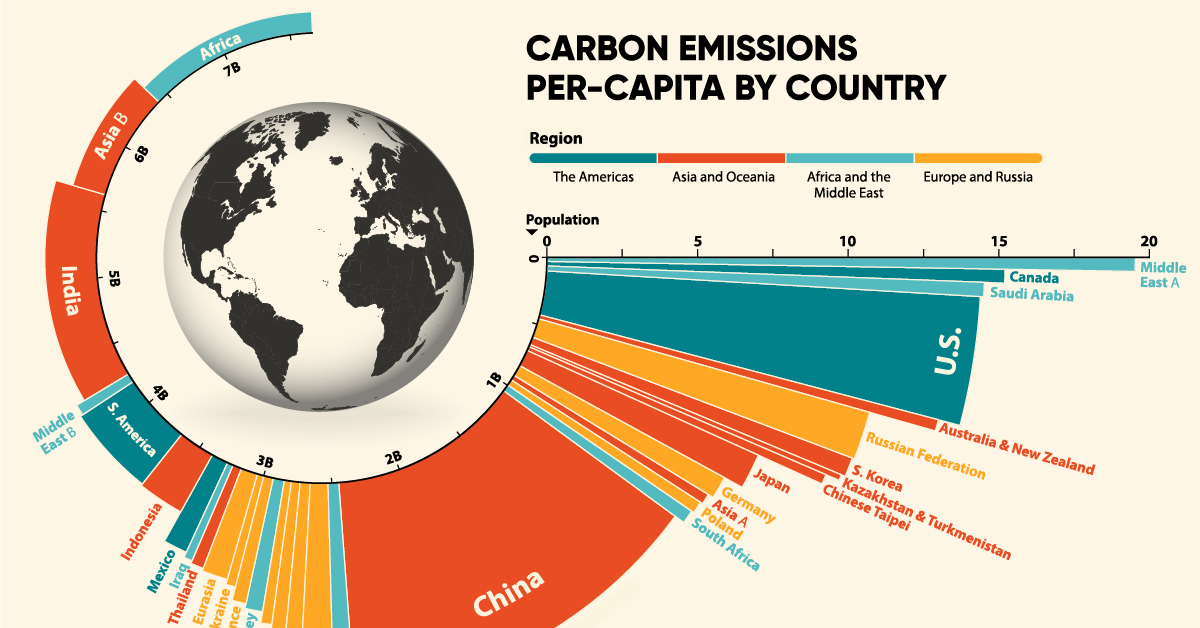
Based on data presented by the Aqal Group and the IEA, here we visualize the countries and regions with the highest per capita carbon emissions from around the world.
Let’s dive into the highest per capita carbon emitters and how they are trying to reduce their carbon contributions.
Leaders in Per Capita CO2 Emissions
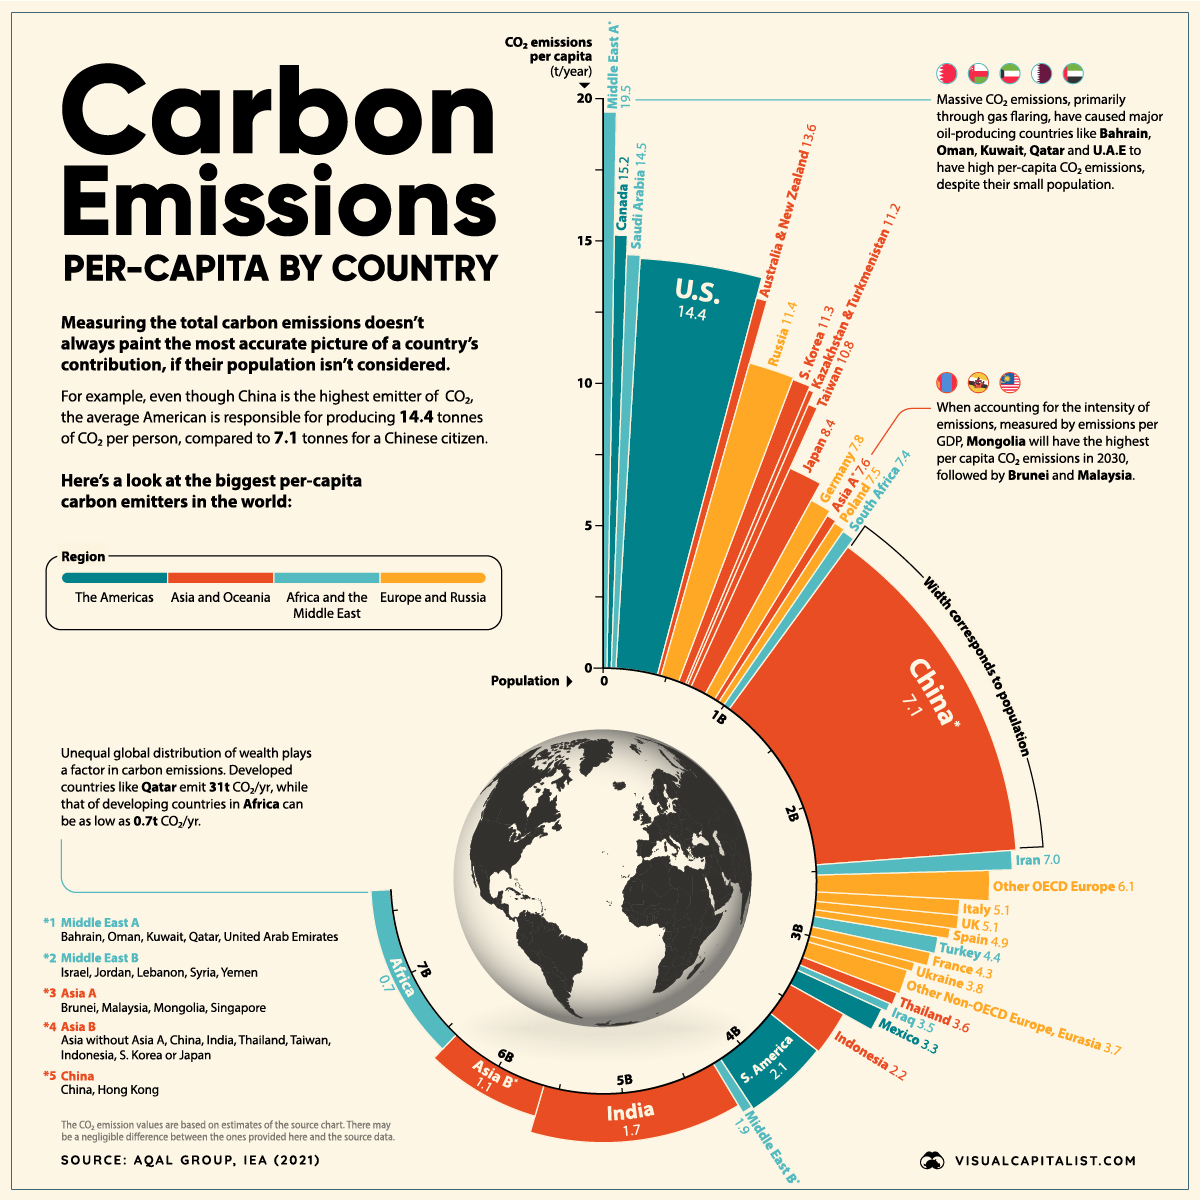
Oil-producing countries in the Middle East are the highest emitters of CO2 on a per capita basis, but developed countries like the U.S., Australia, New Zealand, and Canada also have some of the higher rates of per capita emissions.
| Rank | Country or Region | Carbon Emissions Per Capita (t/year) |
|---|---|---|
| #1 | Middle East A* | 19.5 |
| #2 | Canada | 15.2 |
| #3 | Saudi Arabia | 14.5 |
| #4 | United States | 14.4 |
| #5 | Australia & New Zealand | 13.6 |
| #6 | Russia | 11.4 |
| #7 | South Korea | 11.3 |
| #8 | Kazakhstan & Turkmenistan | 11.2 |
| #9 | Taiwan | 10.8 |
| #10 | Japan | 8.4 |
| Global Average | 4.4 |
*Middle East A group includes Bahrain, Oman, Kuwait, Qatar, and United Arab Emirates
Canada and the United States have per capita carbon footprints of 15.2 and 14.4 tonnes per year, respectively. Meanwhile, Australia and New Zealand combine for an average per capita footprint of over 13.6 tonnes per year.
It’s worth noting that all of these numbers are more than three times higher than the global average, which in 2019 was 4.4 tonnes per person.
Energy Sources and Per Capita CO2 Emissions
Since there is a strong relationship between wealth and per capita CO2 emissions, we’d expect countries with high living standards to have a high carbon footprint.
But the data above shows significant differences in per capita emissions, even between countries with similar living standards. Many countries across Europe, for example, have much lower emissions than the U.S., Canada, or Australia.
Here’s a look at the top 25 countries by standard of living and their share of electricity production from fossil fuels:
| Rank | Country | Per Capita Electricity Consumption (kWh) | % Electricity Production (from fossil fuels) |
|---|---|---|---|
| 1 | 🇫🇮 Finland | 12,174 | 15.6% |
| 2 | 🇩🇰 Denmark | 5,015 | 21.8% |
| 3 | 🇳🇴 Norway | 26,492 | 1.2% |
| 4 | 🇧🇪 Belgium | 7,414 | 34.6% |
| 5 | 🇸🇪 Sweden | 16,478 | 2.2% |
| 6 | 🇨🇭 Switzerland | 7,935 | 1.0% |
| 7 | 🇳🇱 Netherlands | 7,264 | 71.5% |
| 8 | 🇫🇷 France | 8,097 | 9.5% |
| 9 | 🇩🇪 Germany | 6,771 | 43.8% |
| 10 | 🇯🇵 Japan | 7,446 | 69.1% |
| 11 | 🇬🇧 United Kingdom | 4,500 | 40.7% |
| 12 | 🇨🇦 Canada | 16,648 | 16.6% |
| 13 | 🇰🇷 South Korea | 10,458 | 65.8% |
| 14 | 🇺🇸 United States | 12,235 | 60.1% |
| 15 | 🇹🇼 Taiwan | 11,091 | 82.8% |
| 16 | 🇦🇹 Austria | 7,716 | 20.7% |
| 17 | 🇦🇺 Australia | 9,857 | 75.1% |
| 18 | 🇮🇪 Ireland | 6,408 | 59.3% |
| 19 | 🇸🇬 Singapore | 8,542 | 96.7% |
| 20 | 🇪🇸 Spain | 5,641 | 34.4% |
| 21 | 🇮🇹 Italy | 4,554 | 56.8% |
| 22 | 🇨🇿 Czech Republic | 7,534 | 50.7% |
| 23 | 🇵🇹 Portugal | 5,100 | 41.2% |
| 24 | 🇳🇿 New Zealand | 8,880 | 18.9% |
| 25 | 🇱🇺 Luxembourg | 1,529 | 28.5% |
Sources: Electricity consumption, Fossil fuel mix
The choice of energy sources plays a key role here. In the UK, Portugal, and France, a much higher share of electricity is produced from nuclear and renewable sources.
For example, only 9.5% of France’s electricity production comes from fossil fuels, compared to other developed countries like the U.S. at 60.1% and Japan at 69.1%.
G20 Countries and Carbon Emissions
This reliance on fossil fuels for energy production extends to the rest of the G20 countries. According to the Climate Transparency Report, CO2 emissions will rise by 4% across the G20 group this year, dropping 6% in 2020 due to the pandemic.
This rise is mainly due to the increase in coal consumption across these countries. Coal consumption is projected to rise by almost 5% in 2021, with this growth driven by China (accounting for 61% of the growth), the U.S. (18%), and India (17%).
Here’s a look at the current coal power capacity of each G20 country:
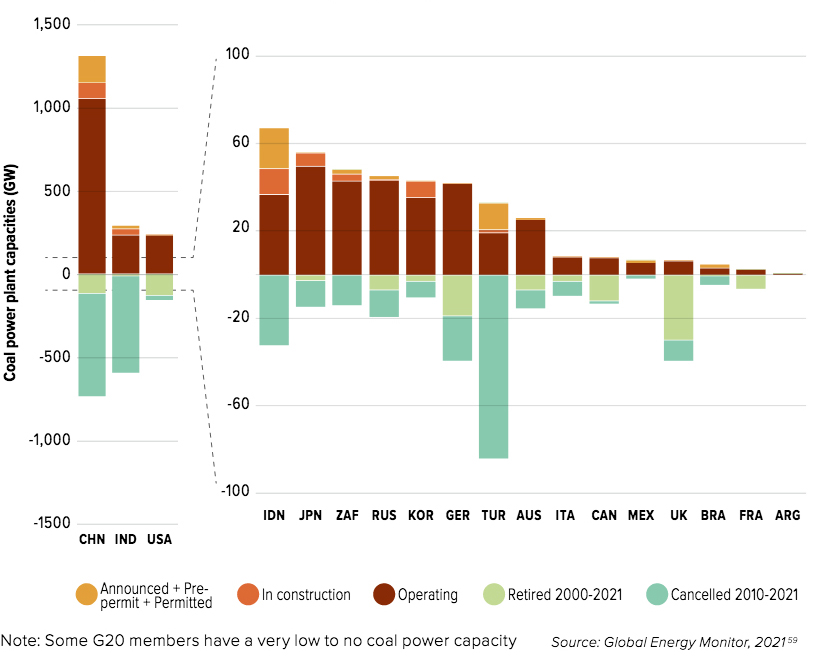
Coal use in China has surged, with the country experiencing increased demand for energy as the global economy has recovered. Coal prices are up nearly 200% from a year ago.
Plans to Tackle Emissions
The conclusion of the U.N. Climate Change Conference (COP26) in Glasgow saw several pledges and announcements being made by various countries. Here are some of the highlights:
- The world’s biggest CO2 emitters, the U.S. and China, pledged to cooperate more over the next decade in areas including methane emissions and the switch to clean energy.
- Leaders from more than 100 countries—with about 85% of the world’s forests—promised to stop deforestation by 2030.
- More than 100 countries agreed upon a scheme to cut 30% of methane emissions by 2030.
- Financial organizations have agreed to back renewable energy and direct finance away from fossil fuel-burning industries.
Many countries have pledged to do their part to tackle climate change. It will be an impressive display of global unity if global CO2 emissions drop significantly over the next decade.


Green
Ranked: Top Countries by Total Forest Loss Since 2001
The country with the most forest loss since 2001 lost as much forest cover as the next four countries combined.
Ranked: Top Countries By Total Forest Loss Since 2001
This was originally posted on our Voronoi app. Download the app for free on iOS or Android and discover incredible data-driven charts from a variety of trusted sources.
Forests are critical natural resources, often caught in the crosshairs of economic development. Thanks to expanding human settlement, agriculture, and industry, the world lost nearly 1 million square kilometers (km²) of forest cover since 2001.
But where has most of this deforestation occurred?
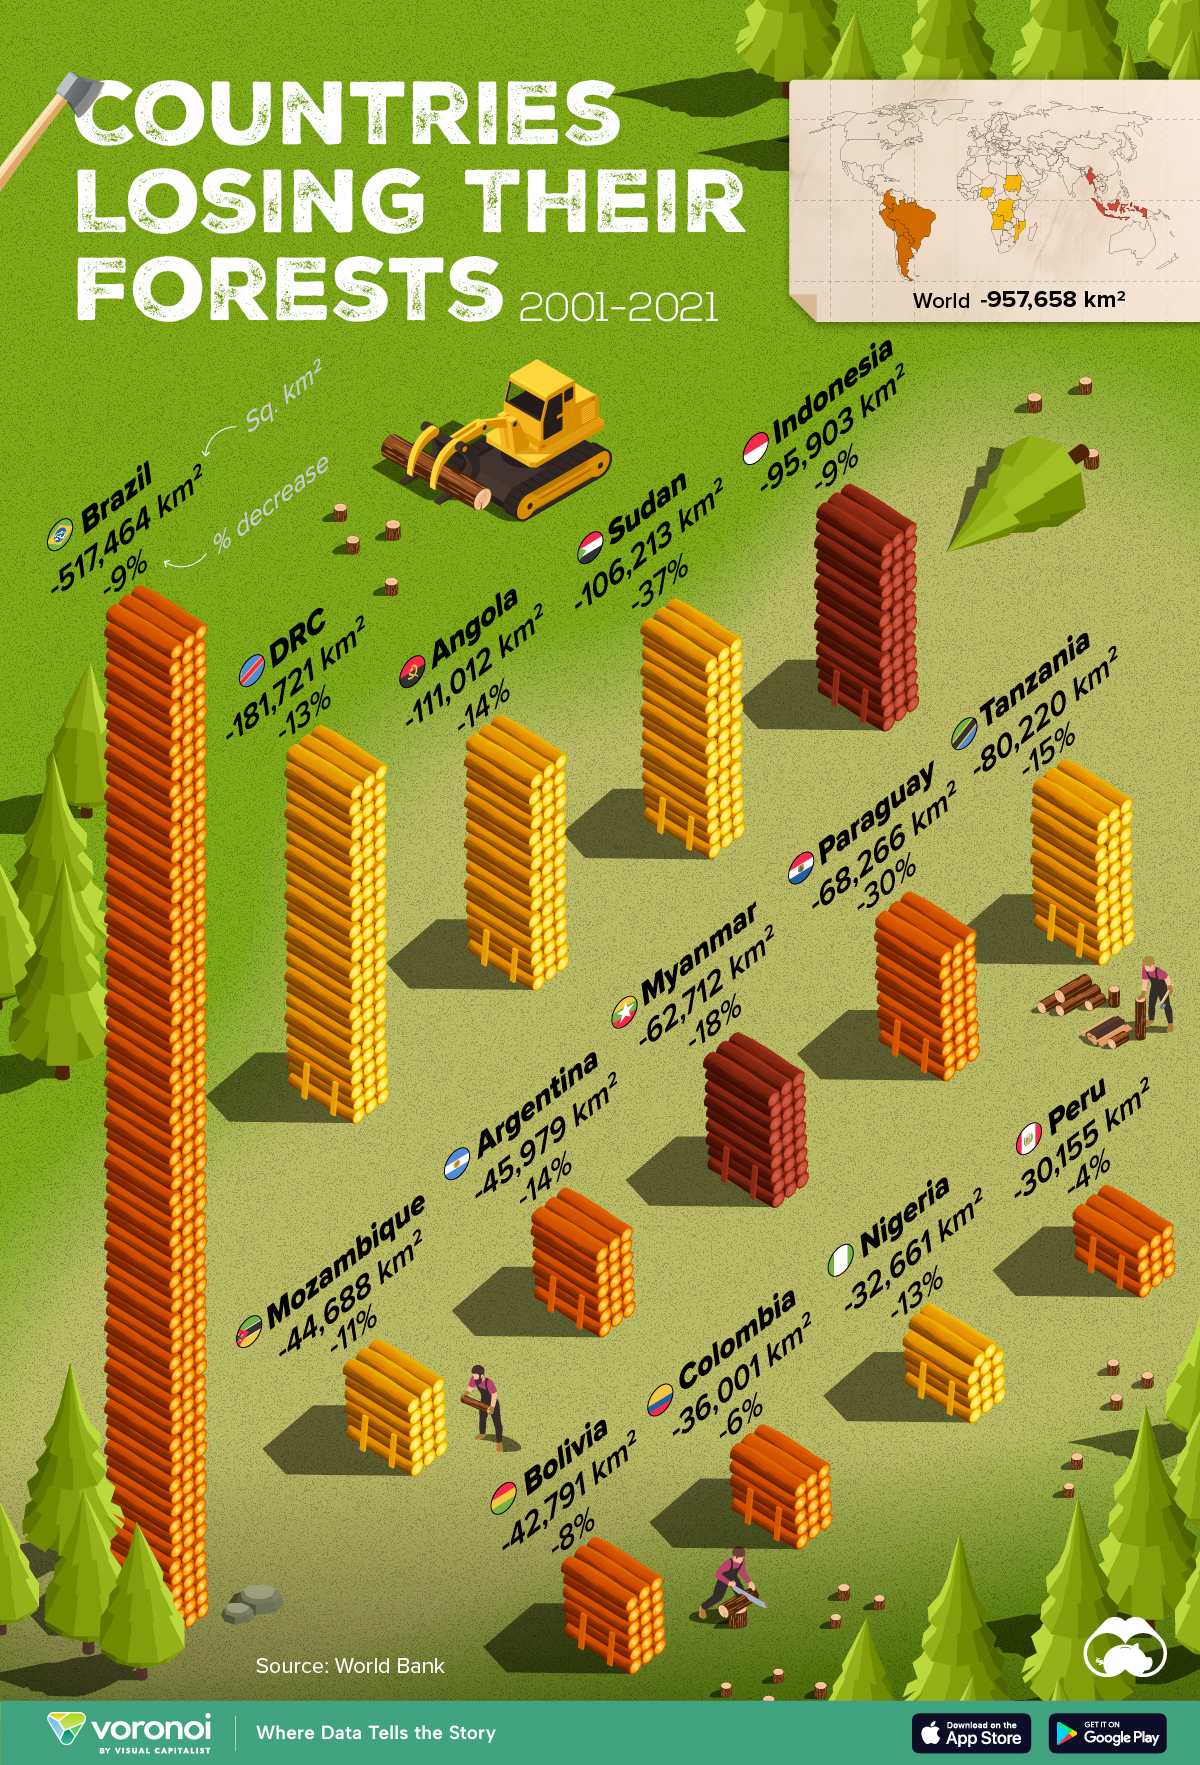
We rank the countries by the total decrease in their forest area between 2001 and 2021, measured in square kilometers along with their percentage decrease for context. All of this data was sourced from the World Bank.
A caveat to this data: countries are ranked by total forest loss, so countries with the largest forests feature predominantly on this list.
Which Country Has Lost the Most Forests (2001-2021)?
Brazil has lost more than half a million square kilometers of forest in the last two decades. Agricultural expansion for beef and soy production alongside mining and infrastructure growth are the primary drivers behind this large scale deforestation.
This has also caused periodic fires in the Amazon rainforest, drawing repeated alarm from around the world. In fact, Brazil has lost as much forest cover as the next four countries combined.
The table below lists the countries included in this graphic, as well as several others further down the ranking.
| Rank | Country | Region | 2001–21 Change (in km2) | % of Forest Loss |
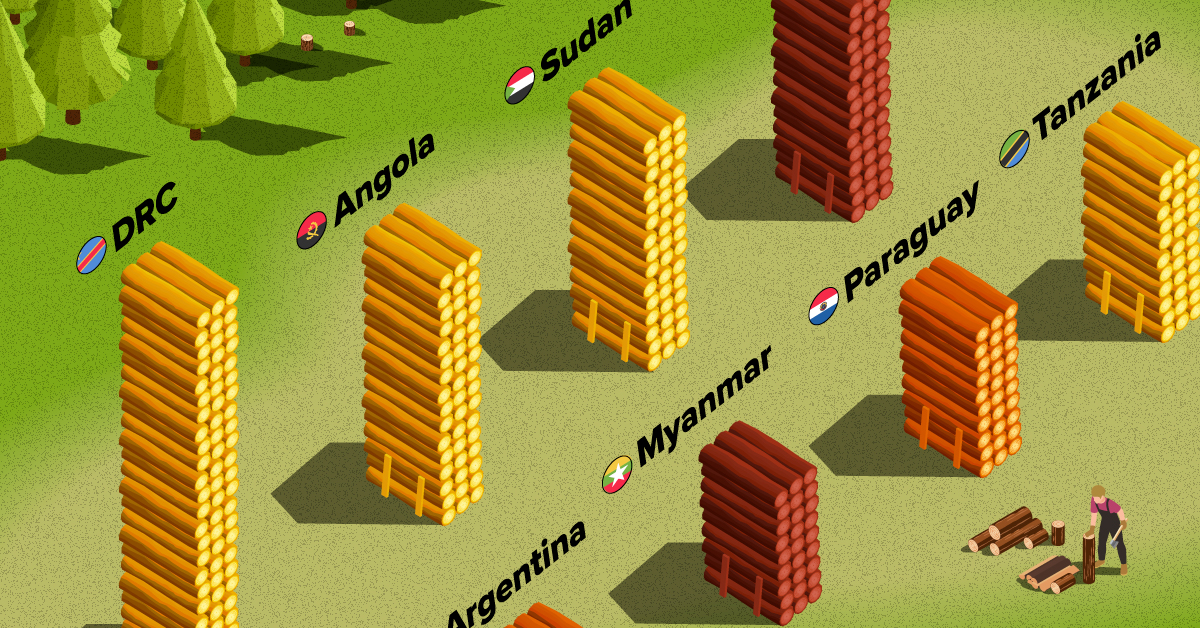
|---|---|---|---|---|
| 1 | 🇧🇷 Brazil | South America | -517,464 | -9% |
| 2 | 🇨🇩 DRC | Africa | -181,721 | -13% |
| 3 | 🇦🇴 Angola | Africa | -111,012 | -14% |
| 4 | 🇸🇩 Sudan | Africa | -106,213 | -37% |
| 5 | 🇮🇩 Indonesia | Asia | -95,903 | -9% |
| 6 | 🇹🇿 Tanzania | Africa | -80,220 | -15% |
| 7 | 🇵🇾 Paraguay | South America | -68,266 | -30% |
| 8 | 🇲🇲 Myanmar | Asia | -62,712 | -18% |
| 9 | 🇦🇷 Argentina | South America | -45,979 | -14% |
| 10 | 🇲🇿 Mozambique | Africa | -44,688 | -11% |
| 11 | 🇧🇴 Bolivia | South America | -42,791 | -8% |
| 12 | 🇨🇴 Colombia | South America | -36,001 | -6% |
| 13 | 🇳🇬 Nigeria | Africa | -32,661 | -13% |
| 14 | 🇵🇪 Peru | South America | -30,155 | -4% |
| 15 | 🇰🇭 Cambodia | Asia | -28,491 | -26% |
| 16 | 🇻🇪 Venezuela | South America | -28,130 | -6% |
| 17 | 🇲🇽 Mexico | North America | -26,732 | -4% |
| 18 | 🇿🇲 Zambia | Africa | -23,924 | -5% |
| 19 | 🇧🇼 Botswana | Africa | -23,660 | -14% |
| 20 | 🇨🇮 Cote d'Ivoire | Africa | -22,577 | -45% |
What is quickly apparent is how most of the countries on this list are from Africa and South America. A study found a correlation where developing economies tend to have higher deforestation rates than advanced economies. Former colonies have also experienced more forest loss than those that were not colonized.
In Asia, Indonesia’s burgeoning palm oil industry is a key driver to deforestation, though efforts are now being made to reverse its impact. Meanwhile, Cambodia experienced rapid clear-cutting for its growing rubber plantations and timber industry.
Finally, Myanmar has long contended with illegal logging, but the country’s ongoing civil war is styming conversation efforts.

-

 Maps2 weeks ago
Mapped: Average Wages Across Europe
-

 Money1 week ago
Which States Have the Highest Minimum Wage in America?
-

 Real Estate1 week ago
Ranked: The Most Valuable Housing Markets in America
-

 Markets1 week ago
Charted: Big Four Market Share by S&P 500 Audits
-

 AI1 week ago
The Stock Performance of U.S. Chipmakers So Far in 2024
-

 Automotive1 week ago
Almost Every EV Stock is Down After Q1 2024
-

 Money2 weeks ago
Where Does One U.S. Tax Dollar Go?
-

 Green2 weeks ago
Ranked: Top Countries by Total Forest Loss Since 2001