Automotive
Visualizing Global Electric Vehicle Sales in 2023, by Market Share
![]() See this visualization first on the Voronoi app.
See this visualization first on the Voronoi app.
Visualizing the Global Electric Vehicle Market in 2023
This was originally posted on our Voronoi app. Download the app for free on iOS or Android and discover incredible data-driven charts from a variety of trusted sources.
Analysts anticipate that China’s largest electric automaker BYD will surpass Tesla in battery electric vehicle (BEV) sales for 2024.
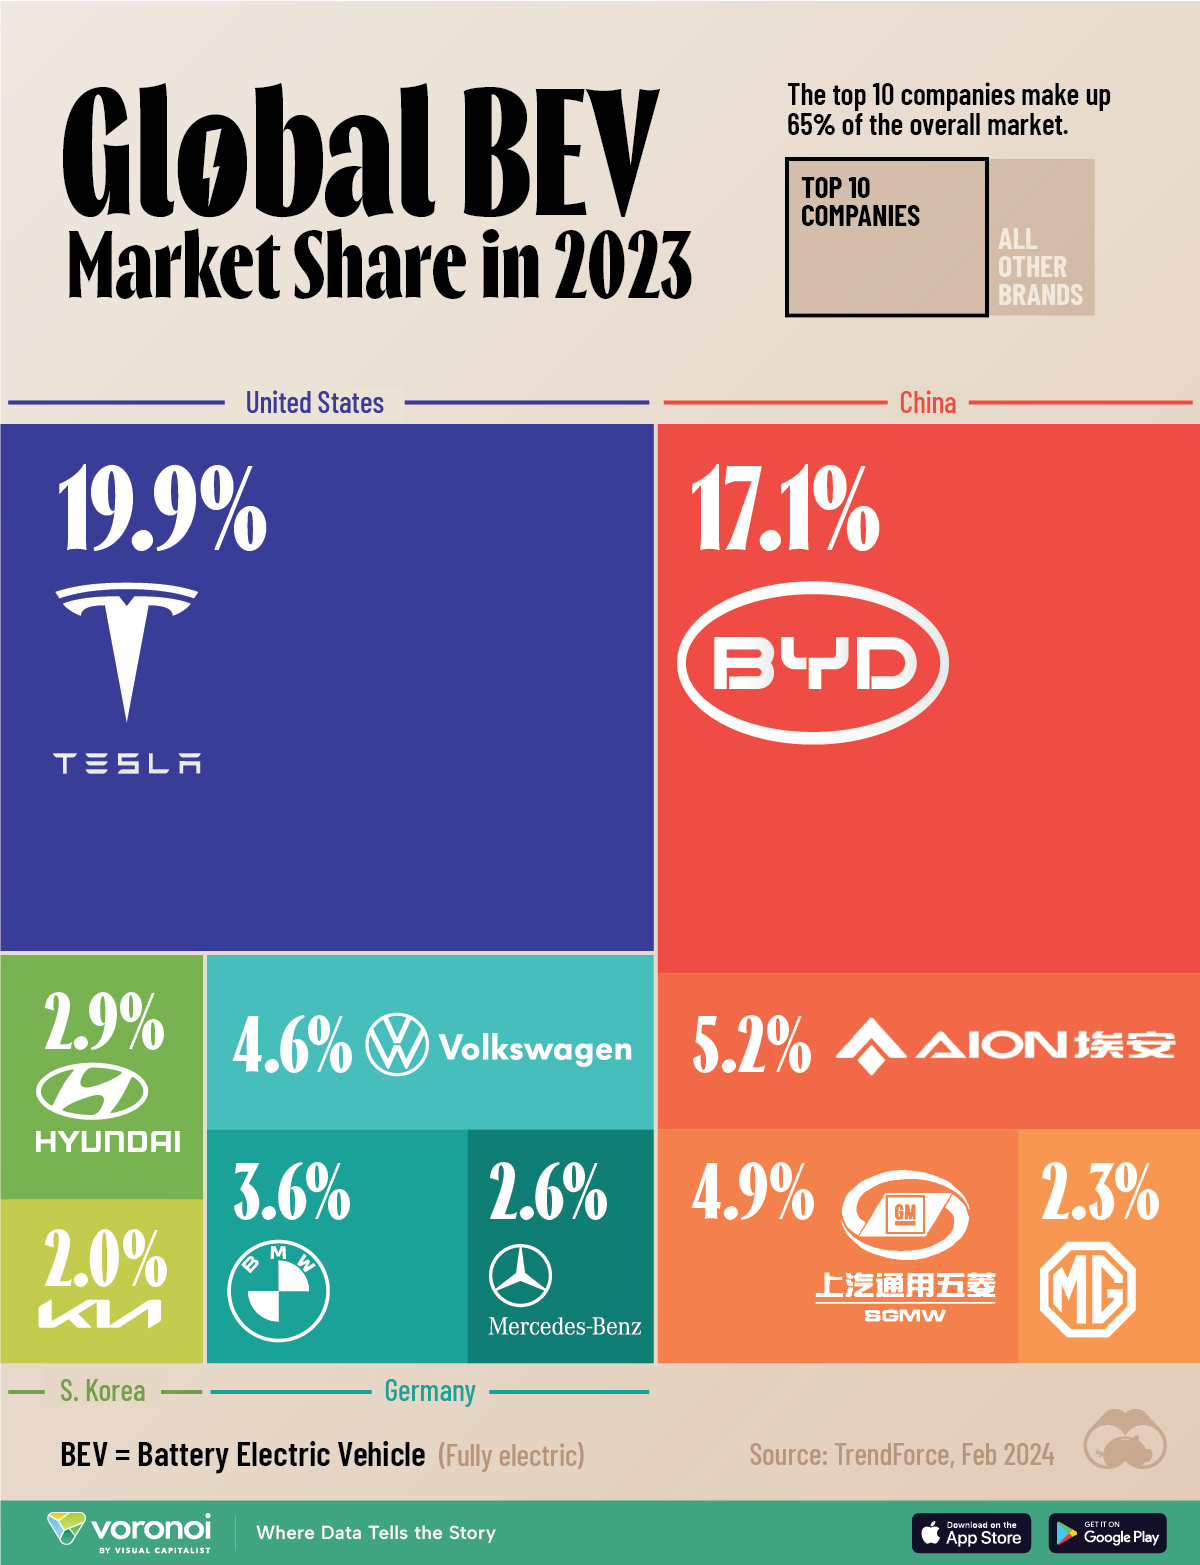
In this graphic, we illustrate the global BEV market share for the full year 2023, based on figures compiled by TrendForce.
BYD Likely to Surpass Tesla in 2024
Currently, the top 10 BEV companies make up 65% of the overall market.
Given that BYD already outsold Tesla in the fourth quarter of 2023 (526,000 compared to 485,000), the Chinese company is expected to surpass Elon Musk’s automaker before the end of the year.
Currently, Tesla holds a 19.9% share of the market, closely followed by BYD with 17.1%.
| Rank | Brand | Country | Market Share in 2023 |
|---|---|---|---|
| 1 | Tesla | 🇺🇸 US | 19.9% |
| 2 | BYD | 🇨🇳 China | 17.1% |
| 3 | GAC Aion | 🇨🇳 China | 5.2% |
| 4 | SAIC-GM-Wuling | 🇨🇳 China | 4.9% |
| 5 | Volkswagen | 🇩🇪 Germany | 4.6% |
| 6 | BMW | 🇩🇪 Germany | 3.6% |
| 7 | Hyundai | 🇰🇷 S. Korea | 2.9% |
| 8 | Mercedes-Benz | 🇩🇪 Germany | 2.6% |
| 9 | MG | 🇨🇳 China | 2.3% |
| 10 | KIA | 🇰🇷 S. Korea | 2.0% |
In 2022, the Chinese automaker overtook Tesla as the top producer of EVs, when non-BEVs are included in sales totals. It produced 1.8 million vehicles compared to Tesla’s 1.3 million.
BYD has relied on stable domestic sales performance but is also expanding its international presence. The company began selling in Europe a little over a year ago and also plans to build factories in European countries to avoid EU tariffs on Chinese car imports.
Another Chinese automaker, GAC Aion, secured the third spot on our list, with SAIC-GM-Wuling and Volkswagen falling to fourth and fifth, respectively.
Luxury brands BMW and Mercedes-Benz accelerated their electrification efforts, ranking sixth and eighth, while Hyundai Group’s Hyundai and KIA maintained their positions compared to the previous year.
In total, global sales of EVs, including BEVs, PHEVs (Plug-in Hybrid Electric Vehicles), and FCVs (Fuel Cell Vehicles), reached 13 million units in 2023, with a growth rate of 29.8% compared to 2022.
The number, however, represents a significant slowdown from the 54.2% growth rate in 2022.


Automotive
How People Get Around in America, Europe, and Asia
Examining how people get around using cars, public transit, and walking or biking, and the regional differences in usage.


How People Get Around in America, Europe, and Asia
This was originally posted on our Voronoi app. Download the app for free on iOS or Android and discover incredible data-driven charts from a variety of trusted sources.
This chart highlights the popularity of different transportation types in the Americas, Europe, and Asia, calculated by modal share.
Data for this article and visualization is sourced from ‘The ABC of Mobility’, a research paper by Rafael Prieto-Curiel (Complexity Science Hub) and Juan P. Ospina (EAFIT University), accessed through ScienceDirect.
The authors gathered their modal share data through travel surveys, which focused on the primary mode of transportation a person employs for each weekday trip. Information from 800 cities across 61 countries was collected for this study.
North American Car Culture Contrasts with the Rest of the World
In the U.S. and Canada, people heavily rely on cars to get around, no matter the size of the city. There are a few exceptions of course, such as New York, Toronto, and smaller college towns across the United States.
| Region | 🚗 Cars | 🚌 Public Transport | 🚶 Walking/Biking |
|---|---|---|---|
| North America* | 92% | 5% | 4% |
| Central America | 23% | 42% | 35% |
| South America | 29% | 40% | 31% |
| Northern Europe | 48% | 29% | 24% |
| Western Europe | 43% | 24% | 34% |
| Southern Europe | 50% | 24% | 25% |
| Eastern Europe | 35% | 40% | 25% |
| Southeastern Asia | 44% | 43% | 13% |
| Western Asia | 43% | 28% | 29% |
| Southern Asia | 22% | 39% | 39% |
| Eastern Asia | 19% | 46% | 35% |
| World | 51% | 26% | 22% |
Note: *Excluding Mexico. Percentages are rounded.
As a result, North America’s share of public transport and active mobility (walking and biking) is the lowest amongst all surveyed regions by a significant amount.
On the other hand, public transport reigns supreme in South and Central America as well as Southern and Eastern Asia. It ties with cars in Southeastern Asia, and is eclipsed by cars in Western Asia.
As outlined in the paper, Europe sees more city-level differences in transport popularity.
For example, Utrecht, Netherlands prefers walking and biking. People in Paris and London like using their extensive transit systems. And in Manchester and Rome, roughly two out of three journeys are by car.

-

 Markets5 days ago
Visualizing Global Inflation Forecasts (2024-2026)
-

 Green2 weeks ago
The Carbon Footprint of Major Travel Methods
-

 United States2 weeks ago
Visualizing the Most Common Pets in the U.S.
-

 Culture2 weeks ago
The World’s Top Media Franchises by All-Time Revenue
-

 voronoi1 week ago
Best Visualizations of April on the Voronoi App
-

 Wealth1 week ago
Charted: Which Country Has the Most Billionaires in 2024?
-

 Business1 week ago
The Top Private Equity Firms by Country
-

 Markets1 week ago
The Best U.S. Companies to Work for According to LinkedIn