Datastream
Visualizing Earth’s Global Ice Loss Between 1994-2017
The Briefing
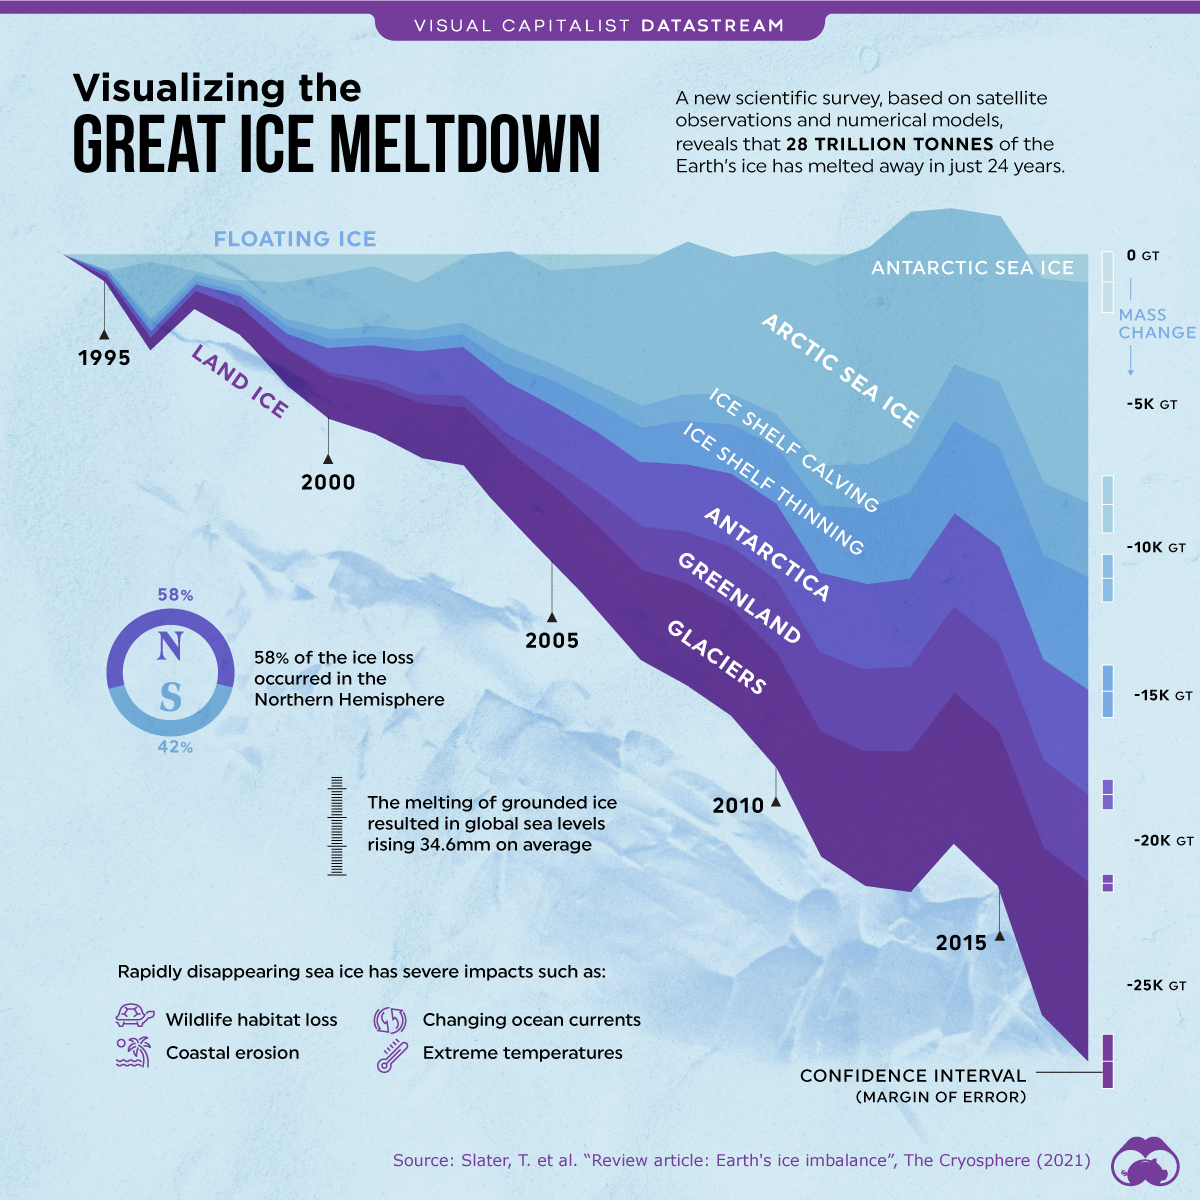
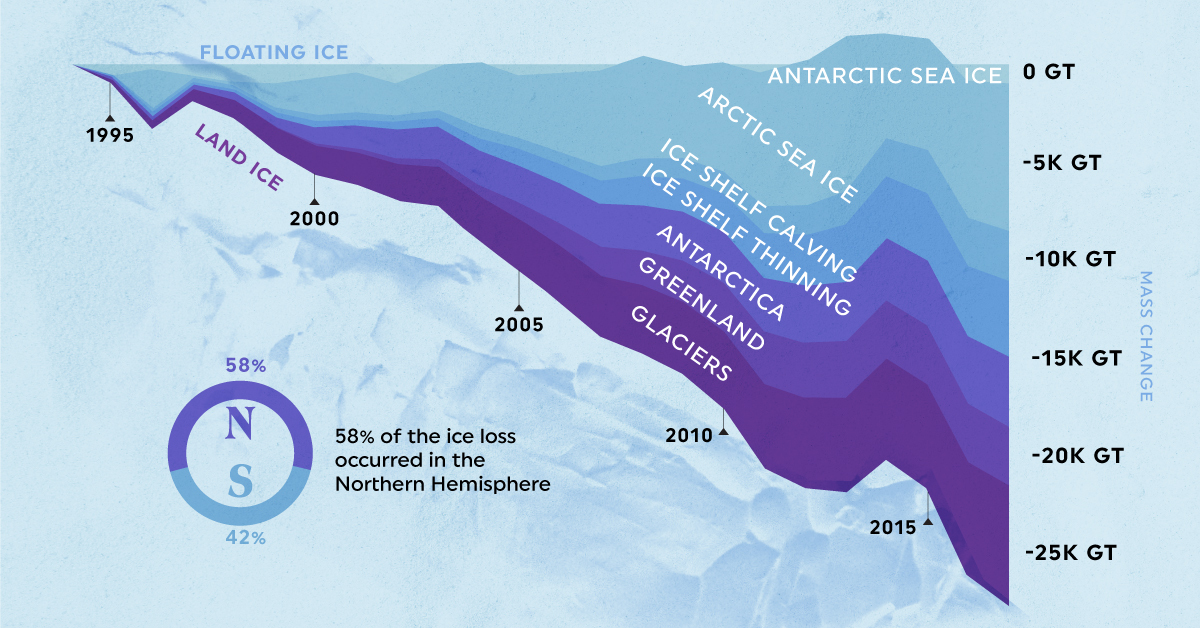
- Due to global warming, 28 trillion tonnes of ice have melted in just over two decades
- Over half (58%) of this global ice loss occurred in the Northern Hemisphere
Visualizing Earth’s Global Ice Loss Between 1994-2017
Nearly 70% of the Earth’s freshwater is locked up in glaciers and ice caps, ground ice, and permafrost. However, this ice is melting at an unprecedented rate.
Based on data from a new scientific survey, this visualization reveals that 28 trillion tonnes of Earth’s ice has been lost between 1994 and 2017.
How Much Ice Is Being Lost Exactly?
Figures at such scales can be difficult to wrap our heads around. For the record, one billion tonnes of water is equal to 400,000 Olympic swimming pools.
It’s then a bit easier to comprehend why, when multiplied tens of thousands of times, this much melted ice—specifically, grounded ice—has resulted in global sea levels rising by 34.6mm on average.
| Cryosphere category | Ice type | Change (1994-2017) |
|---|---|---|
| Arctic sea ice | Floating | 7.6 trillion tonnes |
| Antarctic ice shelves | Grounded | 6.5 trillion tonnes |
| Mountain glaciers | Grounded | 6.1 trillion tonnes |
| Greenland ice sheet | Grounded | 3.8 trillion tonnes |
| Antarctic ice sheet | Grounded | 2.5 trillion tonnes |
| Southern Ocean sea ice | Floating | 0.9 trillion tonnes |
Over half (58%) of the ice loss occurred in the Northern Hemisphere, from Arctic sea ice and also grounded ice previously trapped in the Greenland ice sheet.
In fact, the rate of ice loss has risen from 0.8 trillion tonnes to 1.2 trillion tonnes per year, an increase of 57% since the 1990s.
The Impacts of the Ice Meltdown
Rapidly disappearing sea ice has severe impacts on the environment, both in the short and long term:
- Wildlife habitat loss
- Coastal erosion
- Changing ocean currents
- Extreme temperatures
While rising temperatures are behind most of this historical global ice loss, it’s worth noting that lower levels of ice lead to a positive feedback loop. Less ice means less of the sun’s heat is reflected away from the Earth, instead being absorbed back and further amplifying the global warming effect.
>>Like this? Then you might like this article on Mapping Territorial Claims in Antarctica
Where does this data come from?
Source: Slater, T. et al. “Review article: Earth’s ice imbalance”, The Cryosphere (2021)
Notes: Data from the scientific survey is based on satellite observations and numerical models. The metric measure of a “tonne” (1,000kg) has been used throughout for accuracy.


Datastream
Can You Calculate Your Daily Carbon Footprint?
Discover how the average person’s carbon footprint impacts the environment and learn how carbon credits can offset your carbon footprint.


The Briefing
- A person’s carbon footprint is substantial, with activities such as food consumption creating as much as 4,500 g of CO₂ emissions daily.
- By purchasing carbon credits from Carbon Streaming Corporation, you can offset your own emissions and fund positive climate action.
Your Everyday Carbon Footprint
While many large businesses and countries have committed to net-zero goals, it is essential to acknowledge that your everyday activities also contribute to global emissions.
In this graphic, sponsored by Carbon Streaming Corporation, we will explore how the choices we make and the products we use have a profound impact on our carbon footprint.
Carbon Emissions by Activity
Here are some of the daily activities and products of the average person and their carbon footprint, according to Clever Carbon.
| Household Activities & Products | CO2 Emissions (g) |
|---|---|
| 💡 Standard Light Bulb (100 watts, four hours) | 172 g |
| 📱 Mobile Phone Use (195 minutes per day)* | 189 g |
| 👕 Washing Machine (0.63 kWh) | 275 g |
| 🔥 Electric Oven (1.56 kWh) | 675 g |
| ♨️ Tumble Dryer (2.5 kWh) | 1,000 g |
| 🧻 Toilet Roll (2 ply) | 1,300 g |
| 🚿 Hot Shower (10 mins) | 2,000 g |
| 🚙 Daily Commute (one hour, by car) | 3,360 g |
| 🍽️ Average Daily Food Consumption (three meals of 600 calories) | 4,500 g |
| *Phone use based on yearly use of 69kg per the source, Reboxed | |
Your choice of transportation plays a crucial role in determining your carbon footprint. For instance, a 15 km daily commute to work on public transport generates an average of 1,464 g of CO₂ emissions. Compared to 3,360 g—twice the volume for a journey the same length by car.
By opting for more sustainable modes of transport, such as cycling, walking, or public transportation, you can significantly reduce your carbon footprint.
Addressing Your Carbon Footprint
One way to compensate for your emissions is by purchasing high-quality carbon credits.
Carbon credits are used to help fund projects that avoid, reduce or remove CO₂ emissions. This includes nature-based solutions such as reforestation and improved forest management, or technology-based solutions such as the production of biochar and carbon capture and storage (CCS).
While carbon credits offer a potential solution for individuals to help reduce global emissions, public awareness remains a significant challenge. A BCG-Patch survey revealed that only 34% of U.S. consumers are familiar with carbon credits, and only 3% have purchased them in the past.
About Carbon Streaming
By financing the creation or expansion of carbon projects, Carbon Streaming Corporation secures the rights to future carbon credits generated by these sustainable projects. You can then purchase these carbon credits to help fund climate solutions around the world and compensate for your own emissions.
Ready to get involved?
>> Learn more about purchasing carbon credits at Carbon Streaming

-

 Markets1 week ago
U.S. Debt Interest Payments Reach $1 Trillion
-

 Business2 weeks ago
Charted: Big Four Market Share by S&P 500 Audits
-

 Real Estate2 weeks ago
Ranked: The Most Valuable Housing Markets in America
-

 Money2 weeks ago
Which States Have the Highest Minimum Wage in America?
-

 AI2 weeks ago
Ranked: Semiconductor Companies by Industry Revenue Share
-

 Markets2 weeks ago
Ranked: The World’s Top Flight Routes, by Revenue
-

 Demographics2 weeks ago
Population Projections: The World’s 6 Largest Countries in 2075
-

 Markets2 weeks ago
The Top 10 States by Real GDP Growth in 2023