Misc
Visualizing 200 Years of U.S. Population Density
Visualizing 200 Years of U.S. Population Density
At the moment, there are around 326 million people living in the United States, a country that’s 3.5 million square miles (9.8 million sq km) in land area.
But throughout the nation’s history, neither of these numbers have stayed constant.
Not only did the population boom as a result of births and immigrants, but the borders of the country kept changing as well – especially in the country’s early years as settlers moved westwards.
U.S. Population Density Over Time
From a big picture perspective, here is how population density has changed for the country as a whole over the last 200 years or so:
[table “404” not found /]But today’s animated map, which comes to us from Vivid Maps, takes things a step further.
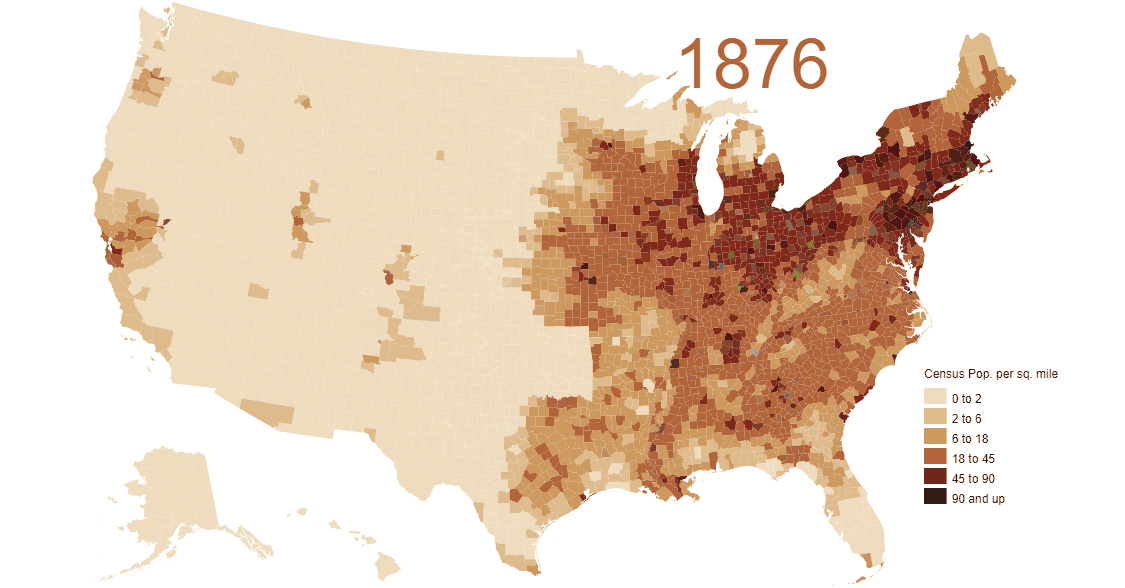
It plots U.S. population density numbers over the time period of 1790-2010 based on U.S. Census data and Jonathan Schroeder’s county-level decadal estimates for population. In essence, it gives a more precise view of who moved where and when over the course of the nation’s history.
Note: While U.S. Census data is granular and dates back to 1790, it comes with certain limitations. One obvious drawback, for example, is that such data is not able to properly account for Native American populations.
“Go West, Young Man”
As you might notice in the animation, there is one anomaly that appears in the late-1800s: the area around modern-day Oklahoma is colored in, but the state itself is an “empty gap” on the map.
The reason for this? The area was originally designated as Indian Territory – land reserved for the forced re-settlement of Native Americans. However, in 1889, the land was opened up to a massive land rush, and approximately 50,000 pioneers lined up to grab a piece of the two million acres (8,000 km²) opened for settlement.
While settlers flocking to Oklahoma is one specific event that ties into this animation, really the map shows the history of a much broader land rush in general: Manifest Destiny.
You can see pioneers landing in Louisiana in the early 1800s, the first settlements in California and Oregon, and the gradual filling up of the states in the middle of the country.
By the mid-20th century, the distribution of the population starts to resemble that of modern America.
Population Density Today
The average population density in the U.S. is now 92 people per square mile, although this changes dramatically based on where you are located:
If you are in Alaska, the state with the lowest population density, there is just one person per square mile – but if you’re in New York City there are 27,000 people per square mile, the highest of any major city in the country.


Misc
How Hard Is It to Get Into an Ivy League School?
We detail the admission rates and average annual cost for Ivy League schools, as well as the median SAT scores required to be accepted.


How Hard Is It to Get Into an Ivy League School?
This was originally posted on our Voronoi app. Download the app for free on iOS or Android and discover incredible data-driven charts from a variety of trusted sources.
Ivy League institutions are renowned worldwide for their academic excellence and long-standing traditions. But how hard is it to get into one of the top universities in the U.S.?
In this graphic, we detail the admission rates and average annual cost for Ivy League schools, as well as the median SAT scores required to be accepted. The data comes from the National Center for Education Statistics and was compiled by 24/7 Wall St.
Note that “average annual cost” represents the net price a student pays after subtracting the average value of grants and/or scholarships received.
Harvard is the Most Selective
The SAT is a standardized test commonly used for college admissions in the United States. It’s taken by high school juniors and seniors to assess their readiness for college-level academic work.
When comparing SAT scores, Harvard and Dartmouth are among the most challenging universities to gain admission to. The median SAT scores for their students are 760 for reading and writing and 790 for math. Still, Harvard has half the admission rate (3.2%) compared to Dartmouth (6.4%).
| School | Admission rate (%) | SAT Score: Reading & Writing | SAT Score: Math | Avg Annual Cost* |
|---|---|---|---|---|
| Harvard University | 3.2 | 760 | 790 | $13,259 |
| Columbia University | 3.9 | 750 | 780 | $12,836 |
| Yale University | 4.6 | 760 | 780 | $16,341 |
| Brown University | 5.1 | 760 | 780 | $26,308 |
| Princeton University | 5.7 | 760 | 780 | $11,080 |
| Dartmouth College | 6.4 | 760 | 790 | $33,023 |
| University of Pennsylvania | 6.5 | 750 | 790 | $14,851 |
| Cornell University | 7.5 | 750 | 780 | $29,011 |
*Costs after receiving federal financial aid.
Additionally, Dartmouth has the highest average annual cost at $33,000. Princeton has the lowest at $11,100.
While student debt has surged in the United States in recent years, hitting $1.73 trillion in 2023, the worth of obtaining a degree from any of the schools listed surpasses mere academics. This is evidenced by the substantial incomes earned by former students.
Harvard grads, for example, have the highest average starting salary in the country, at $91,700.

-

 Mining2 weeks ago
Charted: The Value Gap Between the Gold Price and Gold Miners
-

 Real Estate1 week ago
Ranked: The Most Valuable Housing Markets in America
-

 Business1 week ago
Charted: Big Four Market Share by S&P 500 Audits
-

 AI1 week ago
The Stock Performance of U.S. Chipmakers So Far in 2024
-

 Misc1 week ago
Almost Every EV Stock is Down After Q1 2024
-

 Money2 weeks ago
Where Does One U.S. Tax Dollar Go?
-

 Green2 weeks ago
Ranked: Top Countries by Total Forest Loss Since 2001
-

 Real Estate2 weeks ago
Visualizing America’s Shortage of Affordable Homes