Energy
Visualized: How Much Do EV Batteries Cost?
![]() Subscribe to the Elements free mailing list for more like this
Subscribe to the Elements free mailing list for more like this
How Much Do EV Batteries Cost?
This was originally posted on Elements. Sign up to the free mailing list to get beautiful visualizations on natural resource megatrends in your email every other week.
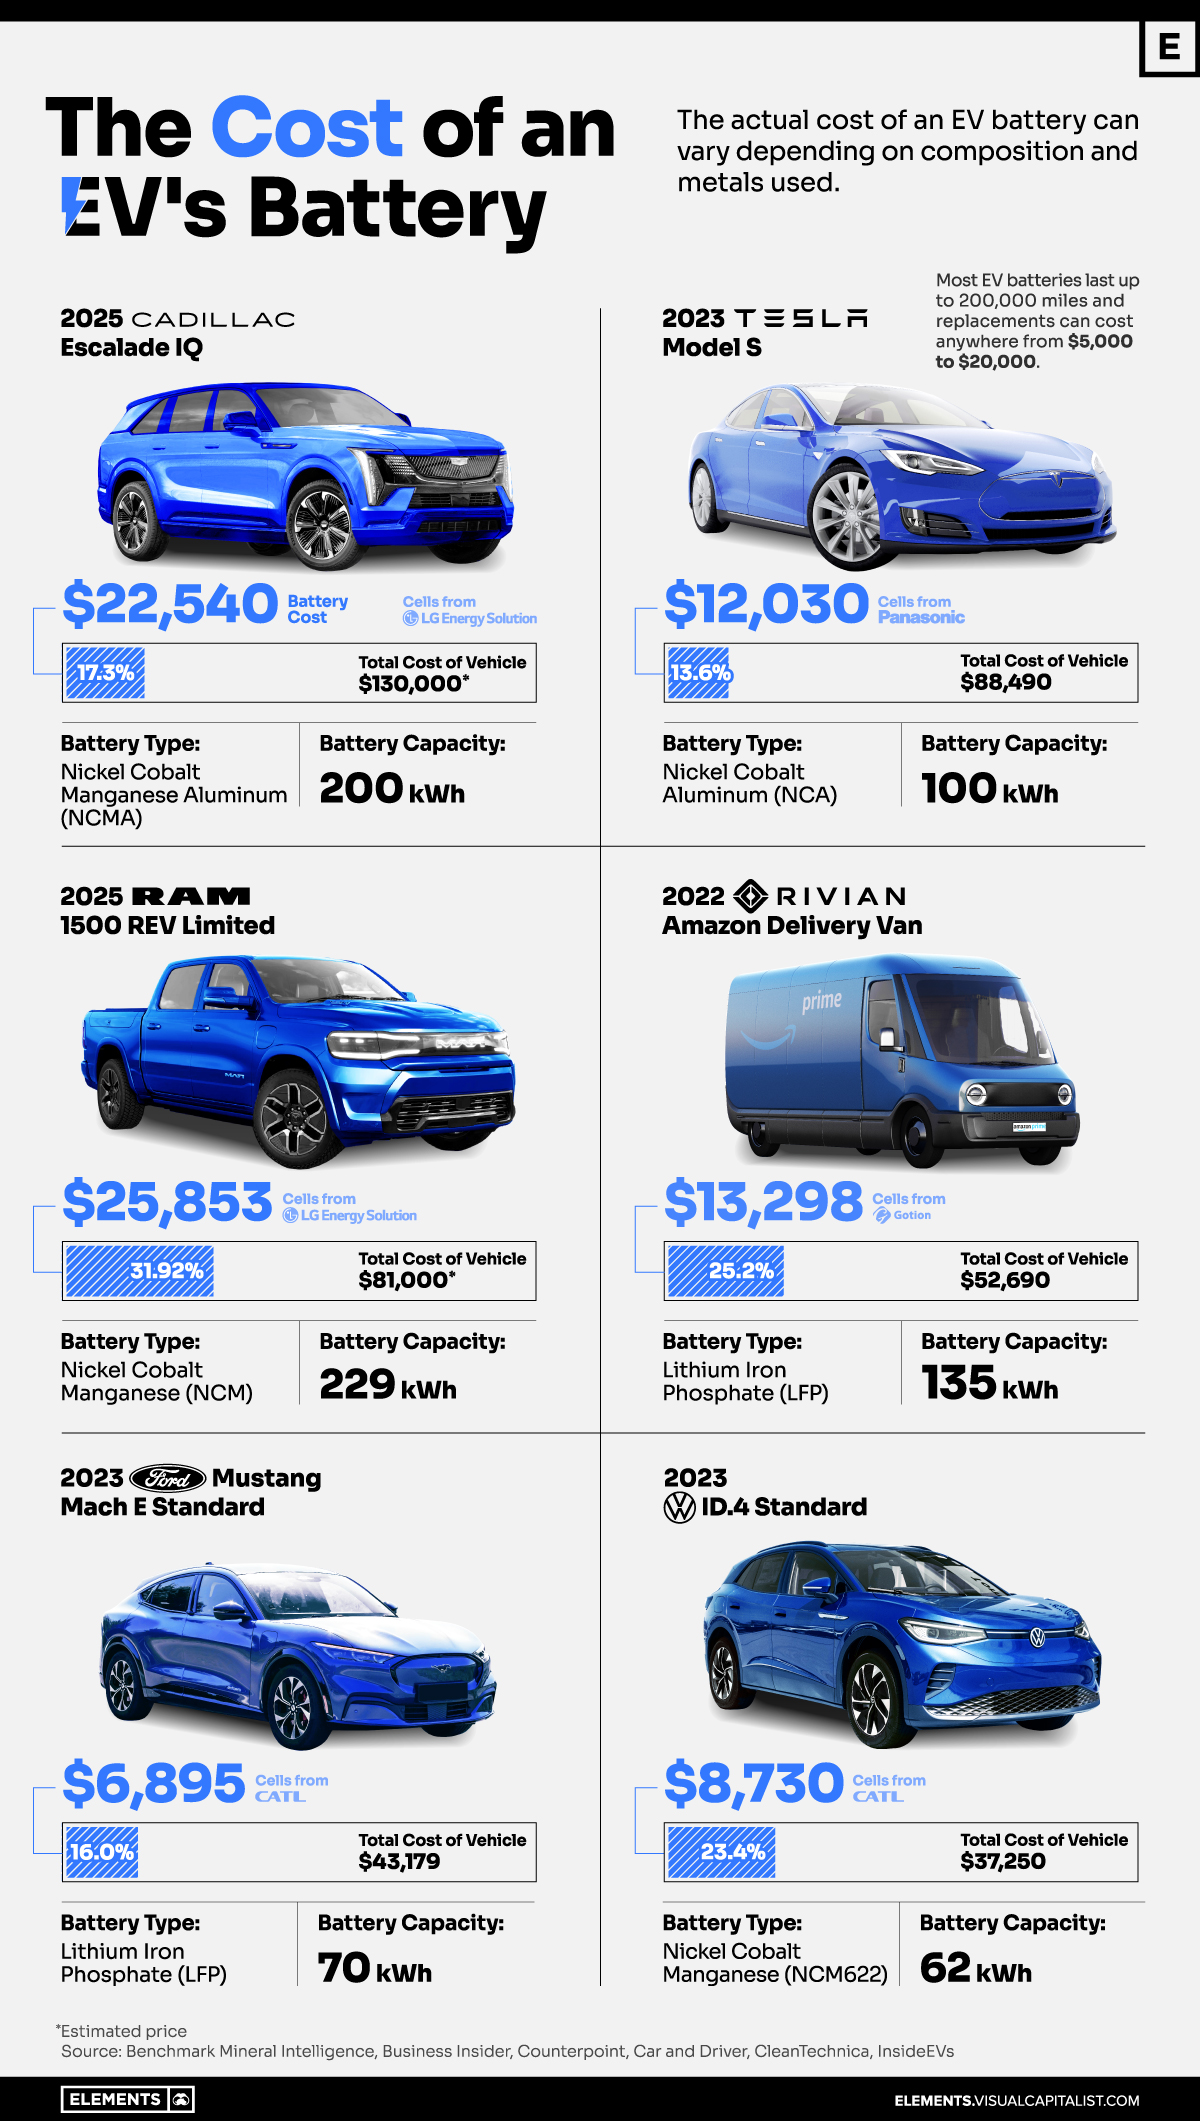
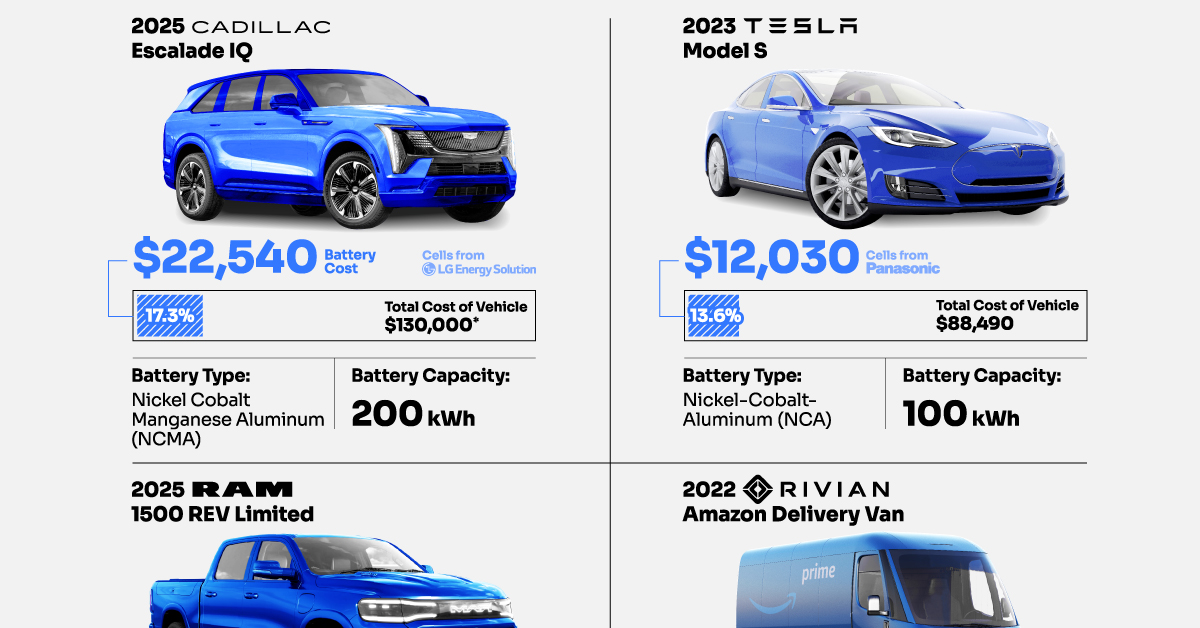
The cost of an electric vehicle (EV) battery pack can vary depending on composition and chemistry.
In this graphic, we use data from Benchmark Minerals Intelligence to showcase the different costs of battery cells on popular electric vehicles.
Size Matters
Some EV owners are taken by surprise when they discover the cost of replacing their batteries.
Depending on the brand and model of the vehicle, the cost of a new lithium-ion battery pack might be as high as $25,000:
| Vehicle | Battery Type | Battery Capacity | Battery Cost | Total Cost of EV |
|---|---|---|---|---|
| 2025 Cadillac Escalade IQ | Nickel Cobalt Manganese Aluminum (NCMA) | 200 kWh | $22,540 | $130,000 |
| 2023 Tesla Model S | Nickel Cobalt Aluminum (NCA) | 100 kWh | $12,030 | $88,490 |
| 2025 RAM 1500 REV | Nickel Cobalt Manganese (NCM) | 229 kWh | $25,853 | $81,000 |
| 2022 Rivian Delivery Van | Lithium Iron phosphate (LFP) | 135 kWh | $13,298 | $52,690 |
| 2023 Ford Mustang | Lithium Iron Phosphate (LFP) | 70 kWh | $6,895 | $43,179 |
| 2023 VW ID.4 | Nickel Cobalt Manganese (NCM622) | 62 kWh | $8,730 | $37,250 |
The price of an EV battery pack can be shaped by various factors such as raw material costs, production expenses, packaging complexities, and supply chain stability. One of the main factors is chemical composition.
Graphite is the standard material used for the anodes in most lithium-ion batteries.
However, it is the mineral composition of the cathode that usually changes. It includes lithium and other minerals such as nickel, manganese, cobalt, or iron. This specific composition is pivotal in establishing the battery’s capacity, power, safety, lifespan, cost, and overall performance.
Lithium nickel cobalt aluminum oxide (NCA) battery cells have an average price of $120.3 per kilowatt-hour (kWh), while lithium nickel cobalt manganese oxide (NCM) has a slightly lower price point at $112.7 per kWh. Both contain significant nickel proportions, increasing the battery’s energy density and allowing for longer range.
At a lower cost are lithium iron phosphate (LFP) batteries, which are cheaper to make than cobalt and nickel-based variants. LFP battery cells have an average price of $98.5 per kWh. However, they offer less specific energy and are more suitable for standard- or short-range EVs.
Which Battery Dominates the EV Market?
In 2021, the battery market was dominated by NCM batteries, with 58% of the market share, followed by LFP and NCA, holding 21% each.
Looking ahead to 2026, the market share of LFP is predicted to nearly double, reaching 38%.
NCM is anticipated to constitute 45% of the market and NCA is expected to decline to 7%.


Energy
Mapped: The Age of Energy Projects in Interconnection Queues, by State
This map shows how many energy projects are in interconnection queues by state and how long these projects have been queued up, on average.


Age of Energy Projects in Interconnection Queues, by State
This was originally posted on our Voronoi app. Download the app for free on iOS or Android and discover incredible data-driven charts from a variety of trusted sources.
By the end of 2023, more than 11,000 energy projects were in interconnection queues in the United States, waiting for a green-light from regional grid operators to proceed with construction.
This map, created in partnership with the National Public Utilities Council, maps out the average age of active energy projects in interconnection queues by state, using data from Berkeley Lab.
Interconnection Queues, Explained
Interconnection queues are lists of energy projects that have made interconnection requests to their regional grid operators. Once submitted, these requests formally initiate the impact study process that each project goes through before grid connection, forming waiting lists for approval known as interconnection queues.
In recent years, both the number and generation capacity of queued projects have surged in the United States, along with the length of time spent in queue.
According to Berkeley Lab, the amount of generation capacity entering queues each year has risen by more than 550% from 2015 to 2023, with average queue duration rising from 3 years to 5 years the same period.
As a result of the growing backlog, a large proportion of projects ultimately withdraw from queues, leading to only 19% of applications reaching commercial operations.
The Backlog: Number of Projects and Average Wait Times
Of the 11,000 active projects in U.S. queues at the end of 2023, Texas, California, and Virginia had the most in queue; 1,208, 947, and 743, respectively.
When looking at the average ages of these projects, all three states hovered around the national average of 34 months (2.83 years), with Texas sporting 28 months, California 33, and Virginia 34.
Vermont, Minnesota, Wisconsin, and Florida, on the other hand, had the highest average queue durations; 54, 49, 47, and 46 months, respectively.
Average Queue Duration by Project Type
At the end of 2023, more than 95% of the generation capacity in active interconnection queues was for emission-free resources. The table below provides a breakdown.
| Project Type | Average Queue Duration (As of 12/31/2023) | Number of Projects in Queue |
|---|---|---|
| Wind | 40 months | 841 |
| Solar | 34 months | 4,506 |
| Wind+Battery | 34 months | 76 |
| Solar+Battery | 27 months | 2,377 |
| Battery | 24 months | 2,818 |
Wind projects had the highest wait times at the end of 2023 with an average age of 40 months (3.33 years). Solar projects, on the other hand, made up more than 40% of projects in queue.
Overall, reducing the time that these renewable energy projects spend in queues can accelerate the transition to a low-carbon energy future.
According to the U.S. Department of Energy, enhancing data transparency, streamlining approval processes, promoting economic efficiency, and maintaining a reliable grid are some of the ways this growing backlog can be mitigated.

-

 Technology7 days ago
All of the Grants Given by the U.S. CHIPS Act
-

 Misc2 weeks ago
How Hard Is It to Get Into an Ivy League School?
-

 Debt2 weeks ago
How Debt-to-GDP Ratios Have Changed Since 2000
-

 Sports2 weeks ago
The Highest Earning Athletes in Seven Professional Sports
-

 Science2 weeks ago
Visualizing the Average Lifespans of Mammals
-

 Brands1 week ago
How Tech Logos Have Evolved Over Time
-

 Energy1 week ago
Ranked: The Top 10 EV Battery Manufacturers in 2023
-

 Demographics1 week ago
Countries With the Largest Happiness Gains Since 2010