Markets
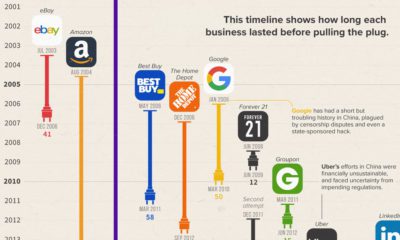
The Dominance of U.S. Companies in Global Markets
U.S. Companies Dominate Global Markets
Are global indexes as “global” as you think they are?
With the aim of tracking market performance around the world, these indexes incorporate securities from various regions. However, while the number of securities may be relatively well diversified across countries, a dollar perspective tells a different story. When market capitalization is taken into account, country weightings may become much more unbalanced.
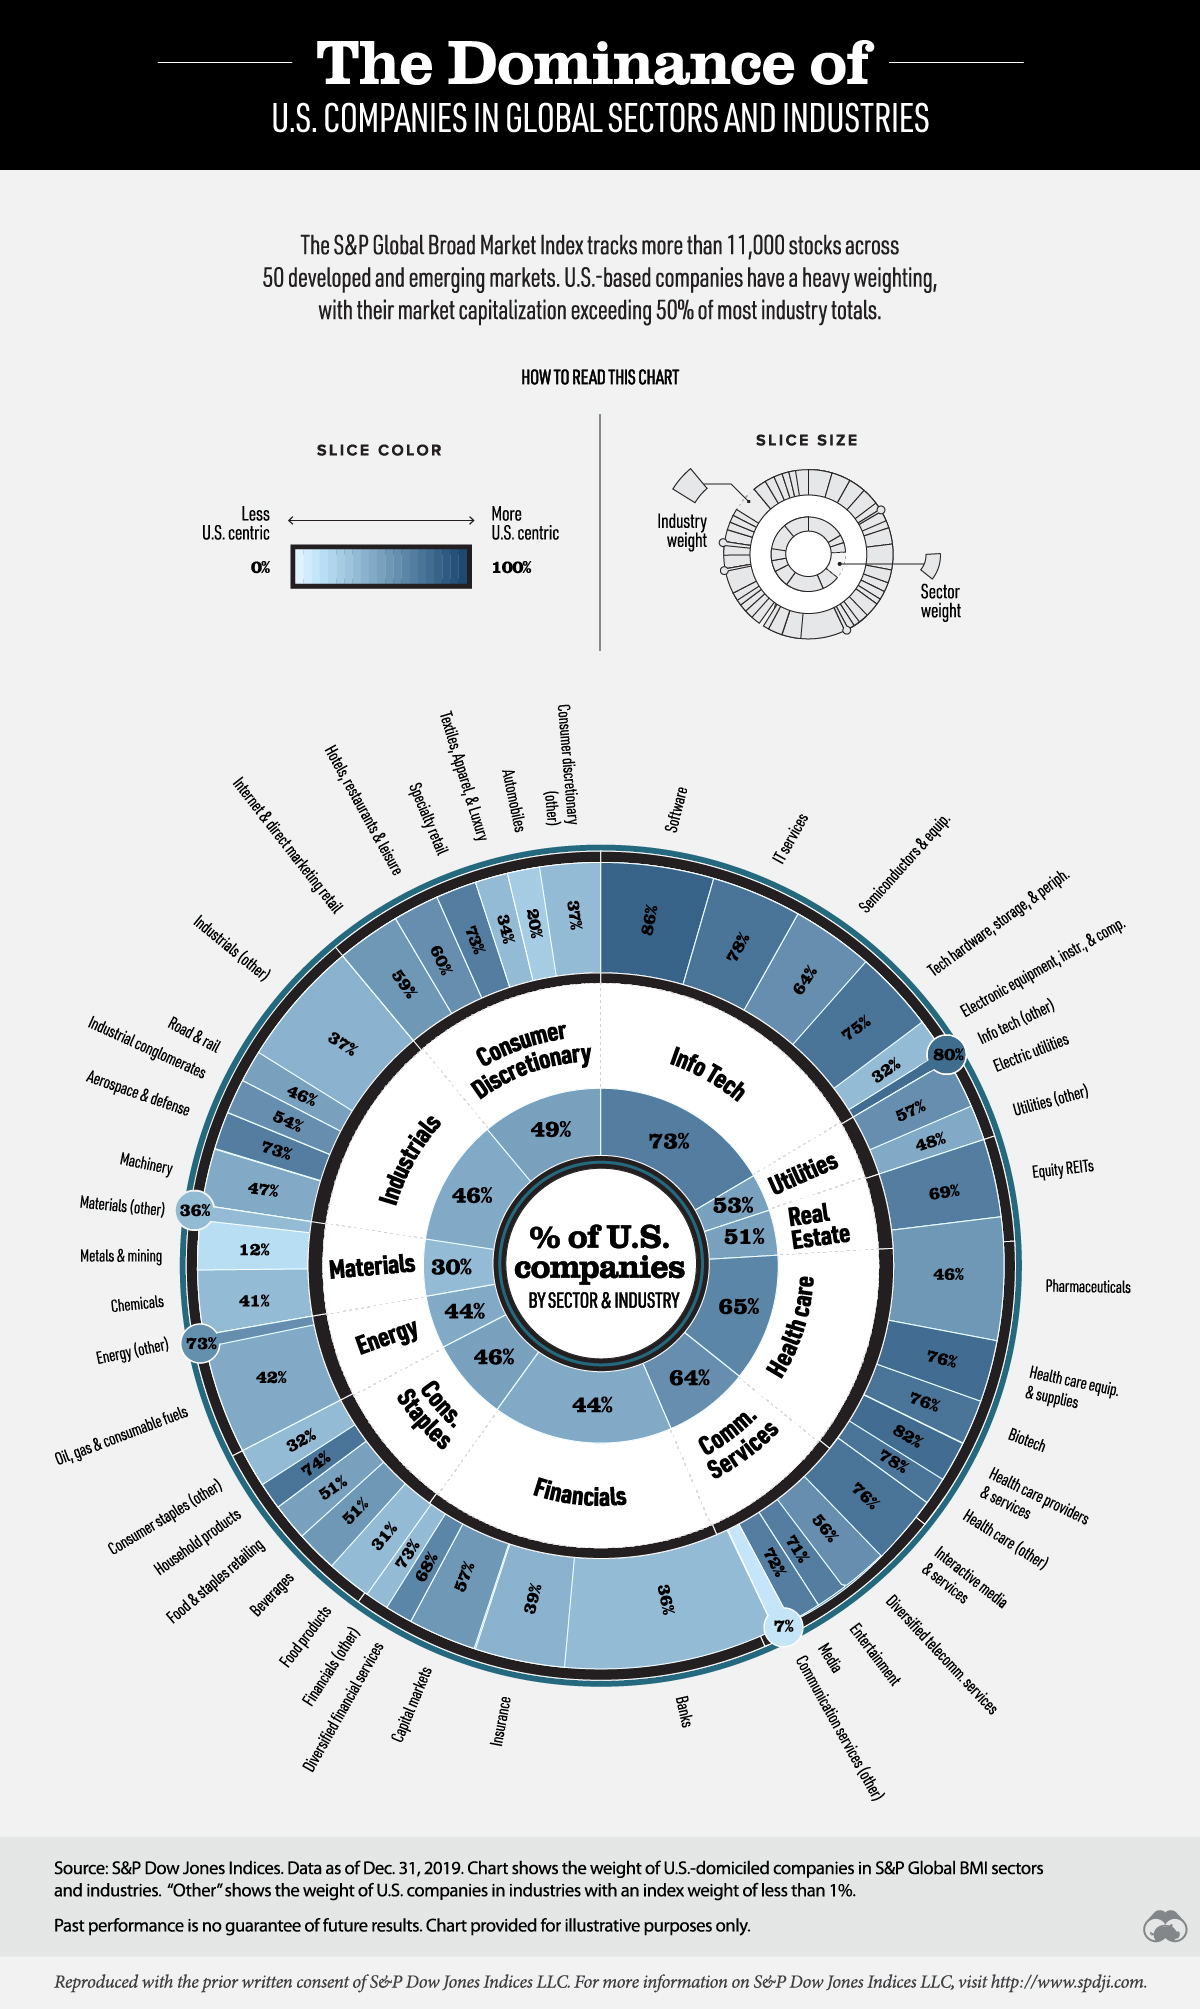
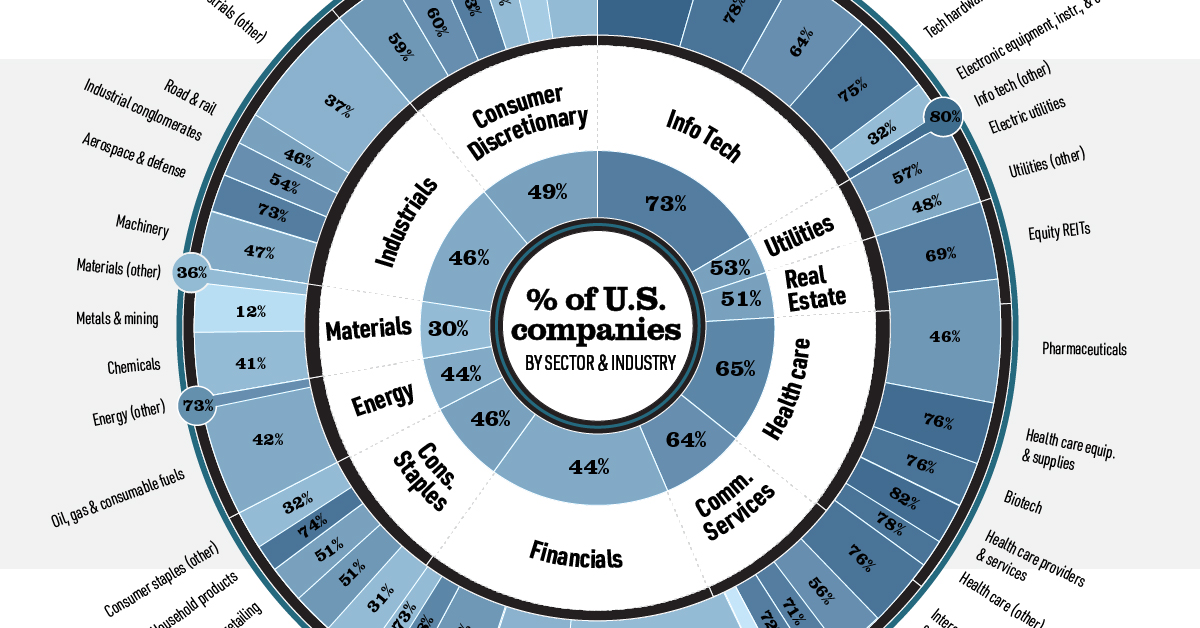
Today’s visualization is based on a concept by S&P Dow Jones Indices that shows the percentage of U.S.-based companies in global sectors and industries as of December 31, 2019. The calculations reflect the market capitalization of companies in the S&P Global Broad Market Index (BMI), an index that tracks over 11,000 stocks across 50 developed and emerging economies.
Percentage of U.S. Companies by Sector
U.S-based companies—those that maintain their primary business affairs in the U.S.—are a major component of many global sectors and industries.
Here’s how it breaks down:
| Sector | % of U.S.-based Companies | Most U.S.-heavy Subsector |
|---|---|---|
| Information technology | 73% | Software (86%) |
| Health care | 65% | Health care providers (82%) |
| Utilities | 53% | Electric utilities (57%) |
| Real estate | 51% | Equity REITs (69%) |
| Consumer discretionary | 49% | Specialty retail (73%) |
| Consumer staples | 46% | Household products (74%) |
| Industrials | 46% | Aerospace & defense (73%) |
| Energy | 44% | Energy - other (73%) |
| Financials | 44% | Financials - other (73%) |
| Materials | 30% | Chemicals (41%) |
U.S.-based companies make up a staggering 73% of the information technology (IT) sector. However, China may soon threaten this dominance. The Made in China 2025 plan highlights new-generation IT as a priority sector for the country.
The U.S. is still the world’s leader, but China is coming up very fast.
—Rebecca Fannin, Journalist & Author of Tech Titans of China
Healthcare is also heavily skewed towards U.S-based stocks, which make up 65% of the sector’s market capitalization. This weighting is perhaps not surprising given the success of many U.S. healthcare companies. In Fortune’s list of the 500 most profitable U.S. companies, 41 healthcare organizations made the cut.
The materials sector has the smallest weighting of U.S.-based stocks, but they still account for almost one-third of the overall market capitalization. Three American companies are in the sector’s top 10 holdings: Air Products & Chemicals, Ecolab, and Sherwin-Williams.
U.S. Equity Views in a Global Context
Given the high weighting of U.S. stocks in global sectors and industries, having a U.S. view is important. This refers to investors gaining a clear perspective on the risks and opportunities that exist in the country. Investors can consider the trends influencing American companies in order to help explain stock performance.
U.S. stock dominance also impacts geographic diversification. While it helps non-U.S. investors overcome their home bias, American investors may want to consider targeting specific international markets for well-rounded exposure.


Markets
U.S. Debt Interest Payments Reach $1 Trillion
U.S. debt interest payments have surged past the $1 trillion dollar mark, amid high interest rates and an ever-expanding debt burden.


U.S. Debt Interest Payments Reach $1 Trillion
This was originally posted on our Voronoi app. Download the app for free on iOS or Android and discover incredible data-driven charts from a variety of trusted sources.
The cost of paying for America’s national debt crossed the $1 trillion dollar mark in 2023, driven by high interest rates and a record $34 trillion mountain of debt.
Over the last decade, U.S. debt interest payments have more than doubled amid vast government spending during the pandemic crisis. As debt payments continue to soar, the Congressional Budget Office (CBO) reported that debt servicing costs surpassed defense spending for the first time ever this year.
This graphic shows the sharp rise in U.S. debt payments, based on data from the Federal Reserve.
A $1 Trillion Interest Bill, and Growing
Below, we show how U.S. debt interest payments have risen at a faster pace than at another time in modern history:
| Date | Interest Payments | U.S. National Debt |
|---|---|---|
| 2023 | $1.0T | $34.0T |
| 2022 | $830B | $31.4T |
| 2021 | $612B | $29.6T |
| 2020 | $518B | $27.7T |
| 2019 | $564B | $23.2T |
| 2018 | $571B | $22.0T |
| 2017 | $493B | $20.5T |
| 2016 | $460B | $20.0T |
| 2015 | $435B | $18.9T |
| 2014 | $442B | $18.1T |
| 2013 | $425B | $17.2T |
| 2012 | $417B | $16.4T |
| 2011 | $433B | $15.2T |
| 2010 | $400B | $14.0T |
| 2009 | $354B | $12.3T |
| 2008 | $380B | $10.7T |
| 2007 | $414B | $9.2T |
| 2006 | $387B | $8.7T |
| 2005 | $355B | $8.2T |
| 2004 | $318B | $7.6T |
| 2003 | $294B | $7.0T |
| 2002 | $298B | $6.4T |
| 2001 | $318B | $5.9T |
| 2000 | $353B | $5.7T |
| 1999 | $353B | $5.8T |
| 1998 | $360B | $5.6T |
| 1997 | $368B | $5.5T |
| 1996 | $362B | $5.3T |
| 1995 | $357B | $5.0T |
| 1994 | $334B | $4.8T |
| 1993 | $311B | $4.5T |
| 1992 | $306B | $4.2T |
| 1991 | $308B | $3.8T |
| 1990 | $298B | $3.4T |
| 1989 | $275B | $3.0T |
| 1988 | $254B | $2.7T |
| 1987 | $240B | $2.4T |
| 1986 | $225B | $2.2T |
| 1985 | $219B | $1.9T |
| 1984 | $205B | $1.7T |
| 1983 | $176B | $1.4T |
| 1982 | $157B | $1.2T |
| 1981 | $142B | $1.0T |
| 1980 | $113B | $930.2B |
| 1979 | $96B | $845.1B |
| 1978 | $84B | $789.2B |
| 1977 | $69B | $718.9B |
| 1976 | $61B | $653.5B |
| 1975 | $55B | $576.6B |
| 1974 | $50B | $492.7B |
| 1973 | $45B | $469.1B |
| 1972 | $39B | $448.5B |
| 1971 | $36B | $424.1B |
| 1970 | $35B | $389.2B |
| 1969 | $30B | $368.2B |
| 1968 | $25B | $358.0B |
| 1967 | $23B | $344.7B |
| 1966 | $21B | $329.3B |
Interest payments represent seasonally adjusted annual rate at the end of Q4.
At current rates, the U.S. national debt is growing by a remarkable $1 trillion about every 100 days, equal to roughly $3.6 trillion per year.
As the national debt has ballooned, debt payments even exceeded Medicaid outlays in 2023—one of the government’s largest expenditures. On average, the U.S. spent more than $2 billion per day on interest costs last year. Going further, the U.S. government is projected to spend a historic $12.4 trillion on interest payments over the next decade, averaging about $37,100 per American.
Exacerbating matters is that the U.S. is running a steep deficit, which stood at $1.1 trillion for the first six months of fiscal 2024. This has accelerated due to the 43% increase in debt servicing costs along with a $31 billion dollar increase in defense spending from a year earlier. Additionally, a $30 billion increase in funding for the Federal Deposit Insurance Corporation in light of the regional banking crisis last year was a major contributor to the deficit increase.
Overall, the CBO forecasts that roughly 75% of the federal deficit’s increase will be due to interest costs by 2034.

-

 Real Estate2 weeks ago
Visualizing America’s Shortage of Affordable Homes
-

 Technology1 week ago
Ranked: Semiconductor Companies by Industry Revenue Share
-

 Money1 week ago
Which States Have the Highest Minimum Wage in America?
-

 Real Estate1 week ago
Ranked: The Most Valuable Housing Markets in America
-

 Business2 weeks ago
Charted: Big Four Market Share by S&P 500 Audits
-

 AI2 weeks ago
The Stock Performance of U.S. Chipmakers So Far in 2024
-

 Misc2 weeks ago
Almost Every EV Stock is Down After Q1 2024
-

 Money2 weeks ago
Where Does One U.S. Tax Dollar Go?