Energy
Tracking the Growing Wave of Oil & Gas Bankruptcies in 2020


The Growing Wave of Oil & Gas Bankruptcies in 2020
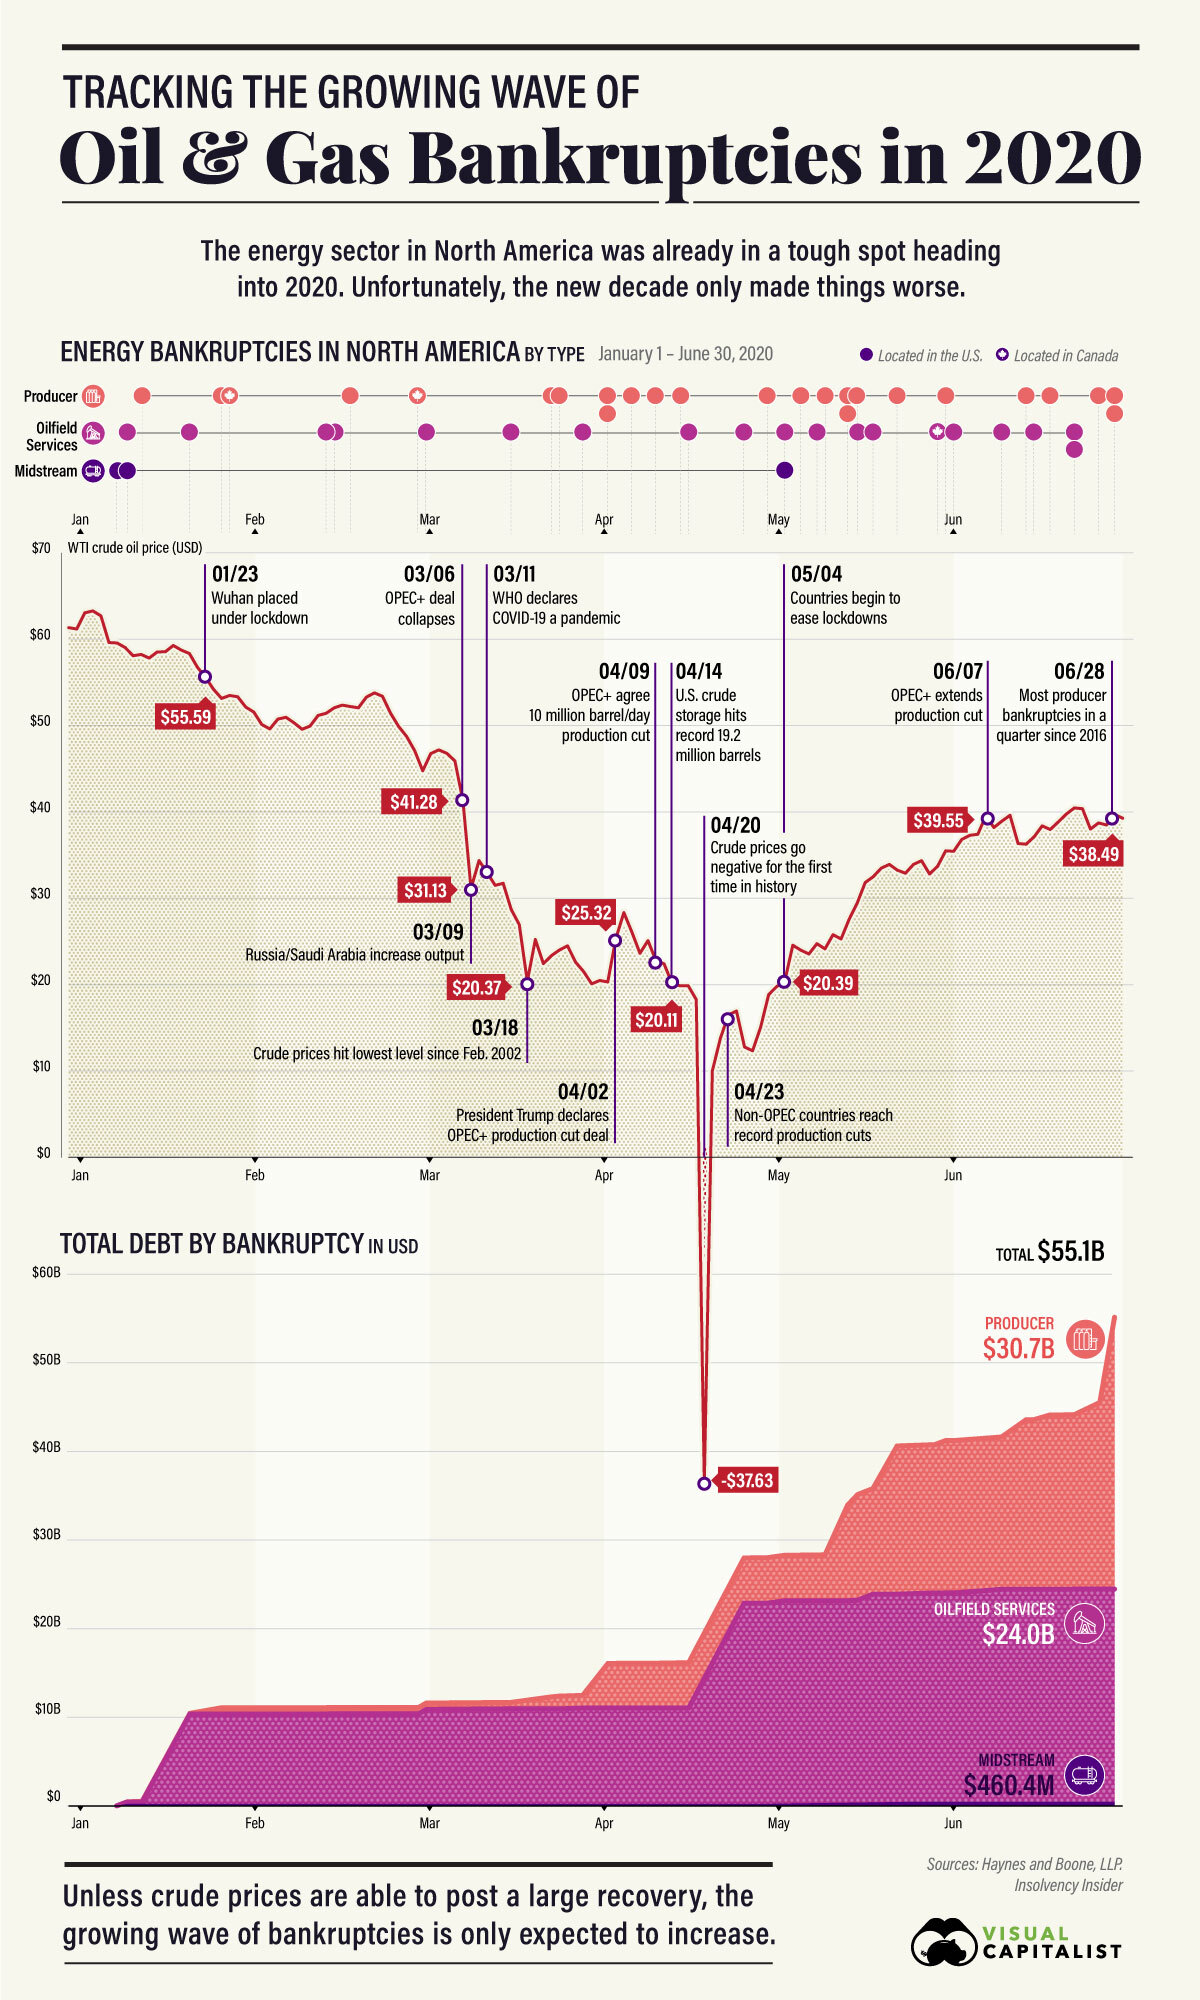
2020 hasn’t been kind to the energy sector, and a growing wave of energy bankruptcies has started to build.
After a difficult year marred by rising geopolitical tensions in the Middle East and crude prices in the $50-60 per barrel range, analysts warned that the energy sector needed a strong recovery to offset a rising (and expiring) mountain of debt.
Instead, the oil patch has seen one bombshell after another, and the impacts are adding up.
Fueling the Wave’s Growth
The new year opened with a U.S. attack on a top-ranking Iranian general in Baghdad, followed by an Iranian counterattack on two bases in Iraq that hosted U.S. military personnel.
Then, the energy industry worried that the Organization of the Petroleum Exporting Countries (OPEC) wouldn’t renew its production deal with non-member countries, causing increased production and negative pressure on crude prices.
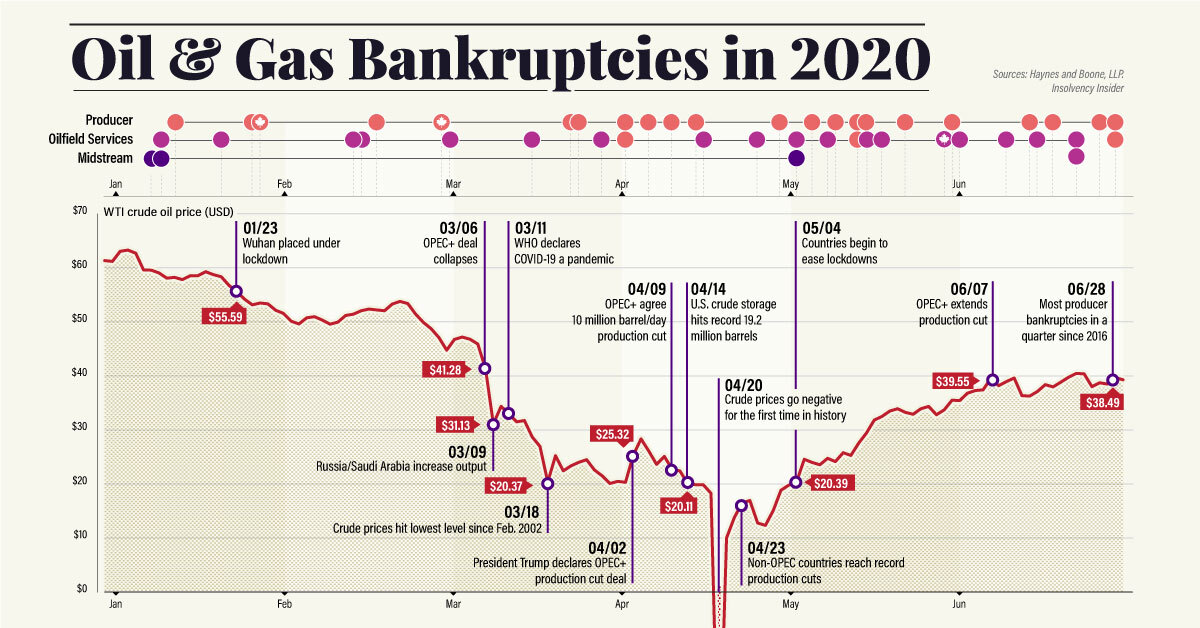
All the while, the threat of COVID-19 grew and started to spread. In March, the new coronavirus hit markets hardest, right as the OPEC+ deal collapsed. Russia and Saudi Arabia subsequently flooded the markets with cheap oil, starting a price war to drive out competition.
What developed was the perfect storm of nonexistent demand matched up against oversupply. Crude prices plummeted and hit a historic sub-zero low on April 20th, with futures for West Texas Intermediate (WTI) Crude closing at -$37.63.
The Wave’s Initial Damage
Now, following a renewed OPEC+ deal limiting production agreed upon on April 9th and slowly restarting economies driving up crude demand, prices have started to tick up.
Unfortunately, the damage has already been done and will take a long time to recover. By charting the sector’s bankruptcies over the first half of 2020—tracked by law firm Haynes and Boone, LLP for the U.S. and Insolvency Insider for Canada—we can see the wave start to swell:
| Company Type | Q1 Bankruptcies | Q2 Bankruptcies | Total (H1 2020) |
|---|---|---|---|
| Oil & Gas Producer | 7 | 18 | 25 |
| Oilfield Services | 7 | 12 | 19 |
| Midstream Services | 2 | 1 | 3 |
| Total | 16 | 31 | 47 |
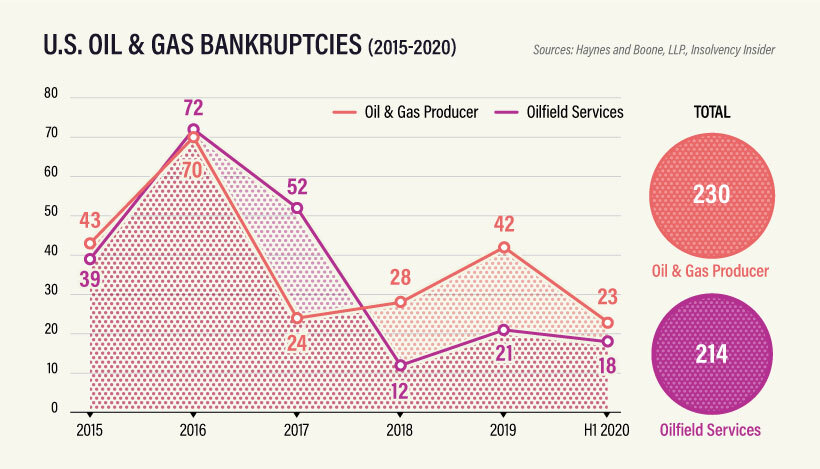
For oil and gas producers, the second quarter of 2020 saw 18 bankruptcies, the highest quarterly total since 2016.
So far, they’re largely centered in the U.S., which saw a boom of surface-level shale oil production in the 2010’s to take advantage of rising crude prices. As prices have dropped, many heavily leveraged companies have started to run out of options.
| Company Type | Q1 Total Debt | Q2 Total Debt | Total (H1 2020) |
|---|---|---|---|
| Oil & Gas Producer | $1.4 billion | $29.2 billion | $30.7 billion |
| Oilfield Services | $10.8 billion | $13.2 billion | $24 billion |
| Midstream Services | $0.2 billion | $0.2 billion | $0.5 billion |
| Total | $12.5 billion | $42.7 billion | $55.1 billion |
The biggest victim in the first half of 2020 was Chesapeake Energy, a shale giant that declared bankruptcy on June 28 with more than $9 billion in debt.
Canada has also seen an uptick in energy bankruptcies, especially after facing years of stiff competition from U.S. shale producers. However, the number of cases in Canada is far fewer than in the United States.
One reason is that companies staved off bankruptcy or receivership in four of the seven insolvency cases in Canada since January 2020, at least temporarily. Instead, they are seeking protection under the country’s Companies’ Creditors Arrangement Act, giving them a chance to restructure and avoid insolvency.
A Prolonged Fallout
Another reason for the discrepancy in bankruptcy numbers is timing. The energy sector faced its biggest challenges in 2015/2016, causing many companies to take on debt.
Unfortunately, much of that debt is starting to expire, or becoming too difficult to pay off in the current market conditions.
That’s why, despite the wave of bankruptcies caused by COVID-19 gaining steam, the wave will continue well into 2020 and likely beyond.
July has already seen more companies declaring bankruptcy or seeking creditor protection. The question is, how many more are waiting to surface?


Lithium
Ranked: The Top 10 EV Battery Manufacturers in 2023
Asia dominates this ranking of the world’s largest EV battery manufacturers in 2023.


The Top 10 EV Battery Manufacturers in 2023
This was originally posted on our Voronoi app. Download the app for free on iOS or Android and discover incredible data-driven charts from a variety of trusted sources.
Despite efforts from the U.S. and EU to secure local domestic supply, all major EV battery manufacturers remain based in Asia.
In this graphic we rank the top 10 EV battery manufacturers by total battery deployment (measured in megawatt-hours) in 2023. The data is from EV Volumes.
Chinese Dominance
Contemporary Amperex Technology Co. Limited (CATL) has swiftly risen in less than a decade to claim the title of the largest global battery group.
The Chinese company now has a 34% share of the market and supplies batteries to a range of made-in-China vehicles, including the Tesla Model Y, SAIC’s MG4/Mulan, and various Li Auto models.
| Company | Country | 2023 Production (megawatt-hour) | Share of Total Production |
|---|---|---|---|
| CATL | 🇨🇳 China | 242,700 | 34% |
| BYD | 🇨🇳 China | 115,917 | 16% |
| LG Energy Solution | 🇰🇷 Korea | 108,487 | 15% |
| Panasonic | 🇯🇵 Japan | 56,560 | 8% |
| SK On | 🇰🇷 Korea | 40,711 | 6% |
| Samsung SDI | 🇰🇷 Korea | 35,703 | 5% |
| CALB | 🇨🇳 China | 23,493 | 3% |
| Farasis Energy | 🇨🇳 China | 16,527 | 2% |
| Envision AESC | 🇨🇳 China | 8,342 | 1% |
| Sunwoda | 🇨🇳 China | 6,979 | 1% |
| Other | - | 56,040 | 8% |
In 2023, BYD surpassed LG Energy Solution to claim second place. This was driven by demand from its own models and growth in third-party deals, including providing batteries for the made-in-Germany Tesla Model Y, Toyota bZ3, Changan UNI-V, Venucia V-Online, as well as several Haval and FAW models.
The top three battery makers (CATL, BYD, LG) collectively account for two-thirds (66%) of total battery deployment.
Once a leader in the EV battery business, Panasonic now holds the fourth position with an 8% market share, down from 9% last year. With its main client, Tesla, now sourcing batteries from multiple suppliers, the Japanese battery maker seems to be losing its competitive edge in the industry.
Overall, the global EV battery market size is projected to grow from $49 billion in 2022 to $98 billion by 2029, according to Fortune Business Insights.

-

 Travel1 week ago
Airline Incidents: How Do Boeing and Airbus Compare?
-

 Markets3 weeks ago
Visualizing America’s Shortage of Affordable Homes
-

 Green2 weeks ago
Ranked: Top Countries by Total Forest Loss Since 2001
-

 Money2 weeks ago
Where Does One U.S. Tax Dollar Go?
-

 Misc2 weeks ago
Almost Every EV Stock is Down After Q1 2024
-

 AI2 weeks ago
The Stock Performance of U.S. Chipmakers So Far in 2024
-

 Markets2 weeks ago
Charted: Big Four Market Share by S&P 500 Audits
-

 Real Estate2 weeks ago
Ranked: The Most Valuable Housing Markets in America