Politics
Mapped: The Top Trading Partner of Every U.S. State
The Top Trading Partner of Every U.S. State
The U.S. is highly dependent—perhaps unsurprisingly—on Canada and Mexico for trade. The country’s top trading partner is Mexico, making up 14.8% of total trade.
However, the country’s neighbors to the north and south are not the only trade partners that U.S. states rely heavily upon. This map from HowMuch.net uses flags to show which country each U.S. state is importing the most from. Below, there is an additional graphic showing where each state is exporting the highest amount of goods and services to.
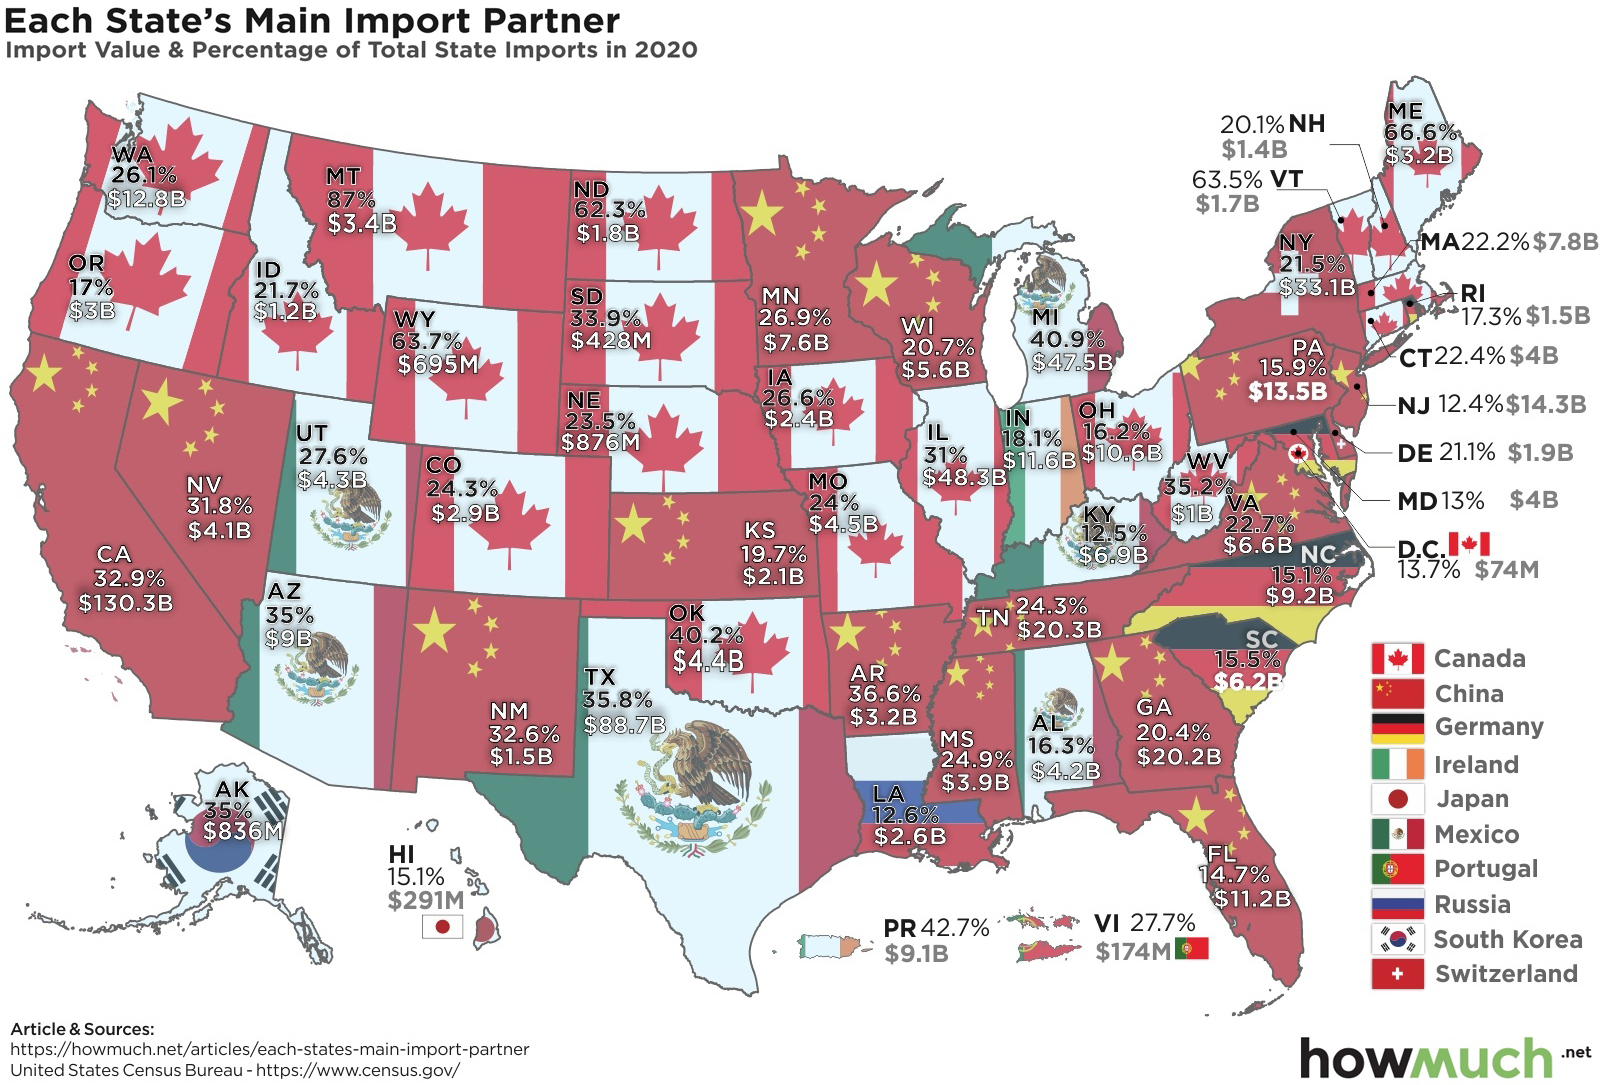
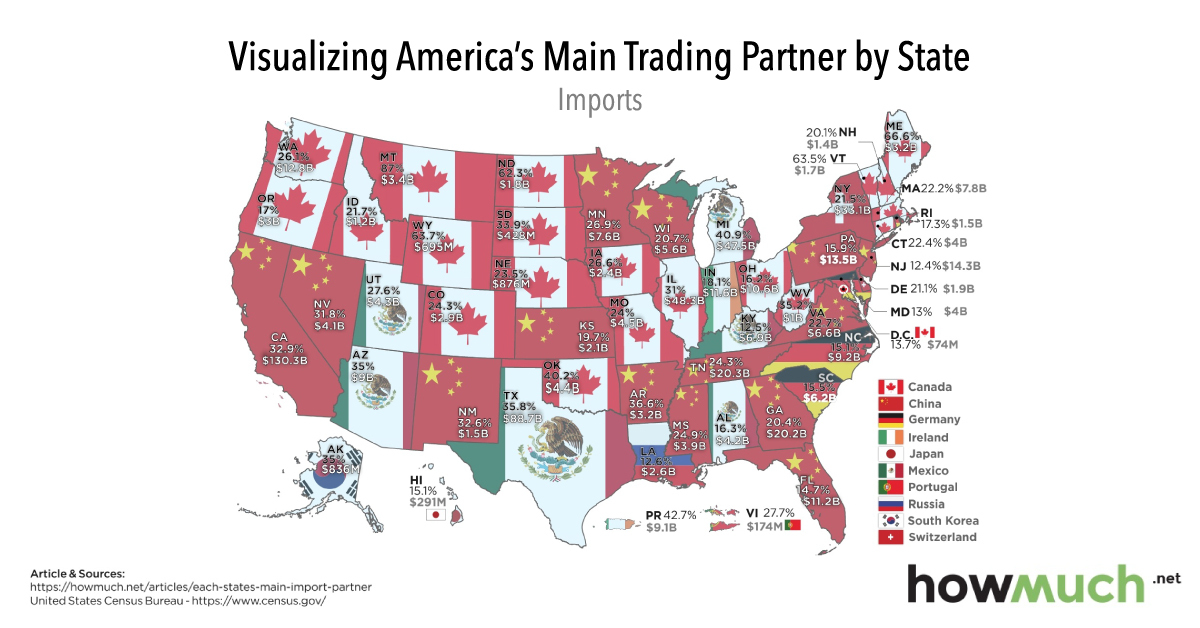
Who are the States Importing From?
The U.S. has a few natural and obvious trading partners, whether due to geographical closeness or strong economic ties.
The obvious candidates for top trading partners have already been mentioned, Canada and Mexico—and these two do show up at the state level as well. For example, Michigan gets 40.9% of its imports from Mexico, and Montana receives a whopping 87% of its imports from Canada.
Some other interesting trade partnerships stand out, like the Carolinas and Germany. Trade ties between Hawaii and Japan also make sense for historic reasons.
| State | Top Country | Total State Import (Millions USD) | Share of Total State Imports |
|---|---|---|---|
| Alabama | 🇲🇽 Mexico | $4,161 | 16.3% |
| Alaska | 🇰🇷 South Korea | $836 | 35.0% |
| Arizona | 🇲🇽 Mexico | $8,978 | 35.0% |
| Arkansas | 🇨🇳 China | $3,160 | 36.6% |
| California | 🇨🇳 China | $130,291 | 32.9% |
| Colorado | 🇨🇦 Canada | $2,928 | 24.3% |
| Connecticut | 🇨🇦 Canada | $4,031 | 22.4% |
| Delaware | 🇨🇭 Switzerland | $1,927 | 21.1% |
| District of Columbia | 🇨🇦 Canada | $74 | 13.7% |
| Florida | 🇨🇳 China | $11,212 | 14.7% |
| Georgia | 🇨🇳 China | $20,194 | 20.4% |
| Hawaii | 🇯🇵 Japan | $291 | 15.1% |
| Idaho | 🇨🇦 Canada | $1,195 | 21.7% |
| Illinois | 🇨🇳 China | $48,324 | 31.0% |
| Indiana | 🇮🇪 Ireland | $11,558 | 18.1% |
| Iowa | 🇨🇦 Canada | $2,387 | 26.6% |
| Kansas | 🇨🇳 China | $2,064 | 19.7% |
| Kentucky | 🇲🇽 Mexico | $6,882 | 12.5% |
| Louisiana | 🇷🇺 Russia | $2,611 | 12.6% |
| Maine | 🇨🇦 Canada | $3,167 | 66.6% |
| Maryland | 🇩🇪 Germany | $3,993 | 13.0% |
| Massachusetts | 🇨🇦 Canada | $7,779 | 22.2% |
| Michigan | 🇲🇽 Mexico | $47,473 | 40.9% |
| Minnesota | 🇨🇳 China | $7,577 | 26.9% |
| Mississippi | 🇨🇳 China | $3,938 | 24.9% |
| Missouri | 🇨🇦 Canada | $4,500 | 24.0% |
| Montana | 🇨🇦 Canada | $3,442 | 87.0% |
| Nebraska | 🇨🇦 Canada | $876 | 23.5% |
| Nevada | 🇨🇳 China | $4,108 | 31.8% |
| New Hampshire | 🇨🇦 Canada | $1,394 | 20.1% |
| New Jersey | 🇨🇳 China | $14,302 | 12.4% |
| New Mexico | 🇨🇳 China | $1,493 | 32.6% |
| New York | 🇨🇭 Switzerland | $33,126 | 21.5% |
| North Carolina | 🇩🇪 Germany | $9,208 | 15.1% |
| North Dakota | 🇨🇦 Canada | $1,781 | 62.3% |
| Ohio | 🇨🇦 Canada | $10,624 | 16.2% |
| Oklahoma | 🇨🇦 Canada | $4,355 | 40.2% |
| Oregon | 🇨🇦 Canada | $2,951 | 17.0% |
| Pennsylvania | 🇨🇳 China | $13,470 | 15.9% |
| Puerto Rico | 🇮🇪 Ireland | $9,062 | 42.7% |
| Rhode Island | 🇩🇪 Germany | $1,525 | 17.3% |
| South Carolina | 🇩🇪 Germany | $6,220 | 15.5% |
| South Dakota | 🇨🇦 Canada | $428 | 33.9% |
| Tennessee | 🇨🇳 China | $20,305 | 24.3% |
| Texas | 🇲🇽 Mexico | $88,726 | 35.8% |
| Utah | 🇲🇽 Mexico | $4,294 | 27.6% |
| Vermont | 🇨🇦 Canada | $1,677 | 63.5% |
| Virginia | 🇨🇳 China | $6,566 | 22.7% |
| Virgin Islands | 🇵🇹 Portugal | $174 | 27.7% |
| Washington | 🇨🇦 Canada | $12,772 | 26.1% |
| West Virginia | 🇨🇦 Canada | $1,025 | 35.2% |
| Wisconsin | 🇨🇳 China | $5,554 | 20.7% |
| Wyoming | 🇨🇦 Canada | $695 | 63.7% |
However, one country in particular stands out on this map—China.
While the USMCA trade agreement has created an easy gateway for necessary goods and services to flow across North America, no country—not even the U.S.—can escape the need for mass imports from the world’s top exporter.
China and the U.S. have an imbalanced trade relationship, with China buying much fewer goods from the U.S. than the U.S. buys from them. In fact, China’s monthly trade surplus with the country sat at $31.8 billion as of May 2021.
Who are the States Exporting to?
After looking at the top import partners by state, let’s dive in to where the U.S. states are exporting the most.
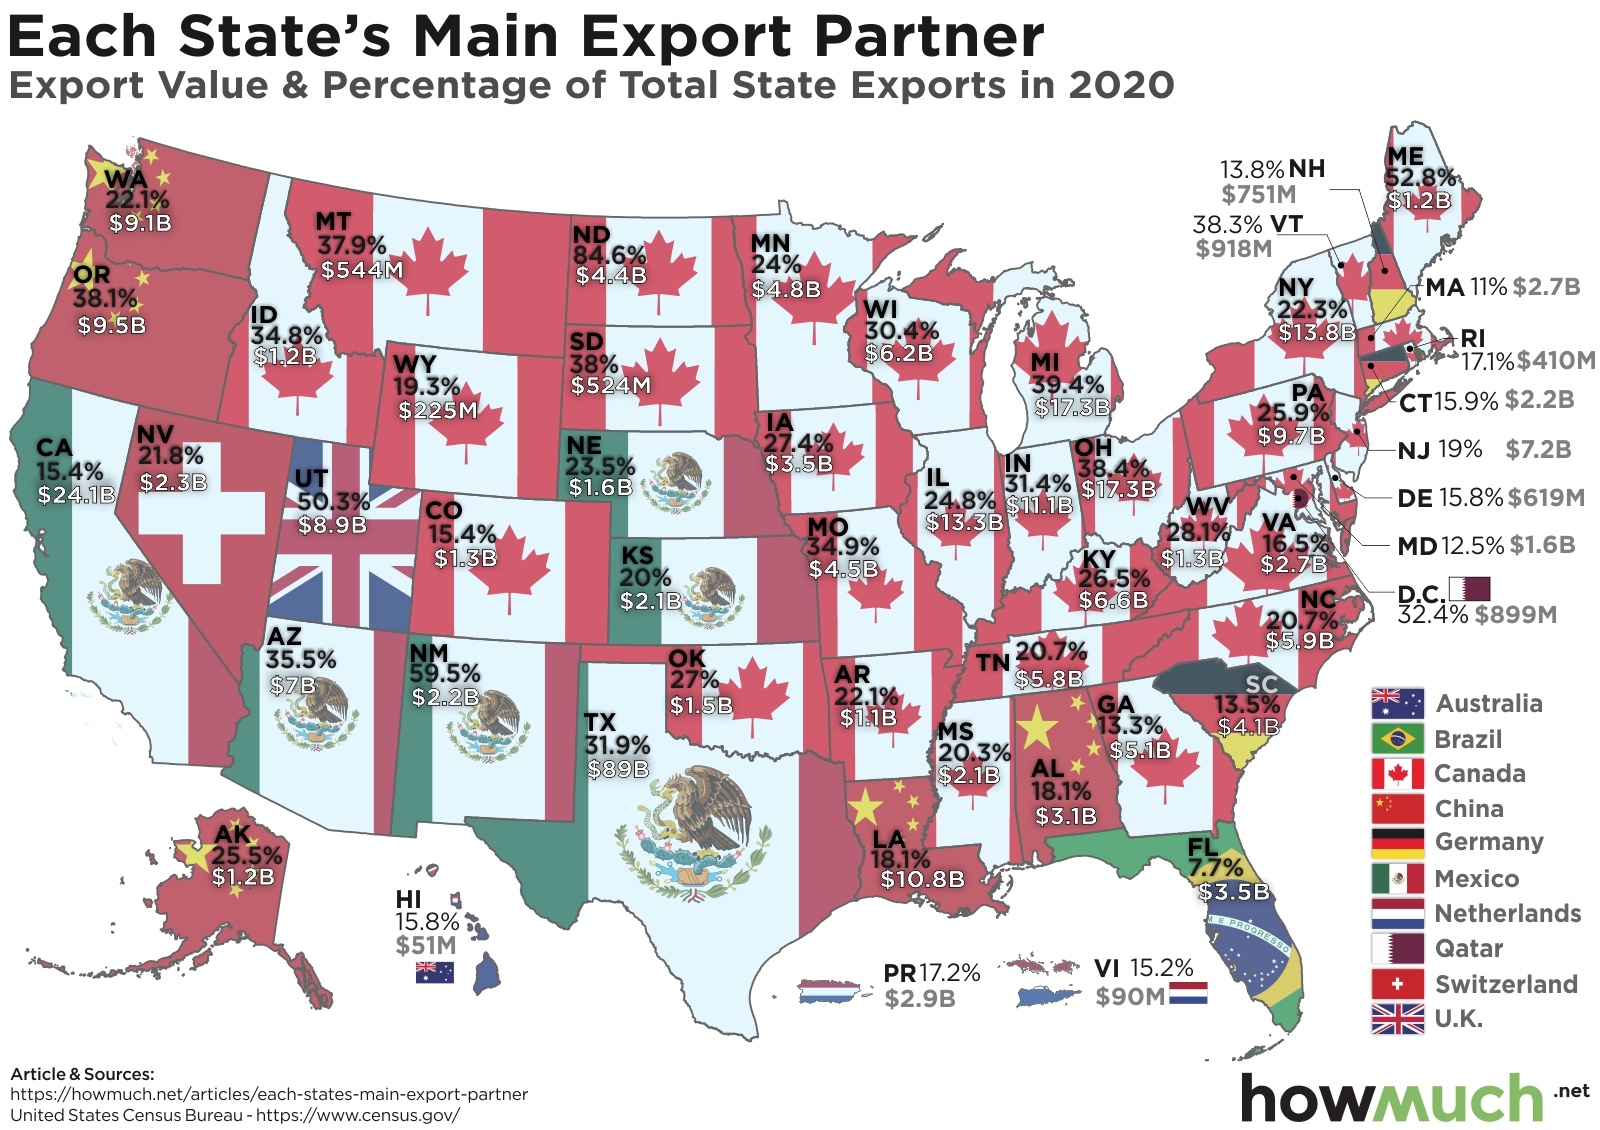
One thing that is noticeable is that China shows up much less on this map, further exemplifying the trade imbalance. In other words, while many states’ top import partner is China, they are not reciprocating as the country’s top export partner.
The only states that export their largest shares to China are:
- Oregon – 38.1%
- Alaska – 25.5%
- Washington – 22.1%
- Alabama – 18.1%
- Louisiana – 18.1%
The majority are exporting to their North American neighbors. For example, North Dakota sends 84.6% of its exports just across the northern border.
| State | Top Country | Total State Export (Millions USD) | Share of total State Exports |
|---|---|---|---|
| Alabama | 🇨🇳 China | $3,102 | 18.1% |
| Alaska | 🇨🇳 China | $1,176 | 25.5% |
| Arizona | 🇲🇽 Mexico | $36 | 35.5% |
| Arkansas | 🇨🇦 Canada | $1,148 | 22.1% |
| California | 🇲🇽 Mexico | $24,078 | 15.4% |
| Colorado | 🇨🇦 Canada | $1,278 | 15.4% |
| Connecticut | 🇩🇪 Germany | $2,189 | 15.9% |
| Delaware | 🇨🇦 Canada | $619 | 15.8% |
| D.C. | 🇶🇦 Qatar | $899 | 32.4% |
| Florida | 🇧🇷 Brazil | $3,538 | 7.7% |
| Georgia | 🇨🇦 Canada | $5,146 | 13.3% |
| Hawaii | 🇦🇺 Australia | $51 | 15.8% |
| Idaho | 🇨🇦 Canada | $1,184 | 34.8% |
| Illinois | 🇨🇦 Canada | $13,261 | 24.8% |
| Indiana | 🇨🇦 Canada | $11,080 | 31.4% |
| Iowa | 🇨🇦 Canada | $3,460 | 27.4% |
| Kansas | 🇲🇽 Mexico | $2,078 | 20.0% |
| Kentucky | 🇨🇦 Canada | $6,550 | 26.5% |
| Louisiana | 🇨🇳 China | $10,779 | 18.1% |
| Maine | 🇨🇦 Canada | $1,229 | 52.8% |
| Maryland | 🇨🇦 Canada | $1,581 | 12.5% |
| Massachusetts | 🇨🇦 Canada | $2,746 | 11.0% |
| Michigan | 🇨🇦 Canada | $17,341 | 39.4% |
| Minnesota | 🇨🇦 Canada | $4,828 | 24.0% |
| Mississippi | 🇨🇦 Canada | $2,082 | 20.3% |
| Missouri | 🇨🇦 Canada | $4,453 | 34.9% |
| Montana | 🇨🇦 Canada | $544 | 37.9% |
| Nebraska | 🇲🇽 Mexico | $1,639 | 23.5% |
| Nevada | 🇨🇭 Switzerland | $2,256 | 21.8% |
| New Hampshire | 🇩🇪 Germany | $751 | 13.8% |
| New Jersey | 🇨🇦 Canada | $7,229 | 19.0% |
| New Mexico | 🇲🇽 Mexico | $2,197 | 59.5% |
| New York | 🇨🇦 Canada | $13,773 | 22.3% |
| North Carolina | 🇨🇦 Canada | $5,881 | 20.7% |
| North Dakota | 🇨🇦 Canada | $4,388 | 84.6% |
| Ohio | 🇨🇦 Canada | $17,273 | 38.4% |
| Oklahoma | 🇨🇦 Canada | $1,452 | 27.0% |
| Oregon | 🇨🇳 China | $9,522 | 38.1% |
| Pennsylvania | 🇨🇦 Canada | $9,699 | 25.9% |
| Puerto Rico | 🇳🇱 Netherlands | $2,889 | 17.2% |
| Rhode Island | 🇨🇦 Canada | $410 | 17.1% |
| South Carolina | 🇩🇪 Germany | $4,082 | 13.5% |
| South Dakota | 🇨🇦 Canada | $524 | 38.0% |
| Tennessee | 🇨🇦 Canada | $5,818 | 20.7% |
| Texas | 🇲🇽 Mexico | $89,046 | 31.9% |
| Utah | 🇬🇧 United Kingdom | $8,906 | 50.3% |
| Vermont | 🇨🇦 Canada | $918 | 38.3% |
| Virginia | 🇨🇦 Canada | $2,717 | 16.5% |
| Virgin Islands | 🇳🇱 Netherlands | $90 | 15.2% |
| Washington | 🇨🇳 China | $9,126 | 22.1% |
| West Virginia | 🇨🇦 Canada | $1,283 | 28.1% |
| Wisconsin | 🇨🇦 Canada | $6,226 | 30.4% |
| Wyoming | 🇨🇦 Canada | $225 | 19.3% |
Trade Going Forward
The trade war that started during the tenure of former U.S. president Donald Trump is still ongoing and tariffs set by the U.S. are not expected to be lifted by president Joe Biden, as tensions have expanded beyond just trade issues.
These tariffs, however, have not helped to rectify the significant trade imbalance between the two countries. The states are still extremely reliant on imports from China, and it is not a reciprocal relationship.


War
Visualized: Top 15 Global Tank Fleets
Heavily armed and armored, the modern tank is a versatile and mobile weapons platform, and a critical piece of contemporary warfare.
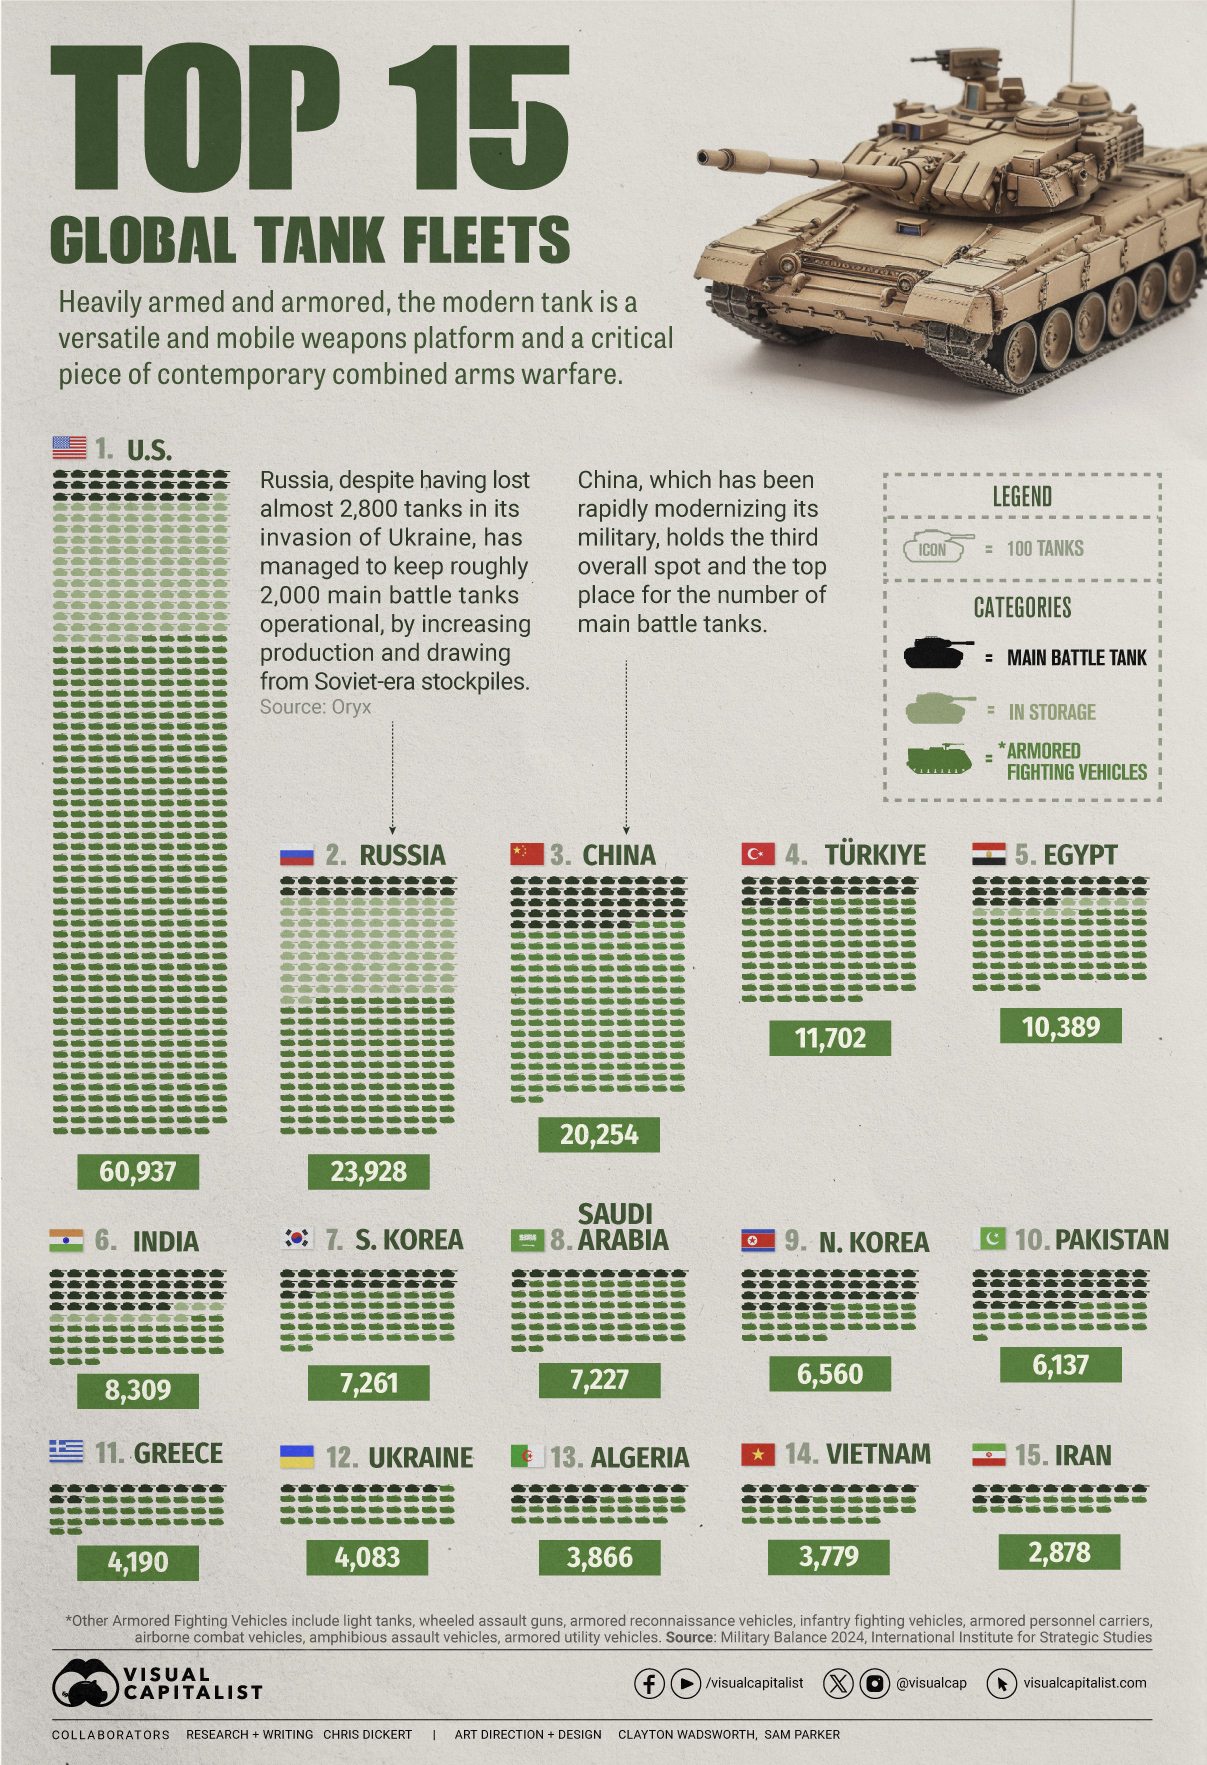
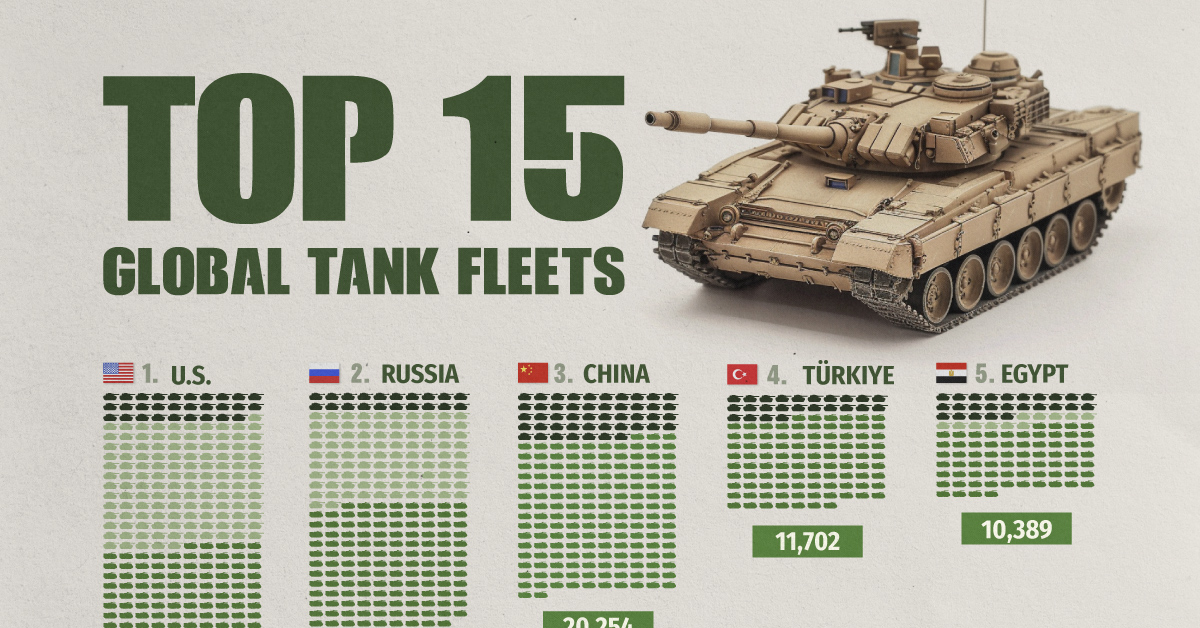
The Top 15 Global Tank Fleets
This was originally posted on our Voronoi app. Download the app for free on iOS or Android and discover incredible data-driven charts from a variety of trusted sources.
Heavily armed and armored, the modern tank is a versatile and mobile weapons platform, and a critical piece of contemporary warfare.
This visualization shows the top 15 global tank fleets, using data from the 2024 Military Balance report from the International Institute for Strategic Studies (IISS).
Let’s take an in-depth look at the top three fleets:
1. United States
As the world’s pre-eminent military power, it’s perhaps no surprise that the United States also has the largest tank fleet, by a wide margin.
In total, they have just over 45,000 armored fighting vehicles in operation, along with 2,640 main battle tanks (MBTs), and 12,800 vehicles in storage, of which 2,000 are main battle tanks.
| Category | Vehicles | Global rank |
|---|---|---|
| Main battle tanks | 2,640 | 4 |
| Armored reconnaissance | 1,745 | 1 |
| Infantry fighting vehicles | 3,262 | 3 |
| Armored personnel carriers | 10,644 | 1 |
| Amphibious assault vehicles | 1,401 | 1 |
| Armored utility vehicles | 28,445 | 1 |
| Storage | 12,800 | 1 |
| Total | 60,937 | 1 |
The U.S. is internalizing the lessons from the ongoing invasion of Ukraine, where Western-supplied anti-tank weapons and massed Ukrainian artillery have been cutting Russian tanks to pieces. As a result, the U.S. recently canceled an upgrade of the M1 Abrams in favor of a more ambitious upgrade.
Meanwhile, the U.S. is nervously eyeing a more confident China and a potential clash over Taiwan, where air and naval forces will be critical. However, a recent war game showed that Taiwanese mechanized ground forces, kitted out with American-made tanks and armored fighting vehicles, were critical in keeping the island autonomous.
2. Russia
According to Oryx, a Dutch open-source intelligence defense website, at time of writing, Russia has lost almost 2,800 main battle tanks since invading Ukraine. Considering that in the 2022 edition of the Military Balance, Russia was estimated to have 2,927 MBTs in operation, those are some hefty losses.
Russia has been able to maintain about 2,000 MBTs in the field, in part, by increasing domestic production. Many defense plants have been taken over by state-owned Rostec and now operate around the clock. Russia is also now spending a full third of their budget on defense, equivalent to about 7.5% of GDP.
At the same time, they’ve also been drawing down their Soviet-era stockpiles, which are modernized before being sent to the front. Just how long they can keep this up is an open question; their stockpiles are large, but not limitless. Here is what their storage levels look like:
| Category | 2023 | 2024 | YOY change |
|---|---|---|---|
| Main battle tanks | 5,000 | 4,000 | -20.0% |
| Armored reconnaissance | 1,000 | 100 | -90.0% |
| Infantry fighting vehicles | 4,000 | 2,800 | -30.0% |
| Armored personnel carriers | 6,000 | 2,300 | -61.7% |
| Total | 16,000 | 9,200 | -42.5% |
3. China
China holds the third overall spot and top place globally for the number of main battle tanks in operation. Untypically, the People’s Liberation Army has no armored vehicles in storage, which perhaps isn’t surprising when you consider that China has been rapidly modernizing its military and that stockpiles usually contain older models.
China also has one of the world’s largest fleets of armored fighting vehicles, second only to the United States. Breaking down that headline number, we can also see that they have the largest number of light tanks, wheeled guns, and infantry fighting vehicles.
| Category | Vehicles | Global rank |
|---|---|---|
| Main battle tanks | 4,700 | 1 |
| Light tanks | 1,330 | 1 |
| Wheeled guns | 1,250 | 1 |
| Infantry fighting vehicles | 8,200 | 1 |
| Armored personnel carriers | 3,604 | 5 |
| Airborne combat vehicles | 180 | 2 |
| Amphibious assault vehicles | 990 | 2 |
| Total | 20,254 | 3 |
This is equipment that would be integral if China were to make an attempt to reunify Taiwan with the mainland by force, where lightly armored mechanized units need to move with speed to occupy the island before Western allies can enter the fray. It’s worth noting that China also has one of the world’s largest fleets of amphibious assault vehicles.
End of the Tank?
Many commentators at the outset of Russia’s invasion of Ukraine, were quick to predict the end of the tank, however, to paraphrase Mark Twain, reports of the tank’s demise are greatly exaggerated.
With the U.S. and China both developing remote and autonomous armored vehicles, tanks could be quite different in the future, but there is nothing else that matches them for firepower, mobility, and survivability on the modern battlefield today.

-

 Markets1 week ago
Ranked: The Largest U.S. Corporations by Number of Employees
-

 Green3 weeks ago
Ranked: Top Countries by Total Forest Loss Since 2001
-

 Money2 weeks ago
Where Does One U.S. Tax Dollar Go?
-

 Automotive2 weeks ago
Almost Every EV Stock is Down After Q1 2024
-

 AI2 weeks ago
The Stock Performance of U.S. Chipmakers So Far in 2024
-

 Markets2 weeks ago
Charted: Big Four Market Share by S&P 500 Audits
-

 Real Estate2 weeks ago
Ranked: The Most Valuable Housing Markets in America
-

 Money2 weeks ago
Which States Have the Highest Minimum Wage in America?