Markets
The World’s 20 Most Profitable Companies
The World’s 20 Most Profitable Companies
The biggest chunk of the earnings pie is increasingly split by fewer and fewer companies.
In the U.S. for example, about 50% of all profit generated by public companies goes to just 30 companies — back in 1975, it took 109 companies to accomplish the same feat:
| Year | Number of Firms Generating 50% of Earnings | Total Public Companies (U.S.) | Portion (%) |
|---|---|---|---|
| 1975 | 109 | 4,819 | 2.2% |
| 2015 | 30 | 3,766 | 0.8% |
This power-law dynamic also manifests itself at a global level — and perhaps it’s little surprise that the world’s most profitable companies generate mind-bending returns that would make any accountant blush.
Which Company Makes the Most Per Day?
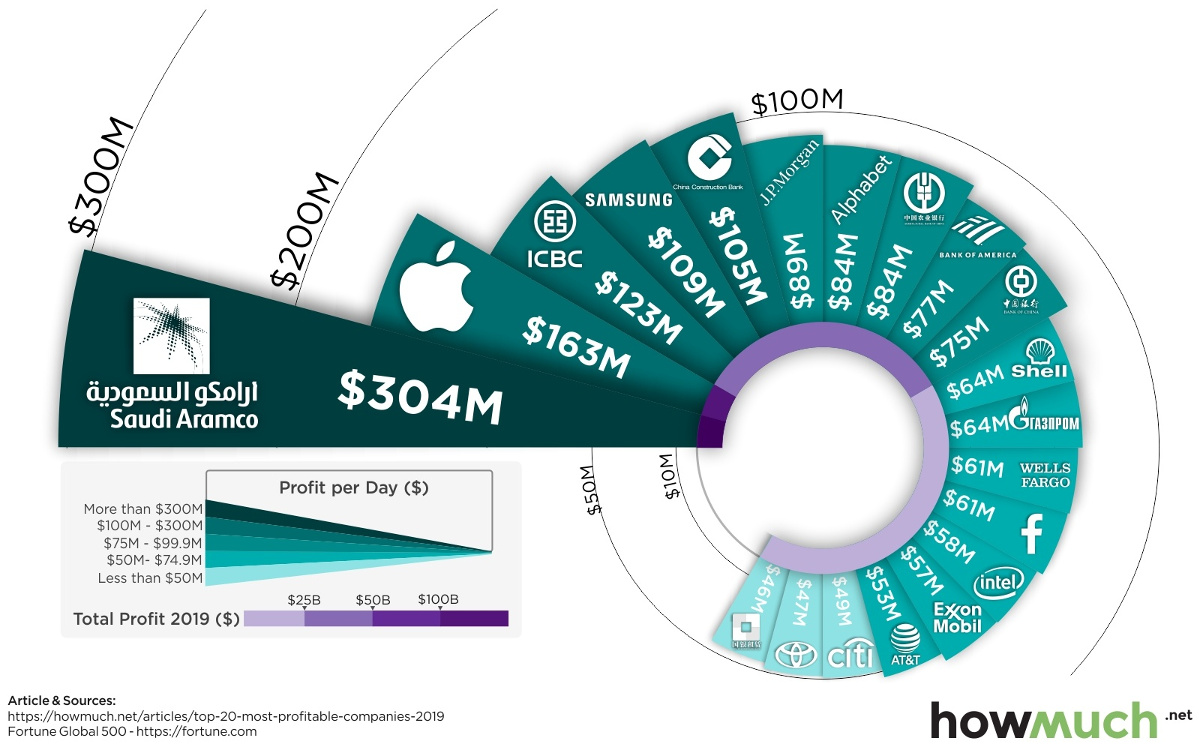
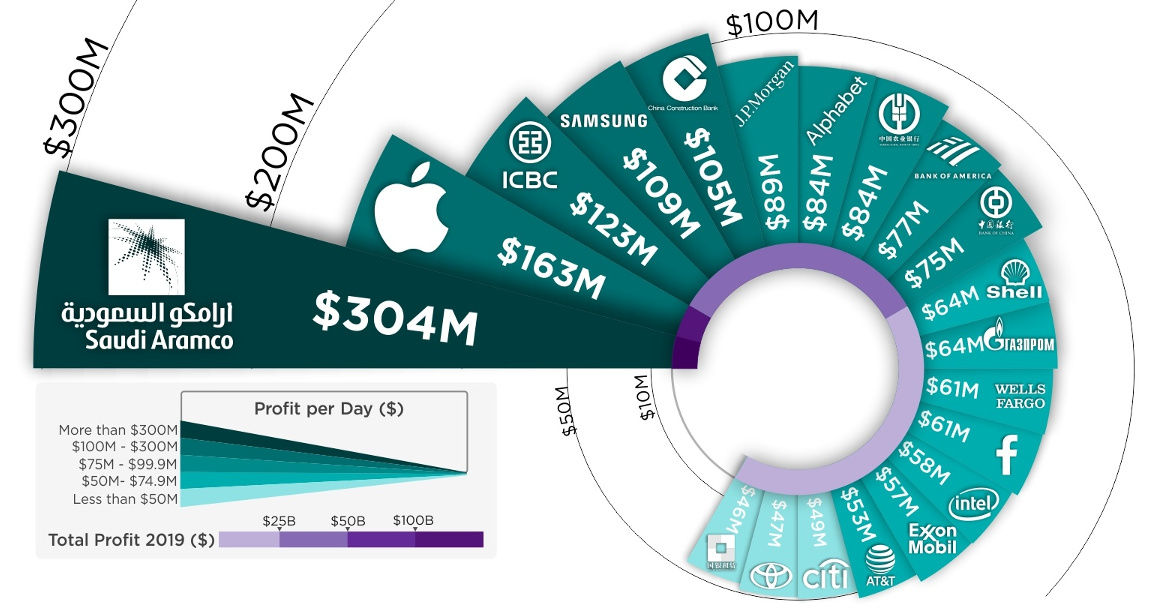
Today’s infographic comes to us from HowMuch.net, and it uses data from Fortune to illustrate how much profit top global companies actually rake in on a daily basis.
The 20 most profitable companies in the world are listed below in order, and we’ve also broken the same data down per second:
| Rank | Company | Country | Profit per Day | Profit Per Second |
|---|---|---|---|---|
| #1 | Saudi Aramco | 🇸🇦 Saudi Arabia | $304,039,726 | $3,519 |
| #2 | Apple | 🇺🇸 United States | $163,098,630 | $1,888 |
| #3 | Industrial & Commercial Bank of China | 🇨🇳 China | $123,293,973 | $1,427 |
| #4 | Samsung Electronics | 🇰🇷 South Korea | $109,301,918 | $1,265 |
| #5 | China Construction Bank | 🇨🇳 China | $105,475,068 | $1,221 |
| #6 | JPMorgan Chase & Co. | 🇺🇸 United States | $88,969,863 | $1,030 |
| #7 | Alphabet | 🇺🇸 United States | $84,208,219 | $975 |
| #8 | Agricultural Bank of China | 🇨🇳 China | $83,990,411 | $972 |
| #9 | Bank of America Corp. | 🇺🇸 United States | $77,115,068 | $893 |
| #10 | Bank of China | 🇨🇳 China | $74,589,589 | $863 |
| #11 | Royal Dutch Shell | 🇬🇧 🇳🇱 UK/Netherlands | $63,978,082 | $740 |
| #12 | Gazprom | 🇷🇺 Russia | $63,559,178 | $736 |
| #13 | Wells Fargo | 🇺🇸 United States | $61,350,685 | $710 |
| #14 | 🇺🇸 United States | $60,580,822 | $701 | |
| #15 | Intel | 🇺🇸 United States | $57,679,452 | $668 |
| #16 | Exxon Mobil | 🇺🇸 United States | $57,095,890 | $661 |
| #17 | AT&T | 🇺🇸 United States | $53,068,493 | $614 |
| #18 | Citigroup | 🇺🇸 United States | $49,438,356 | $572 |
| #19 | Toyota Motor | 🇯🇵 Japan | $46,526,027 | $538 |
| #20 | China Development Bank | 🇨🇳 China | $45,874,795 | $531 |
The Saudi Arabian Oil Company, known to most as Saudi Aramco, is by far the world’s most profitable company, raking in a stunning $304 million of profits every day. When translated to a more micro scale, that works out to $3,519 per second.
You’ve likely seen Saudi Aramco in the news lately, though for other reasons.
The giant state-owned company has been rearing to go public at an aggressive $2 trillion valuation, but it’s since delayed that IPO multiple times, most recently stating the listing will take place in December 2019 or January 2020. Company-owned refineries were also the subject of drone attacks last month, which took offline 5.7 million bpd of oil production temporarily.
Despite these challenges, Saudi Aramco still stands pretty tall — after all, such blows are softened when you churn out the same amount of profit as Apple, Alphabet, and Facebook combined.
Numbers on an Annual Basis
Bringing in over $300 million per day of profit is pretty hard to comprehend, but the numbers are even more unfathomable when they are annualized.
| Rank | Company | Country | Profit |
|---|---|---|---|
| #1 | Saudi Aramco | 🇸🇦 Saudi Arabia | $110,974,500,000 |
| #2 | Apple | 🇺🇸 United States | $59,531,000,000 |
| #3 | Industrial & Commercial Bank of China | 🇨🇳 China | $45,002,300,000 |
| #4 | Samsung Electronics | 🇰🇷 South Korea | $39,895,200,000 |
| #5 | China Construction Bank | 🇨🇳 China | $38,498,400,000 |
| #6 | JPMorgan Chase & Co. | 🇺🇸 United States | $32,474,000,000 |
| #7 | Alphabet | 🇺🇸 United States | $30,736,000,000 |
| #8 | Agricultural Bank of China | 🇨🇳 China | $30,656,500,000 |
| #9 | Bank of America Corp. | 🇺🇸 United States | $28,147,000,000 |
| #10 | Bank of China | 🇨🇳 China | $27,225,200,000 |
| #11 | Royal Dutch Shell | 🇬🇧 🇳🇱 UK/Netherlands | $23,352,000,000 |
| #12 | Gazprom | 🇷🇺 Russia | $23,199,100,000 |
| #13 | Wells Fargo | 🇺🇸 United States | $22,393,000,000 |
| #14 | 🇺🇸 United States | $22,112,000,000 | |
| #15 | Intel | 🇺🇸 United States | $21,053,000,000 |
| #16 | Exxon Mobil | 🇺🇸 United States | $20,840,000,000 |
| #17 | AT&T | 🇺🇸 United States | $19,370,000,000 |
| #18 | Citigroup | 🇺🇸 United States | $18,045,000,000 |
| #19 | Toyota Motor | 🇯🇵 Japan | $16,982,000,000 |
| #20 | China Development Bank | 🇨🇳 China | $16,744,300,000 |
On an annual basis, Saudi Aramco is raking in $111 billion of profit per year, and that’s with oil prices sitting in the $50-$70 per barrel range.
To put this number in perspective, take a look at Chevron. The American oil giant is one of the 20 biggest companies on the S&P 500, but it generated just $15 billion in profit in 2018 and currently sits at a $221 billion market capitalization.
That puts Chevron’s profits at roughly 10% of Aramco’s — and if Aramco does IPO at a $2 trillion valuation, that would put Chevron at roughly 10% of its market cap, as well.


Economy
Economic Growth Forecasts for G7 and BRICS Countries in 2024
The IMF has released its economic growth forecasts for 2024. How do the G7 and BRICS countries compare?


G7 & BRICS Real GDP Growth Forecasts for 2024
The International Monetary Fund’s (IMF) has released its real gross domestic product (GDP) growth forecasts for 2024, and while global growth is projected to stay steady at 3.2%, various major nations are seeing declining forecasts.
This chart visualizes the 2024 real GDP growth forecasts using data from the IMF’s 2024 World Economic Outlook for G7 and BRICS member nations along with Saudi Arabia, which is still considering an invitation to join the bloc.
Get the Key Insights of the IMF’s World Economic Outlook
Want a visual breakdown of the insights from the IMF’s 2024 World Economic Outlook report?
This visual is part of a special dispatch of the key takeaways exclusively for VC+ members.
Get the full dispatch of charts by signing up to VC+.
Mixed Economic Growth Prospects for Major Nations in 2024
Economic growth projections by the IMF for major nations are mixed, with the majority of G7 and BRICS countries forecasted to have slower growth in 2024 compared to 2023.
Only three BRICS-invited or member countries, Saudi Arabia, the UAE, and South Africa, have higher projected real GDP growth rates in 2024 than last year.
| Group | Country | Real GDP Growth (2023) | Real GDP Growth (2024P) |
|---|---|---|---|
| G7 | 🇺🇸 U.S. | 2.5% | 2.7% |
| G7 | 🇨🇦 Canada | 1.1% | 1.2% |
| G7 | 🇯🇵 Japan | 1.9% | 0.9% |
| G7 | 🇫🇷 France | 0.9% | 0.7% |
| G7 | 🇮🇹 Italy | 0.9% | 0.7% |
| G7 | 🇬🇧 UK | 0.1% | 0.5% |
| G7 | 🇩🇪 Germany | -0.3% | 0.2% |
| BRICS | 🇮🇳 India | 7.8% | 6.8% |
| BRICS | 🇨🇳 China | 5.2% | 4.6% |
| BRICS | 🇦🇪 UAE | 3.4% | 3.5% |
| BRICS | 🇮🇷 Iran | 4.7% | 3.3% |
| BRICS | 🇷🇺 Russia | 3.6% | 3.2% |
| BRICS | 🇪🇬 Egypt | 3.8% | 3.0% |
| BRICS-invited | 🇸🇦 Saudi Arabia | -0.8% | 2.6% |
| BRICS | 🇧🇷 Brazil | 2.9% | 2.2% |
| BRICS | 🇿🇦 South Africa | 0.6% | 0.9% |
| BRICS | 🇪🇹 Ethiopia | 7.2% | 6.2% |
| 🌍 World | 3.2% | 3.2% |
China and India are forecasted to maintain relatively high growth rates in 2024 at 4.6% and 6.8% respectively, but compared to the previous year, China is growing 0.6 percentage points slower while India is an entire percentage point slower.
On the other hand, four G7 nations are set to grow faster than last year, which includes Germany making its comeback from its negative real GDP growth of -0.3% in 2023.
Faster Growth for BRICS than G7 Nations
Despite mostly lower growth forecasts in 2024 compared to 2023, BRICS nations still have a significantly higher average growth forecast at 3.6% compared to the G7 average of 1%.
While the G7 countries’ combined GDP is around $15 trillion greater than the BRICS nations, with continued higher growth rates and the potential to add more members, BRICS looks likely to overtake the G7 in economic size within two decades.
BRICS Expansion Stutters Before October 2024 Summit
BRICS’ recent expansion has stuttered slightly, as Argentina’s newly-elected president Javier Milei declined its invitation and Saudi Arabia clarified that the country is still considering its invitation and has not joined BRICS yet.
Even with these initial growing pains, South Africa’s Foreign Minister Naledi Pandor told reporters in February that 34 different countries have submitted applications to join the growing BRICS bloc.
Any changes to the group are likely to be announced leading up to or at the 2024 BRICS summit which takes place October 22-24 in Kazan, Russia.
Get the Full Analysis of the IMF’s Outlook on VC+
This visual is part of an exclusive special dispatch for VC+ members which breaks down the key takeaways from the IMF’s 2024 World Economic Outlook.
For the full set of charts and analysis, sign up for VC+.

-

 Markets1 week ago
U.S. Debt Interest Payments Reach $1 Trillion
-

 Markets2 weeks ago
Ranked: The Most Valuable Housing Markets in America
-

 Money2 weeks ago
Which States Have the Highest Minimum Wage in America?
-

 AI2 weeks ago
Ranked: Semiconductor Companies by Industry Revenue Share
-

 Markets2 weeks ago
Ranked: The World’s Top Flight Routes, by Revenue
-

 Countries2 weeks ago
Population Projections: The World’s 6 Largest Countries in 2075
-

 Markets2 weeks ago
The Top 10 States by Real GDP Growth in 2023
-

 Money2 weeks ago
The Smallest Gender Wage Gaps in OECD Countries