Markets
The Reputational Risks That CEOs are Most Worried About
View a high resolution version of this graphic
The Reputational Risks That CEOs are Most Worried About
View the full-size version of the infographic by clicking here
Building an enduring business isn’t easy work.
It can take decades to earn trust and respect in a given market, and it only takes one terrible miscue to unravel all of that goodwill.
As a result, it’s no surprise that the world’s best CEOs think a lot about evaluating these kinds of risks. So what do executives see as being the biggest reputational risks lingering over the next 12 months for their businesses?
Risky Business
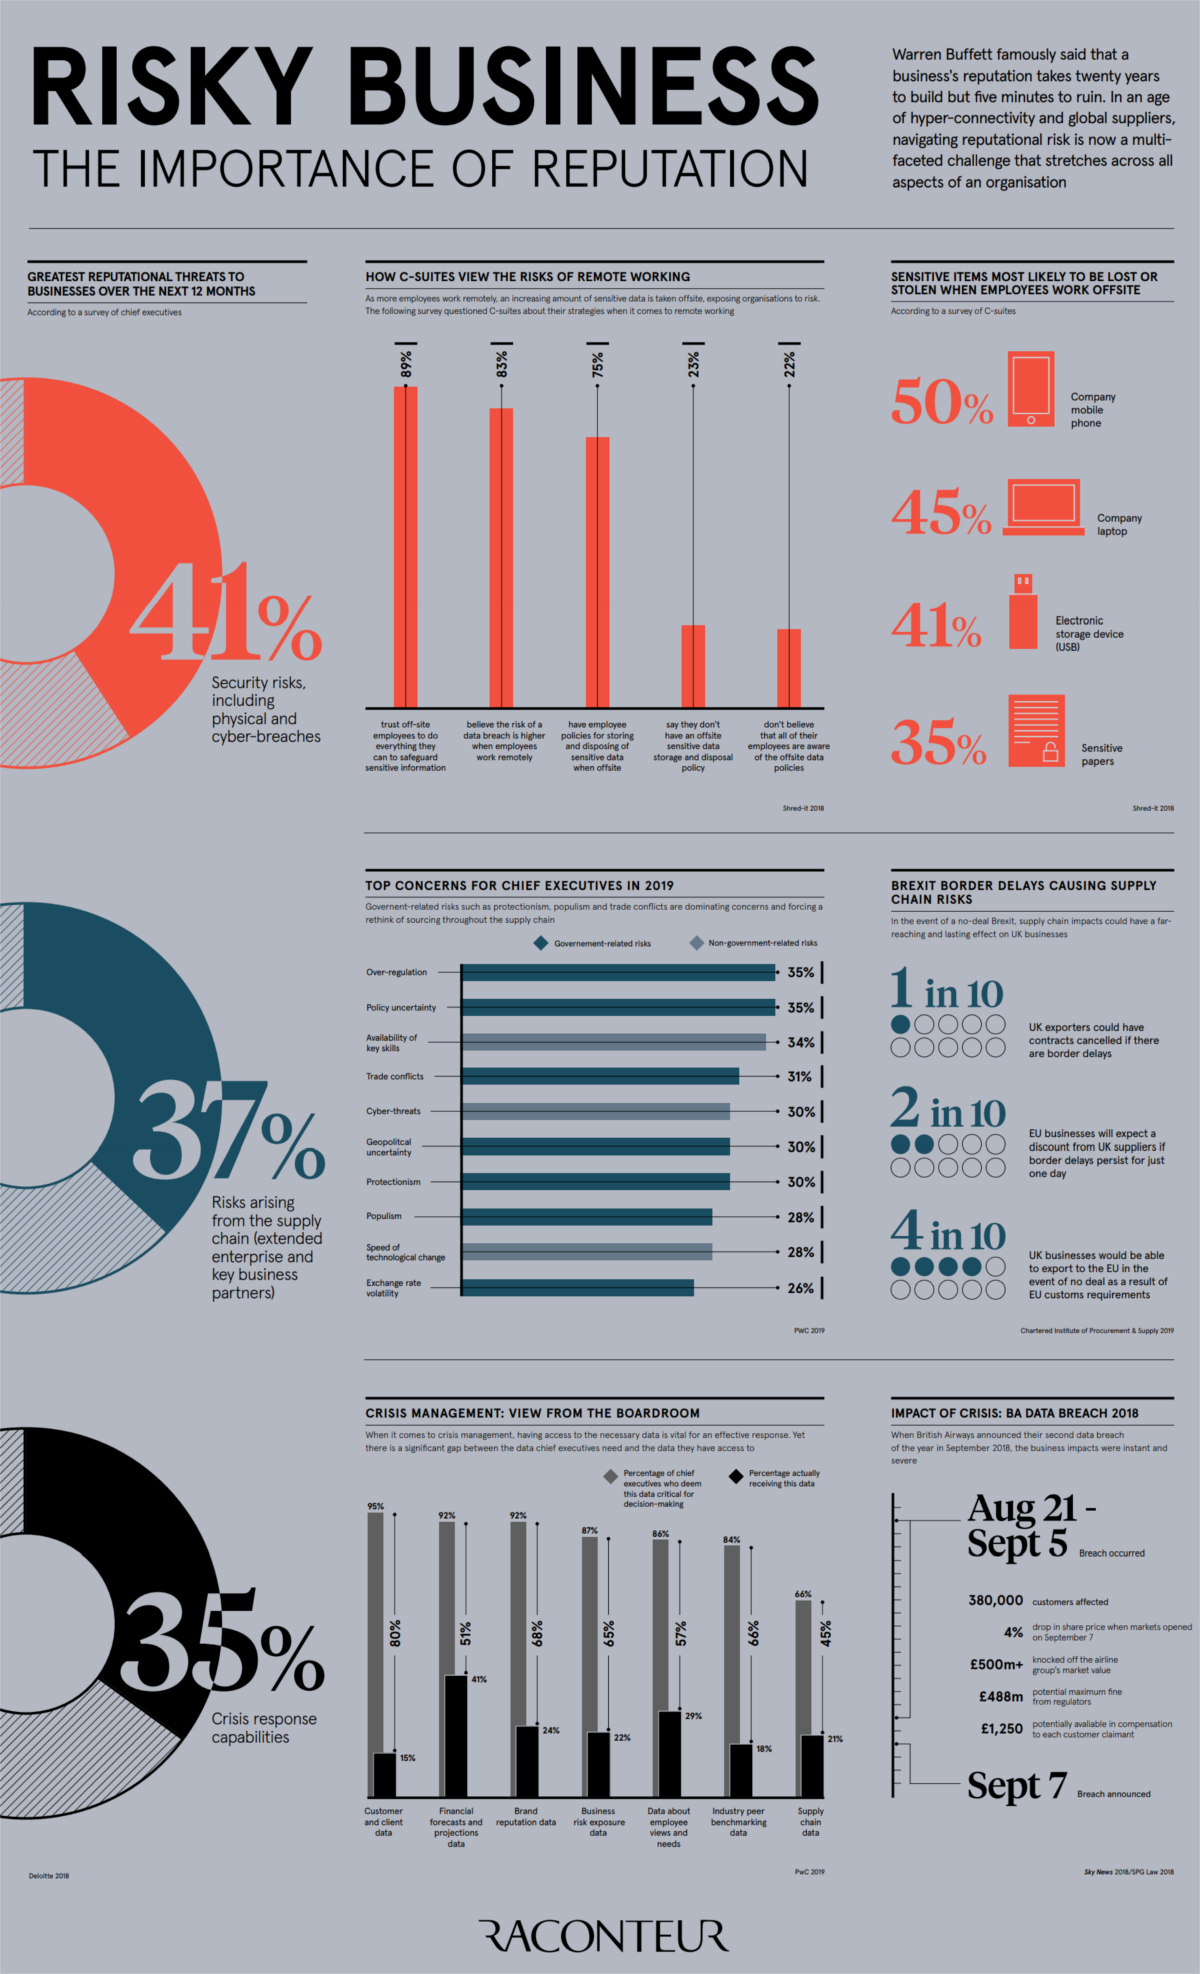
Today’s infographic comes to us from Raconteur, and it breaks down the near-term reputational risks seen by CEOs as based on research by Deloitte.
The concerns highlighted in the survey fall into three major categories:
- Security risks: including physical and cyber breaches (41%)
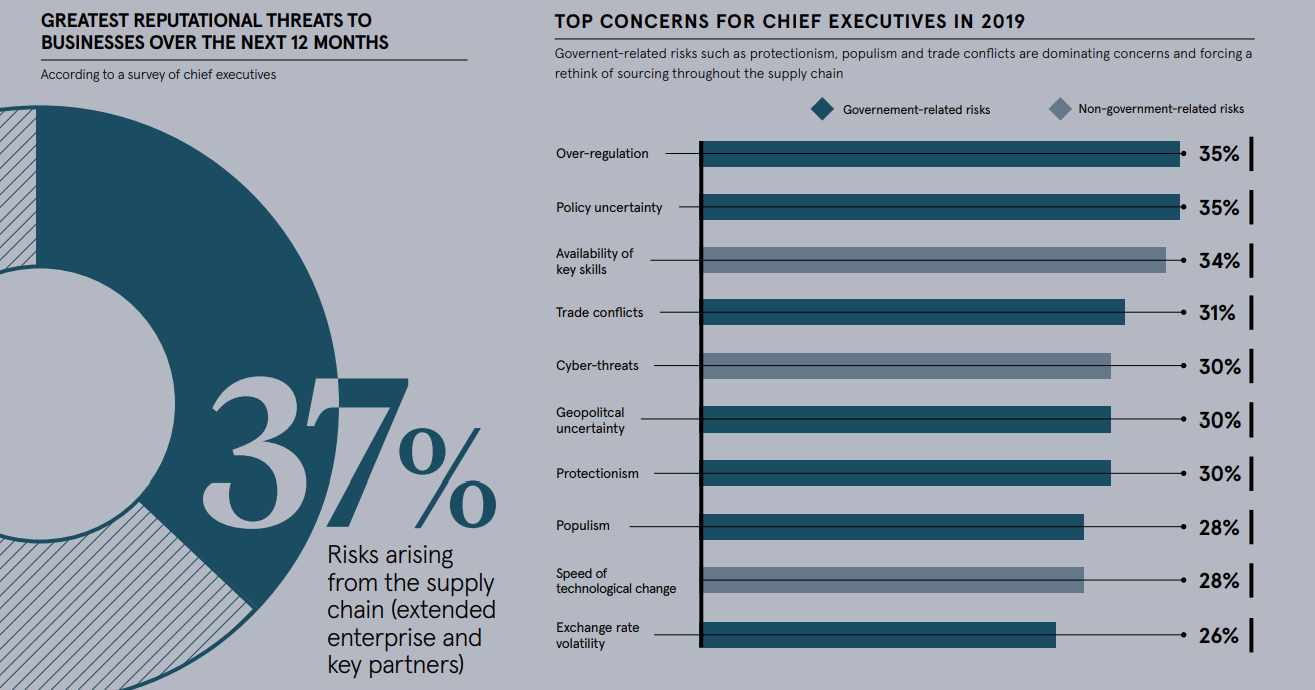
- Supply chain: risks arising from extended enterprise and key partners (37%)
- Crisis response capabilities: how the organization deals with crises (35%)
Let’s dive a little deeper, to see why these broad areas are such a concern.
Security Risks
As more people work remotely, CEOs see a rising risk stemming from data breaches.
Although 89% of the C-suite believes that employees will do everything they can do to safeguard information, about 22% say their employees aren’t aware of offsite data policies. The devices most at risk, according to this group, are company mobile phones (50%), company laptops (45%) and USB storage devices (41%).
Supply Chain Risk
When it comes to maintaining the quality of your product or service, it’s not optimal to be reliant on third-parties.
However, it’s also unlikely for companies to be fully vertically integrated – somewhere along the way, you need to get raw materials from a supplier, or you need to rely on a logistics company to deliver your goods to market. The more borders that need to be crossed, and the further an item has to go, the more complicated it all gets.
In terms of supply chain risk, CEOs are mostly concerned about government action (or inaction): uncertainty about policy, over-regulation, trade conflicts, geopolitical uncertainty, and protectionism were all items that registered high on the list.
Crisis Management
It pays to be prepared when it comes to crises.
The only problem? It would seem the data that C-level execs need to make emergency decisions is not up to snuff. For example, 95% of CEOs see customer and client data as being necessary in such a situation, but only 15% of companies are successfully collecting such data.
The same gap seems to occur when it comes to other types of data, including brand reputation data, financial forecasts and projections, employee needs and views, industry peer benchmarking, and supply chain data.


Markets
U.S. Debt Interest Payments Reach $1 Trillion
U.S. debt interest payments have surged past the $1 trillion dollar mark, amid high interest rates and an ever-expanding debt burden.


U.S. Debt Interest Payments Reach $1 Trillion
This was originally posted on our Voronoi app. Download the app for free on iOS or Android and discover incredible data-driven charts from a variety of trusted sources.
The cost of paying for America’s national debt crossed the $1 trillion dollar mark in 2023, driven by high interest rates and a record $34 trillion mountain of debt.
Over the last decade, U.S. debt interest payments have more than doubled amid vast government spending during the pandemic crisis. As debt payments continue to soar, the Congressional Budget Office (CBO) reported that debt servicing costs surpassed defense spending for the first time ever this year.
This graphic shows the sharp rise in U.S. debt payments, based on data from the Federal Reserve.
A $1 Trillion Interest Bill, and Growing
Below, we show how U.S. debt interest payments have risen at a faster pace than at another time in modern history:
| Date | Interest Payments | U.S. National Debt |
|---|---|---|
| 2023 | $1.0T | $34.0T |
| 2022 | $830B | $31.4T |
| 2021 | $612B | $29.6T |
| 2020 | $518B | $27.7T |
| 2019 | $564B | $23.2T |
| 2018 | $571B | $22.0T |
| 2017 | $493B | $20.5T |
| 2016 | $460B | $20.0T |
| 2015 | $435B | $18.9T |
| 2014 | $442B | $18.1T |
| 2013 | $425B | $17.2T |
| 2012 | $417B | $16.4T |
| 2011 | $433B | $15.2T |
| 2010 | $400B | $14.0T |
| 2009 | $354B | $12.3T |
| 2008 | $380B | $10.7T |
| 2007 | $414B | $9.2T |
| 2006 | $387B | $8.7T |
| 2005 | $355B | $8.2T |
| 2004 | $318B | $7.6T |
| 2003 | $294B | $7.0T |
| 2002 | $298B | $6.4T |
| 2001 | $318B | $5.9T |
| 2000 | $353B | $5.7T |
| 1999 | $353B | $5.8T |
| 1998 | $360B | $5.6T |
| 1997 | $368B | $5.5T |
| 1996 | $362B | $5.3T |
| 1995 | $357B | $5.0T |
| 1994 | $334B | $4.8T |
| 1993 | $311B | $4.5T |
| 1992 | $306B | $4.2T |
| 1991 | $308B | $3.8T |
| 1990 | $298B | $3.4T |
| 1989 | $275B | $3.0T |
| 1988 | $254B | $2.7T |
| 1987 | $240B | $2.4T |
| 1986 | $225B | $2.2T |
| 1985 | $219B | $1.9T |
| 1984 | $205B | $1.7T |
| 1983 | $176B | $1.4T |
| 1982 | $157B | $1.2T |
| 1981 | $142B | $1.0T |
| 1980 | $113B | $930.2B |
| 1979 | $96B | $845.1B |
| 1978 | $84B | $789.2B |
| 1977 | $69B | $718.9B |
| 1976 | $61B | $653.5B |
| 1975 | $55B | $576.6B |
| 1974 | $50B | $492.7B |
| 1973 | $45B | $469.1B |
| 1972 | $39B | $448.5B |
| 1971 | $36B | $424.1B |
| 1970 | $35B | $389.2B |
| 1969 | $30B | $368.2B |
| 1968 | $25B | $358.0B |
| 1967 | $23B | $344.7B |
| 1966 | $21B | $329.3B |
Interest payments represent seasonally adjusted annual rate at the end of Q4.
At current rates, the U.S. national debt is growing by a remarkable $1 trillion about every 100 days, equal to roughly $3.6 trillion per year.
As the national debt has ballooned, debt payments even exceeded Medicaid outlays in 2023—one of the government’s largest expenditures. On average, the U.S. spent more than $2 billion per day on interest costs last year. Going further, the U.S. government is projected to spend a historic $12.4 trillion on interest payments over the next decade, averaging about $37,100 per American.
Exacerbating matters is that the U.S. is running a steep deficit, which stood at $1.1 trillion for the first six months of fiscal 2024. This has accelerated due to the 43% increase in debt servicing costs along with a $31 billion dollar increase in defense spending from a year earlier. Additionally, a $30 billion increase in funding for the Federal Deposit Insurance Corporation in light of the regional banking crisis last year was a major contributor to the deficit increase.
Overall, the CBO forecasts that roughly 75% of the federal deficit’s increase will be due to interest costs by 2034.

-

 Real Estate2 weeks ago
Visualizing America’s Shortage of Affordable Homes
-

 Technology1 week ago
Ranked: Semiconductor Companies by Industry Revenue Share
-

 Money1 week ago
Which States Have the Highest Minimum Wage in America?
-

 Real Estate1 week ago
Ranked: The Most Valuable Housing Markets in America
-

 Business1 week ago
Charted: Big Four Market Share by S&P 500 Audits
-

 AI2 weeks ago
The Stock Performance of U.S. Chipmakers So Far in 2024
-

 Misc2 weeks ago
Almost Every EV Stock is Down After Q1 2024
-

 Money2 weeks ago
Where Does One U.S. Tax Dollar Go?