Markets
The Buffett Indicator at All-Time Highs: Is This Cause for Concern?
Buffett Indicator at All-Time Highs: A Cause for Concern?
In 2001, Warren Buffett famously described the stock market capitalization-to-GDP ratio as “the best single measure of where valuations stand at any given moment.”
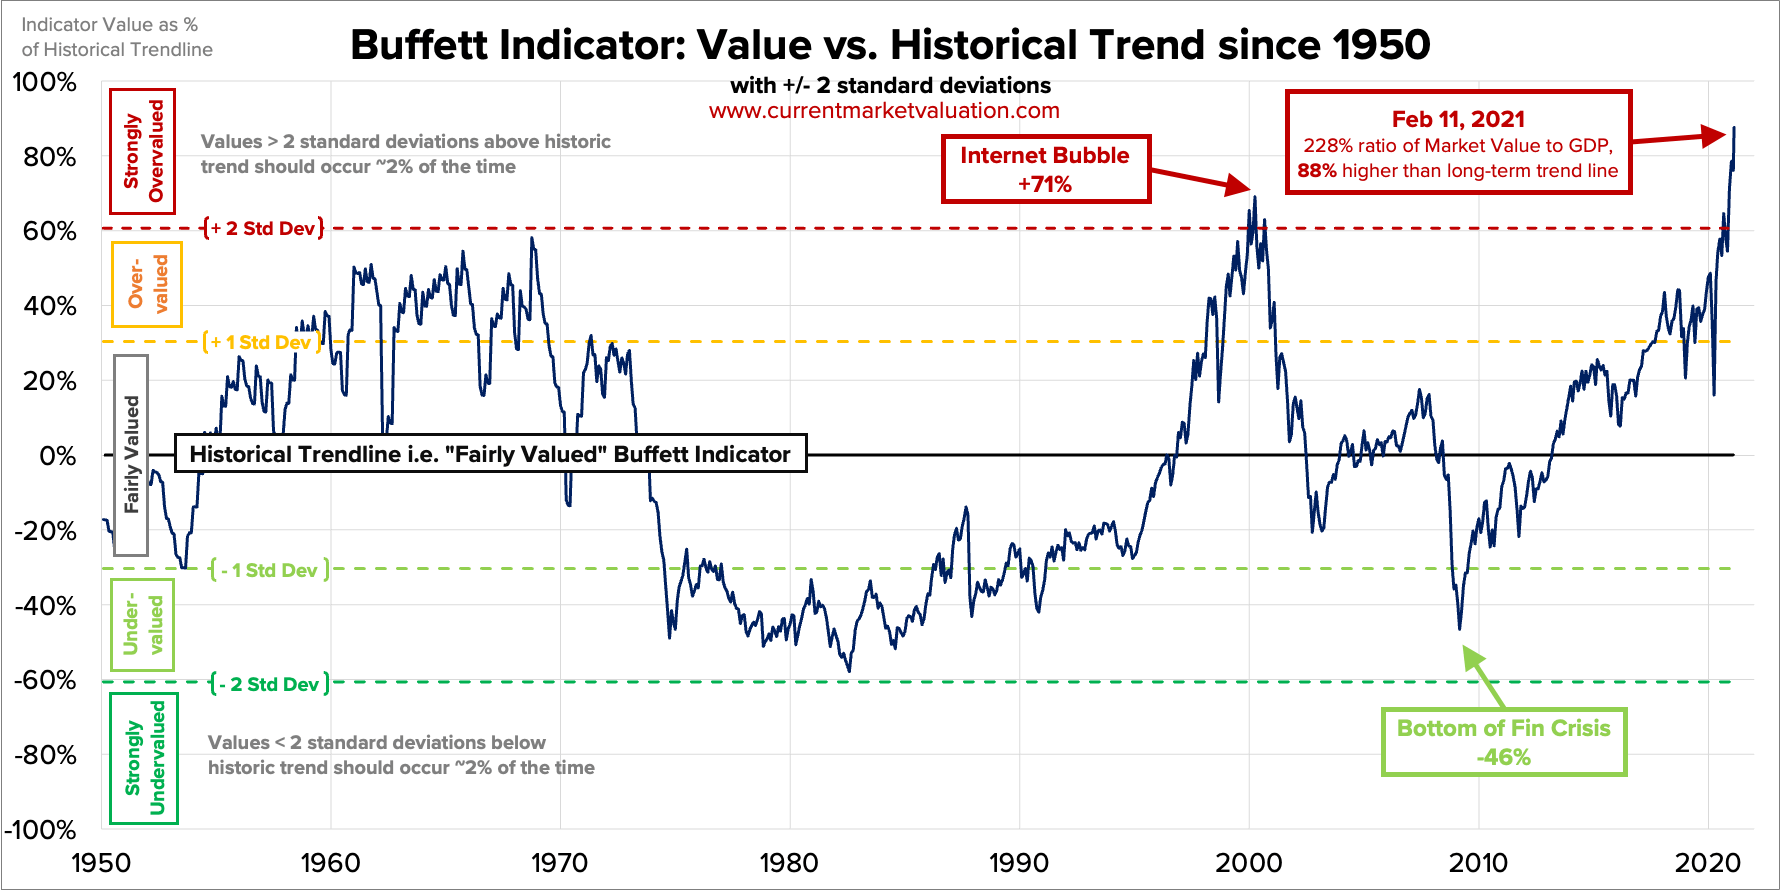
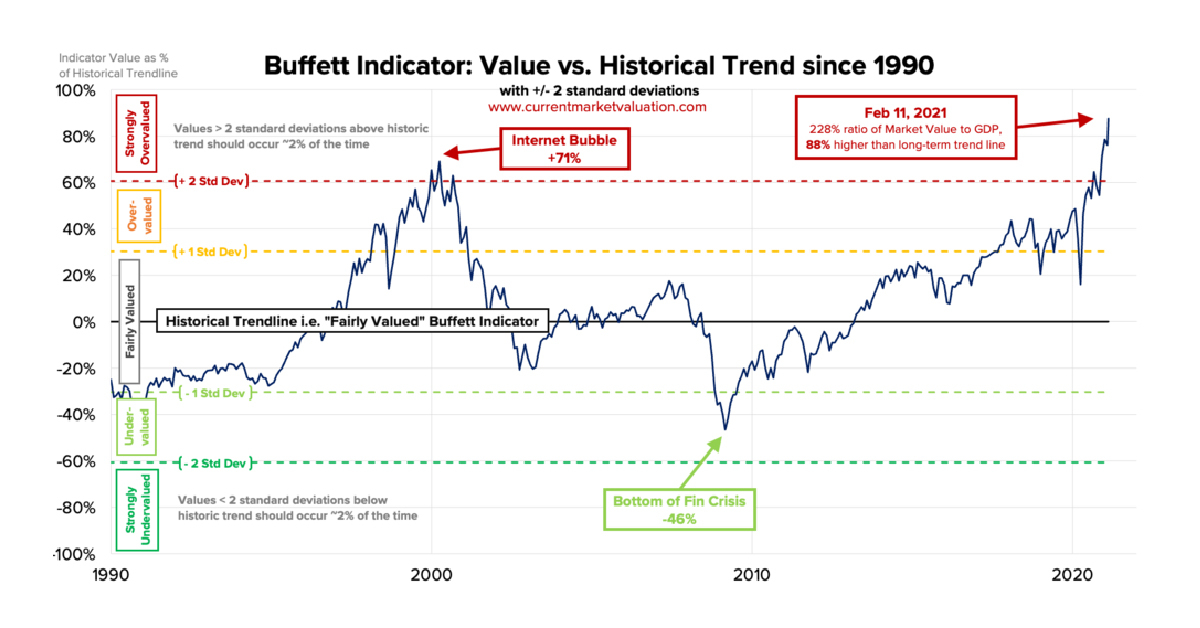
This ratio, now commonly known as the Buffett Indicator, compares the size of the stock market to that of the economy. A high ratio indicates an overvalued market—and as of February 11, 2021, the ratio has reached all-time highs, indicating that the U.S. stock market is currently strongly overvalued.
Today’s graphic by Current Market Valuation (CMV) provides an overview of how the Buffett Indicator has changed since 1950. We’ll also explain how the ratio is calculated, and why things might not be as dire as seem.
The Buffet Indicator, Explained
Before diving into the data, let’s cover the basics—what is the Buffett Indicator, and how is its value calculated?
The Buffett Indicator is a ratio used by investors to gauge whether the market is undervalued, fair valued, or overvalued. The ratio is measured by dividing the collective value of a country’s stock market by the nation’s GDP.
Measuring Total Value
CMV used the Wilshire 5000 index, along with data from the Federal Reserve for the historical component, to measure the collective value of the U.S. stock market. Here’s a look at the nation’s composite market value since 1950:
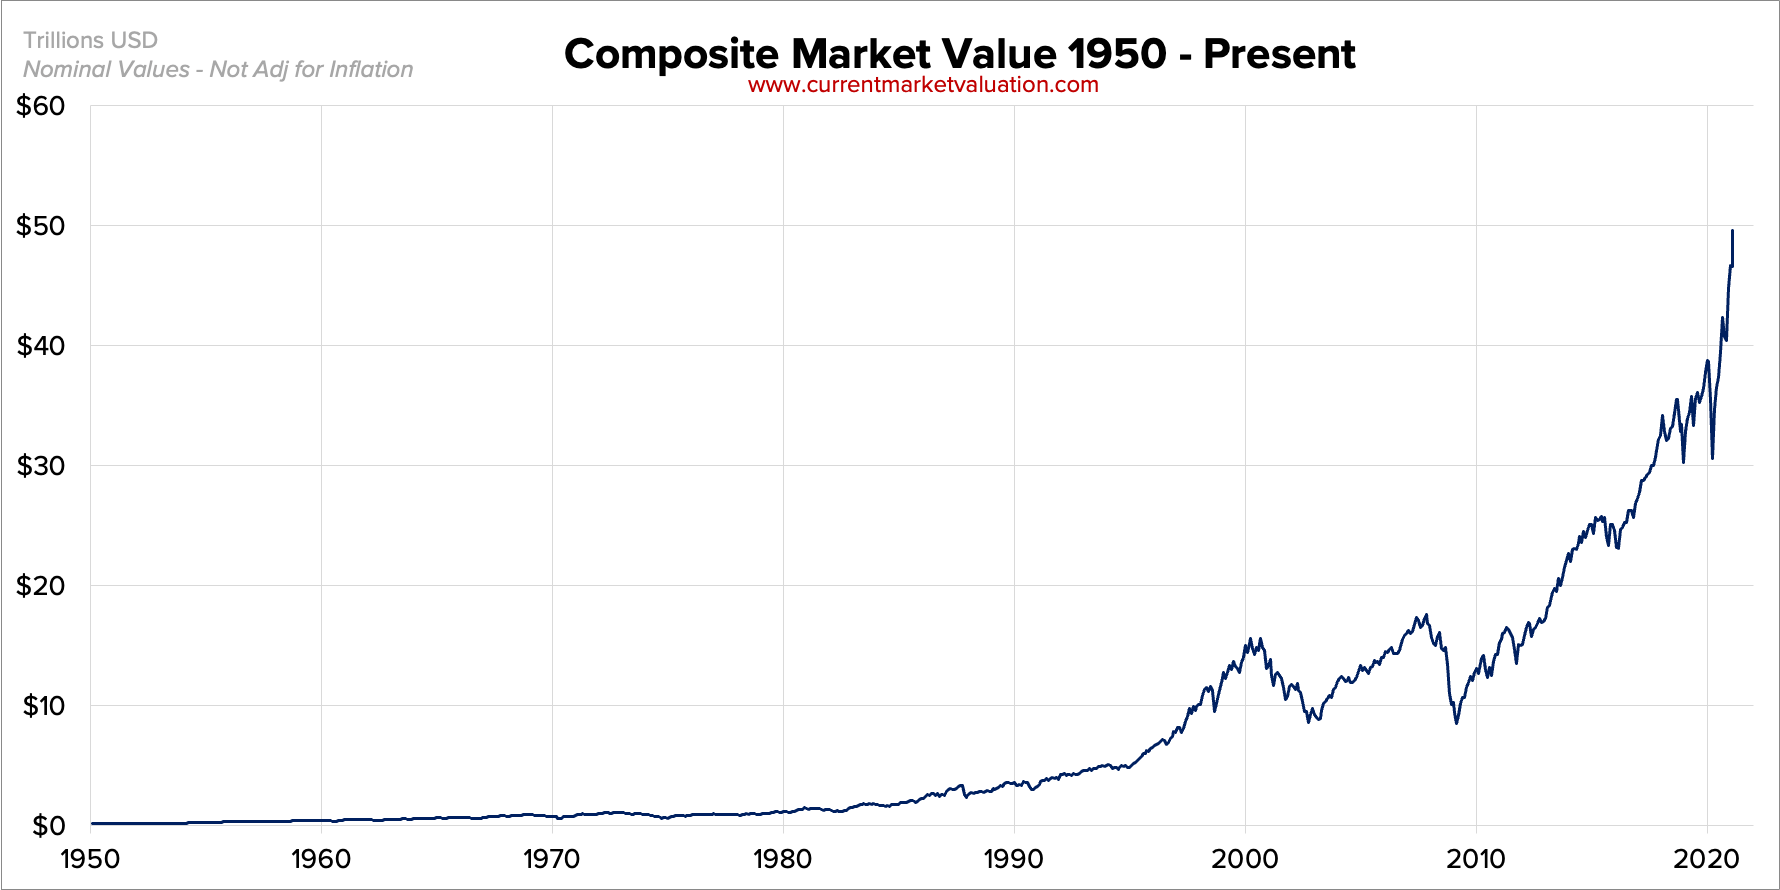
As the chart indicates, the market has experienced steady growth since 2010. And as of February 11, 2021, its total value sits at $49.5T.
Measuring GDP
For the data on GDP since 1950, CMV dipped into the archives from the U.S. Government’s Bureau of Economic Analysis:
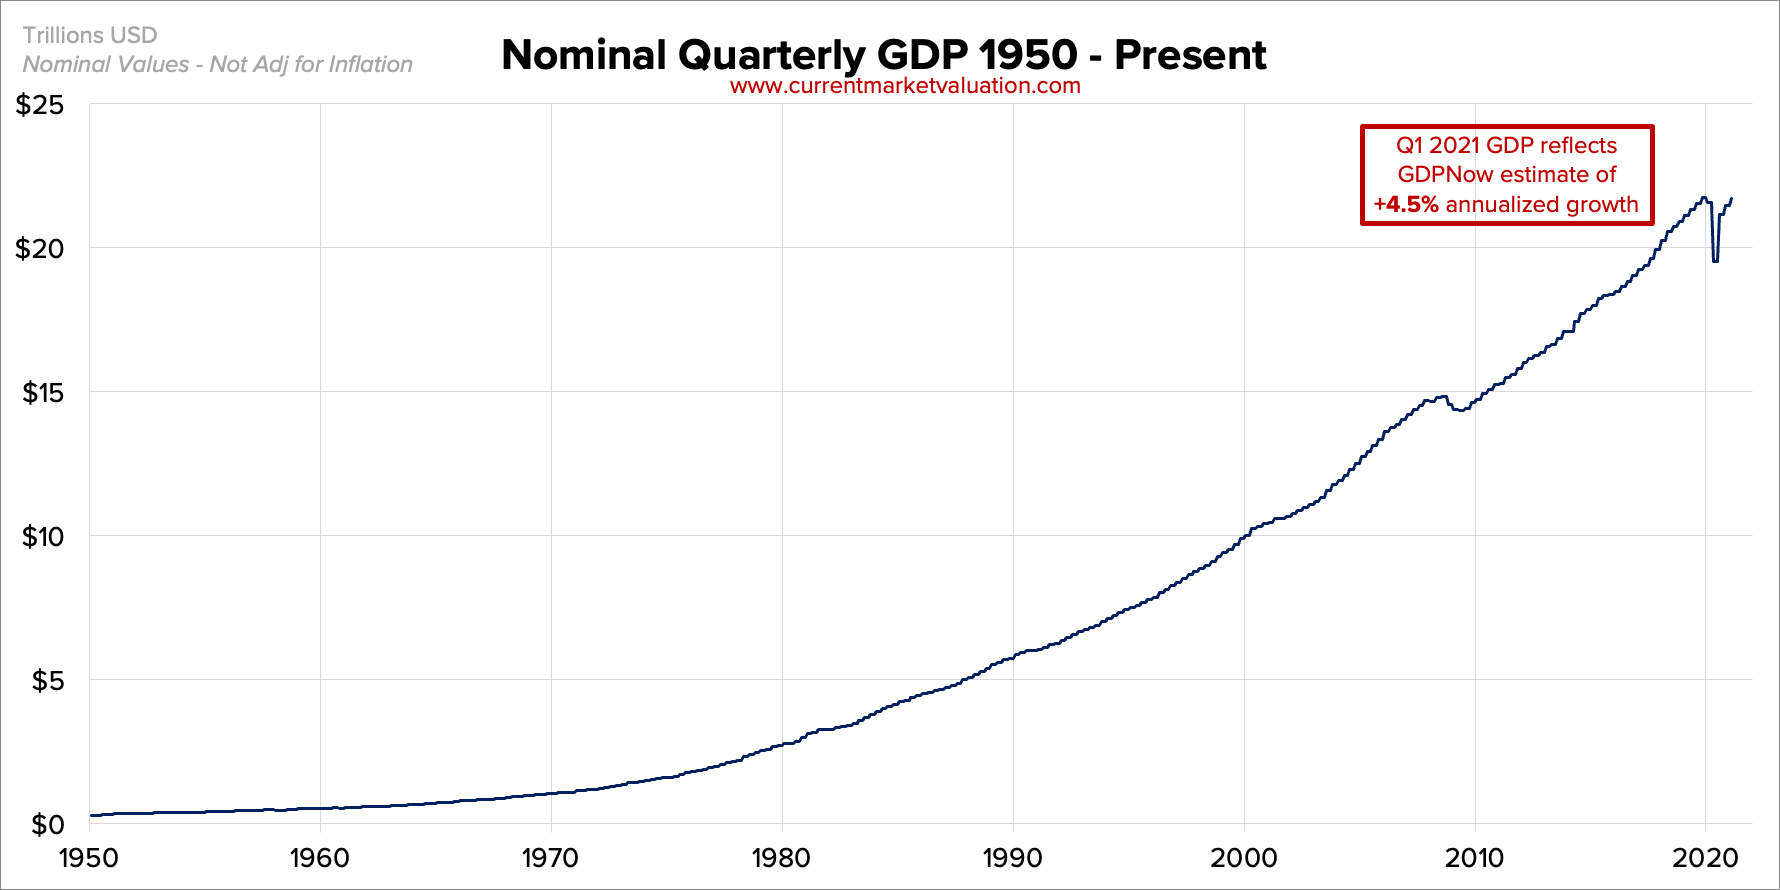
While the Bureau’s data is published quarterly, it doesn’t provide the latest figures. So to find Q1 2021 GDP, CMV used data from the Federal Reserve Bank of Atlanta, and came up with an annualized GDP of $21.7T.
The Ratio
According to Warren Buffett, “if the ratio approaches 200%…you are playing with fire.”
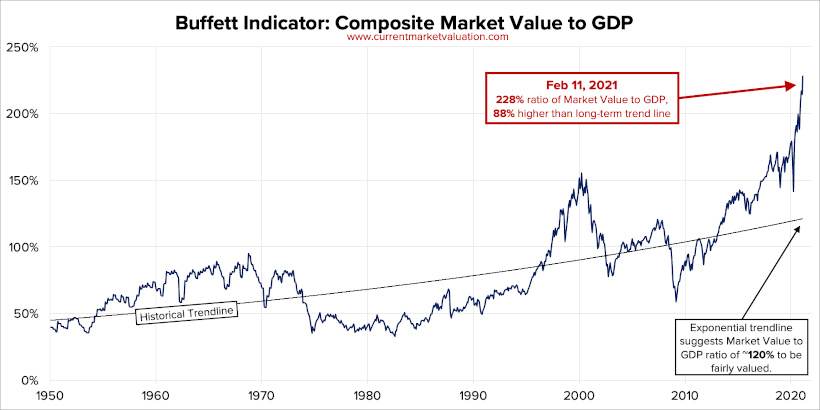
And with the current U.S. ratio sitting at 228%—about 88% higher than historical averages, it certainly looks like things are heating up.
Will History Repeat Itself?
As the popular investing expression goes, the trend is your friend. And historically, the Buffett Indicator has predicted several of America’s most devastating economic downturns.
Here’s a look at some historical moments in the U.S. stock market, and where the Buffett Indicator was valued at the time:
| Date | Event | Buffett Indicator | Value (+/- Trendline) |
|---|---|---|---|
| October 1987 | Black Monday | Fairly Valued | -13% |
| March 2000 | Dotcom Bubble | Strongly Overvalued | +71% |
| December 2007 | Pre-Financial Crisis | Fairly Valued | +18% |
| March 2009 | Financial Crisis Bottom | Undervalued | -46% |
| February 2020 | COVID-19 | Overvalued | +49% |
| February 2021 | Today | Strongly Overvalued | +88% |
As the table shows, the ratio spiked during the Dotcom Bubble, and was relatively high in the months leading up to the 2008 financial crisis. But does that mean we should take the ratio’s current spike as a warning for a market crash in the near future? According to some experts, we might not need to sound the alarms just yet.
Why are some investors so confident in the current market? One main factor is low interest rates, which are expected to stay low for the foreseeable future.
When interest rates are low, borrowing money becomes cheaper, and future real earnings are theoretically worth more, which can have a positive impact on the stock market. And low interest rates mean smaller returns for low-risk assets like bonds, which lowers investor demand and ultimately boosts stock prices further. Meaning that, as long as interest rates are at record lows, the Buffett Indicator will likely stay high.
However, history has been known to repeat itself. So, while we might not need to fasten our seatbelts just yet, this historically high ratio is certainly worth paying attention to.


Markets
U.S. Debt Interest Payments Reach $1 Trillion
U.S. debt interest payments have surged past the $1 trillion dollar mark, amid high interest rates and an ever-expanding debt burden.


U.S. Debt Interest Payments Reach $1 Trillion
This was originally posted on our Voronoi app. Download the app for free on iOS or Android and discover incredible data-driven charts from a variety of trusted sources.
The cost of paying for America’s national debt crossed the $1 trillion dollar mark in 2023, driven by high interest rates and a record $34 trillion mountain of debt.
Over the last decade, U.S. debt interest payments have more than doubled amid vast government spending during the pandemic crisis. As debt payments continue to soar, the Congressional Budget Office (CBO) reported that debt servicing costs surpassed defense spending for the first time ever this year.
This graphic shows the sharp rise in U.S. debt payments, based on data from the Federal Reserve.
A $1 Trillion Interest Bill, and Growing
Below, we show how U.S. debt interest payments have risen at a faster pace than at another time in modern history:
| Date | Interest Payments | U.S. National Debt |
|---|---|---|
| 2023 | $1.0T | $34.0T |
| 2022 | $830B | $31.4T |
| 2021 | $612B | $29.6T |
| 2020 | $518B | $27.7T |
| 2019 | $564B | $23.2T |
| 2018 | $571B | $22.0T |
| 2017 | $493B | $20.5T |
| 2016 | $460B | $20.0T |
| 2015 | $435B | $18.9T |
| 2014 | $442B | $18.1T |
| 2013 | $425B | $17.2T |
| 2012 | $417B | $16.4T |
| 2011 | $433B | $15.2T |
| 2010 | $400B | $14.0T |
| 2009 | $354B | $12.3T |
| 2008 | $380B | $10.7T |
| 2007 | $414B | $9.2T |
| 2006 | $387B | $8.7T |
| 2005 | $355B | $8.2T |
| 2004 | $318B | $7.6T |
| 2003 | $294B | $7.0T |
| 2002 | $298B | $6.4T |
| 2001 | $318B | $5.9T |
| 2000 | $353B | $5.7T |
| 1999 | $353B | $5.8T |
| 1998 | $360B | $5.6T |
| 1997 | $368B | $5.5T |
| 1996 | $362B | $5.3T |
| 1995 | $357B | $5.0T |
| 1994 | $334B | $4.8T |
| 1993 | $311B | $4.5T |
| 1992 | $306B | $4.2T |
| 1991 | $308B | $3.8T |
| 1990 | $298B | $3.4T |
| 1989 | $275B | $3.0T |
| 1988 | $254B | $2.7T |
| 1987 | $240B | $2.4T |
| 1986 | $225B | $2.2T |
| 1985 | $219B | $1.9T |
| 1984 | $205B | $1.7T |
| 1983 | $176B | $1.4T |
| 1982 | $157B | $1.2T |
| 1981 | $142B | $1.0T |
| 1980 | $113B | $930.2B |
| 1979 | $96B | $845.1B |
| 1978 | $84B | $789.2B |
| 1977 | $69B | $718.9B |
| 1976 | $61B | $653.5B |
| 1975 | $55B | $576.6B |
| 1974 | $50B | $492.7B |
| 1973 | $45B | $469.1B |
| 1972 | $39B | $448.5B |
| 1971 | $36B | $424.1B |
| 1970 | $35B | $389.2B |
| 1969 | $30B | $368.2B |
| 1968 | $25B | $358.0B |
| 1967 | $23B | $344.7B |
| 1966 | $21B | $329.3B |
Interest payments represent seasonally adjusted annual rate at the end of Q4.
At current rates, the U.S. national debt is growing by a remarkable $1 trillion about every 100 days, equal to roughly $3.6 trillion per year.
As the national debt has ballooned, debt payments even exceeded Medicaid outlays in 2023—one of the government’s largest expenditures. On average, the U.S. spent more than $2 billion per day on interest costs last year. Going further, the U.S. government is projected to spend a historic $12.4 trillion on interest payments over the next decade, averaging about $37,100 per American.
Exacerbating matters is that the U.S. is running a steep deficit, which stood at $1.1 trillion for the first six months of fiscal 2024. This has accelerated due to the 43% increase in debt servicing costs along with a $31 billion dollar increase in defense spending from a year earlier. Additionally, a $30 billion increase in funding for the Federal Deposit Insurance Corporation in light of the regional banking crisis last year was a major contributor to the deficit increase.
Overall, the CBO forecasts that roughly 75% of the federal deficit’s increase will be due to interest costs by 2034.

-

 Maps2 weeks ago
Mapped: Average Wages Across Europe
-

 Money1 week ago
Which States Have the Highest Minimum Wage in America?
-

 Real Estate1 week ago
Ranked: The Most Valuable Housing Markets in America
-

 Markets1 week ago
Charted: Big Four Market Share by S&P 500 Audits
-

 AI1 week ago
The Stock Performance of U.S. Chipmakers So Far in 2024
-

 Automotive1 week ago
Almost Every EV Stock is Down After Q1 2024
-

 Money2 weeks ago
Where Does One U.S. Tax Dollar Go?
-

 Green2 weeks ago
Ranked: Top Countries by Total Forest Loss Since 2001