Technology
Animation: How Tech is Eating the Brand World
How Technology is Eating the Brand World
Building a brand with an imperishable competitive edge can be difficult.
Technology companies however, are redefining what that edge means. By hastily responding to emerging consumer needs and leveraging the power of brand, these companies can continuously create meaningful solutions for real problems with scale.
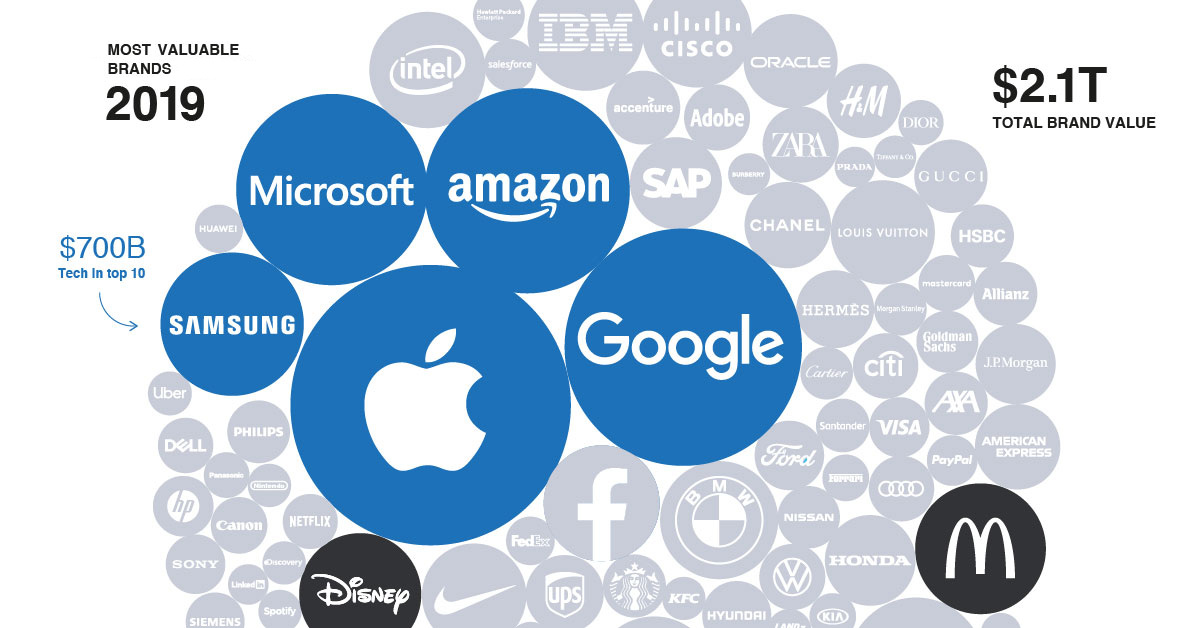
Today’s animated chart highlights the most valuable brands in 2019 versus 2001, according to the annual “Best Global Brands” ranking by Interbrand. It illustrates the degree to which technology companies have been able to scale into massive brands over a short time frame, supplanting some of the best known companies in the world.
What is Brand Value, and How is it Measured?
Interbrand has created and consistently used a robust formula to measure brand value. Brand value is the Net Present Value (NPV) or the present value of the earnings that a brand is forecasted to generate in the future.
The formula evaluates brands based on their financial forecast, brand role, and brand strength. The full methodology can be found here.
Tech Reigns Supreme
In 2001, the cumulative brand value was $988 billion. Today, that value stands at $2.1 trillion and represents an average CAGR of 4.4%. Over the years, global tech giants have swiftly climbed the ranks, and now represent a significant amount of the total brand value.
In fact, with a combined brand value of almost $700 billion, tech companies account for half of the top 10 most valuable brands in the world. Perhaps unsurprisingly, Apple holds the title for the world’s most valuable brand in 2019—for the seventh year running.
Only 31 brands from the 2001 ranking remain on the Best Global Brands list today, including Disney, Nike, and Gucci. Coca-Cola and Microsoft are the few who have remained in the top 10.
Below is the full list of the world’s most valuable brands:
| Rank | Brand | Brand Value ($B) | 1-Yr Value Change | Industry |
|---|---|---|---|---|
| #1 | Apple | $234B | 9% | Technology |
| #2 | $168B | 8% | Technology | |
| #3 | Amazon | $125B | 24% | Technology |
| #4 | Microsoft | $108B | 17% | Technology |
| #5 | Coca-Cola | $63B | -4% | Beverages |
| #6 | Samsung | $61B | 2% | Technology |
| #7 | Toyota | $56B | 5% | Automotive |
| #8 | Mercedes Benz | $51B | 4% | Automotive |
| #9 | McDonald’s | $45B | 4% | Restaurants |
| #10 | Disney | $44B | 11% | Entertainment |
| #11 | BMW | $41B | 1% | Automotive |
| #12 | IBM | $40B | -6% | Business Services |
| #13 | Intel | 40B | -7% | Technology |
| #14 | $40B | -12% | Technology | |
| #15 | Cisco | $35B | 3% | Business Services |
| #16 | Nike | $32B | 7% | Retail |
| #17 | Louis Vuitton | $32B | 14% | Retail |
| #18 | Oracle | $26B | 1% | Business Services |
| #19 | General Electric | $25B | 22% | Diversified |
| #20 | SAP | $25B | 10% | Business Services |
| #21 | Honda | $24B | 3% | Automotive |
| #22 | Chanel | $22B | 11% | Retail |
| #23 | American Express | $22B | 13% | Technology |
| #24 | Pepsi | $20B | -1% | Beverages |
| #25 | J.P Morgan | $19B | 8% | Finance |
| #26 | Ikea | $18B | 5% | Retail |
| #27 | UPS | $18B | 7% | Logistics |
| #28 | Hermes | $18B | 9% | Retail |
| #29 | Zara | $17B | -3% | Retail |
| #30 | H&M | $16B | -3% | Retail |
| #31 | Accenture | $16B | 14% | Business Services |
| #32 | Budweiser | $16B | 3% | Alcohol |
| #33 | Gucci | $16B | 23% | Retail |
| #34 | Pampers | $16B | -5% | FMCG |
| #35 | Ford | $14B | 2% | Automotive |
| #36 | Hyundai | $14B | 5% | Automotive |
| #37 | Gillette | $14B | -18% | FMCG |
| #38 | Nescafe | $14B | 4% | Beverages |
| #39 | Adobe | $13B | 20% | Technology |
| #40 | Volkswagen | $13B | 6% | Automotive |
| #41 | Citi | $13B | 10% | Financial Services |
| #42 | Audi | $13B | 4% | Automotive |
| #43 | Allianz | $12B | 12% | Insurance |
| #44 | ebay | $12B | -8% | |
| #45 | Adidas | $12B | 11% | Fashion |
| #46 | Axa | $12B | 6% | Insurance |
| #47 | HSBC | $12B | 5% | Finance |
| #48 | Starbucks | $12B | 23% | Restaurants |
| #49 | Philips | $12B | -4% | Electronics |
| #50 | Porsche | $12B | 9% | Automotive |
| #51 | L’oreal | $11B | 4% | FMCG |
| #52 | Nissan | $11B | -6% | Automotive |
| #53 | Goldman Sachs | $11B | -4% | Finance |
| #54 | Hewlett Packard | $11B | 4% | Technology |
| #55 | Visa | $11B | 19% | Technology |
| #56 | Sony | $10B | 13% | Technology |
| #57 | Kelloggs | $10B | -2% | FMCG |
| #58 | Siemens | $10B | 1% | Technology |
| #59 | Danone | $10B | 4% | FMCG |
| #60 | Nestle | $9B | 7% | Beverages |
| #61 | Canon | $9B | -9% | Technology |
| #62 | Mastercard | $9B | 25% | Technology |
| #63 | Dell Technologies | $9B | New | Technology |
| #64 | 3M | $9B | -1% | Technology |
| #65 | Netflix | $9B | 10% | Entertainment |
| #66 | Colgate | $9B | 2% | FMCG |
| #67 | Santander | $8B | 13% | Finance |
| #68 | Cartier | $8B | 7% | Luxury |
| #69 | Morgan Stanley | $8B | -7% | Finance |
| #70 | Salesforce | $8B | 24% | Technology |
| #71 | Hewlett Packard Enterprise | $8B | -3% | Technology |
| #72 | PayPal | $8B | 15% | Technology |
| #73 | FedEx | $7B | 2% | Logistics |
| #74 | Huawei | $7B | -9% | Technology |
| #75 | Lego | $7B | 5% | FMCG |
| #76 | Caterpillar | $7B | 19% | Diversified |
| #77 | Ferrari | $6B | 12% | Automotive |
| #78 | Kia | $6B | -7% | Automotive |
| #79 | Corona | $6B | 15% | Alcohol |
| #80 | Jack Daniels | $6B | 13% | Alcohol |
| #81 | Panasonic | $6B | -2% | Technology |
| #82 | Dior | $6B | 16% | Fashion |
| #83 | DHL | $6B | 2% | Logistics |
| #84 | John Deere | $6B | 9% | Diversified |
| #85 | Land Rover | $6B | -6% | Automotive |
| #86 | Johnson & Johnson | $6B | -8% | Retail |
| #87 | Uber | $6B | New | Technology |
| #88 | Heineken | $5,626 | 4% | Alcohol |
| #89 | Nintendo | $6B | 18% | Entertainment |
| #90 | MINI | $5B | 5% | Automotive |
| #91 | Discovery | $5B | -4% | Entertainment |
| #92 | Spotify | $5B | 7% | Technology |
| #93 | KFC | $5B | 1% | Restaurants |
| #94 | Tiffany & Co | $5B | -5% | Fashion |
| #95 | Hennessy | $5B | 12% | Alcohol |
| #96 | Burberry | $5B | 4% | Fashion |
| #97 | Shell | $5B | -3% | Energy |
| #98 | $5B | New | Technology | |
| #99 | Harley Davidson | $5B | -7% | Automotive |
| #100 | Prada | $5B | -1% | Fashion |
Since 2001—the first year the report featured 100 brands—several tech companies have joined and climbed their way to the top of the list, while 137 notable brands dropped off entirely, including Nokia and MTV.
In an interesting turn of events, Facebook dropped out of the top 10, and into 14th place after a volatile year. The move however, is not surprising. The tech giant has been mired in controversies, ranging from data privacy issues to prioritizing political influence.
Which Brands Are Growing the Fastest?
2019’s fastest growing brands also signals tech domination, with Mastercard, Salesforce and Amazon leading the charge.
The companies in this ranking experienced a significant increase in their brand value year-over-year (YoY).
| Rank | Brand | Brand Value ($B) | YoY Growth |
|---|---|---|---|
| #1 | Mastercard | $9B | 25% |
| #2 | Salesforce | $8B | 24% |
| #3 | Amazon | $125B | 24% |
| #4 | Gucci | $16B | 23% |
| #5 | Starbucks | $12B | 23% |
| #6 | Adobe | $13B | 20% |
| #7 | Visa | $11B | 19% |
| #8 | Caterpillar | $7B | 19% |
| #9 | Nintendo | $5B | 18% |
| #10 | Microsoft | $109B | 17% |
According to Interbrand, the success of these brands may be attributed to their ability to anticipate rapidly changing customer expectations.
While the relationship between business performance and brand equity has been a widely debated topic for decades, it is clear that customer satisfaction bolsters brand equity, and encourages impressive financial results.
Disrupt, or Be Disrupted
Beyond anticipating changing needs, some of the most successful brands also cater to a younger customer base. This is the most evident in luxury and retail—the two fastest growing sectors for the second consecutive year.
This audience is tech-first in their buying habits and increasingly demand more elevated and shareable experiences. As a result, traditional brands across all sectors are innovating to keep up with this audience, and some are essentially becoming tech companies in the process.
For example, Gucci attributes their success to finding the perfect blend between creativity and technology. The company that once relied on its heritage, now focuses heavily on ecommerce and social media to engage with their Gen Z customers.
Similarly, Walmart recently announced that they are employing virtual reality headsets and machine-learning-powered robots in an attempt to compete with Amazon.
Will traditional companies ultimately become tech companies, or simply get eaten alive?


Technology
Visualizing AI Patents by Country
See which countries have been granted the most AI patents each year, from 2012 to 2022.


Visualizing AI Patents by Country
This was originally posted on our Voronoi app. Download the app for free on iOS or Android and discover incredible data-driven charts from a variety of trusted sources.
This infographic shows the number of AI-related patents granted each year from 2010 to 2022 (latest data available). These figures come from the Center for Security and Emerging Technology (CSET), accessed via Stanford University’s 2024 AI Index Report.
From this data, we can see that China first overtook the U.S. in 2013. Since then, the country has seen enormous growth in the number of AI patents granted each year.
| Year | China | EU and UK | U.S. | RoW | Global Total |
|---|---|---|---|---|---|
| 2010 | 307 | 137 | 984 | 571 | 1,999 |
| 2011 | 516 | 129 | 980 | 581 | 2,206 |
| 2012 | 926 | 112 | 950 | 660 | 2,648 |
| 2013 | 1,035 | 91 | 970 | 627 | 2,723 |
| 2014 | 1,278 | 97 | 1,078 | 667 | 3,120 |
| 2015 | 1,721 | 110 | 1,135 | 539 | 3,505 |
| 2016 | 1,621 | 128 | 1,298 | 714 | 3,761 |
| 2017 | 2,428 | 144 | 1,489 | 1,075 | 5,136 |
| 2018 | 4,741 | 155 | 1,674 | 1,574 | 8,144 |
| 2019 | 9,530 | 322 | 3,211 | 2,720 | 15,783 |
| 2020 | 13,071 | 406 | 5,441 | 4,455 | 23,373 |
| 2021 | 21,907 | 623 | 8,219 | 7,519 | 38,268 |
| 2022 | 35,315 | 1,173 | 12,077 | 13,699 | 62,264 |
In 2022, China was granted more patents than every other country combined.
While this suggests that the country is very active in researching the field of artificial intelligence, it doesn’t necessarily mean that China is the farthest in terms of capability.
Key Facts About AI Patents
According to CSET, AI patents relate to mathematical relationships and algorithms, which are considered abstract ideas under patent law. They can also have different meaning, depending on where they are filed.
In the U.S., AI patenting is concentrated amongst large companies including IBM, Microsoft, and Google. On the other hand, AI patenting in China is more distributed across government organizations, universities, and tech firms (e.g. Tencent).
In terms of focus area, China’s patents are typically related to computer vision, a field of AI that enables computers and systems to interpret visual data and inputs. Meanwhile America’s efforts are more evenly distributed across research fields.
Learn More About AI From Visual Capitalist
If you want to see more data visualizations on artificial intelligence, check out this graphic that shows which job departments will be impacted by AI the most.

-

 Markets1 week ago
U.S. Debt Interest Payments Reach $1 Trillion
-

 Markets2 weeks ago
Ranked: The Most Valuable Housing Markets in America
-

 Money2 weeks ago
Which States Have the Highest Minimum Wage in America?
-

 AI2 weeks ago
Ranked: Semiconductor Companies by Industry Revenue Share
-

 Markets2 weeks ago
Ranked: The World’s Top Flight Routes, by Revenue
-

 Countries2 weeks ago
Population Projections: The World’s 6 Largest Countries in 2075
-

 Markets2 weeks ago
The Top 10 States by Real GDP Growth in 2023
-

 Money2 weeks ago
The Smallest Gender Wage Gaps in OECD Countries