Technology
The Impressive Stats Behind Amazon’s Dominance of the Cloud
To the average person, cloud computing must seem quite magical.
All at once, the cloud provides instant access to all of your data, photos, music, and applications, without you having to store any of that data locally. In fact, users can access the cloud from practically anywhere in the world, and across multiple devices and platforms.
Yet, this all happens without you actually seeing any visible infrastructure. With data now being created at record speeds, where the heck is all this information being physically stored?
The Rise of AWS
Even though you can’t see the vast infrastructure that runs the cloud, it does exist somewhere.
As today’s infographic from RapidValue shows, much of this infrastructure is owned and operated by Amazon, through its extremely profitable subsidiary of Amazon Web Services (AWS).
Here are the key stats on this dominant service that powers much of the internet today:
Amazon Web Services (AWS) quietly launched in 2002, and in a short time has been able to scale into the largest single player in cloud computing (IaaS, PaaS).
While it is a well-known name to software developers, AWS emerged on a more mainstream basis once its financials were separated from those of parent Amazon.com.
Even in 2018, AWS delivered most of Amazon’s operating income.
AWS By the Numbers
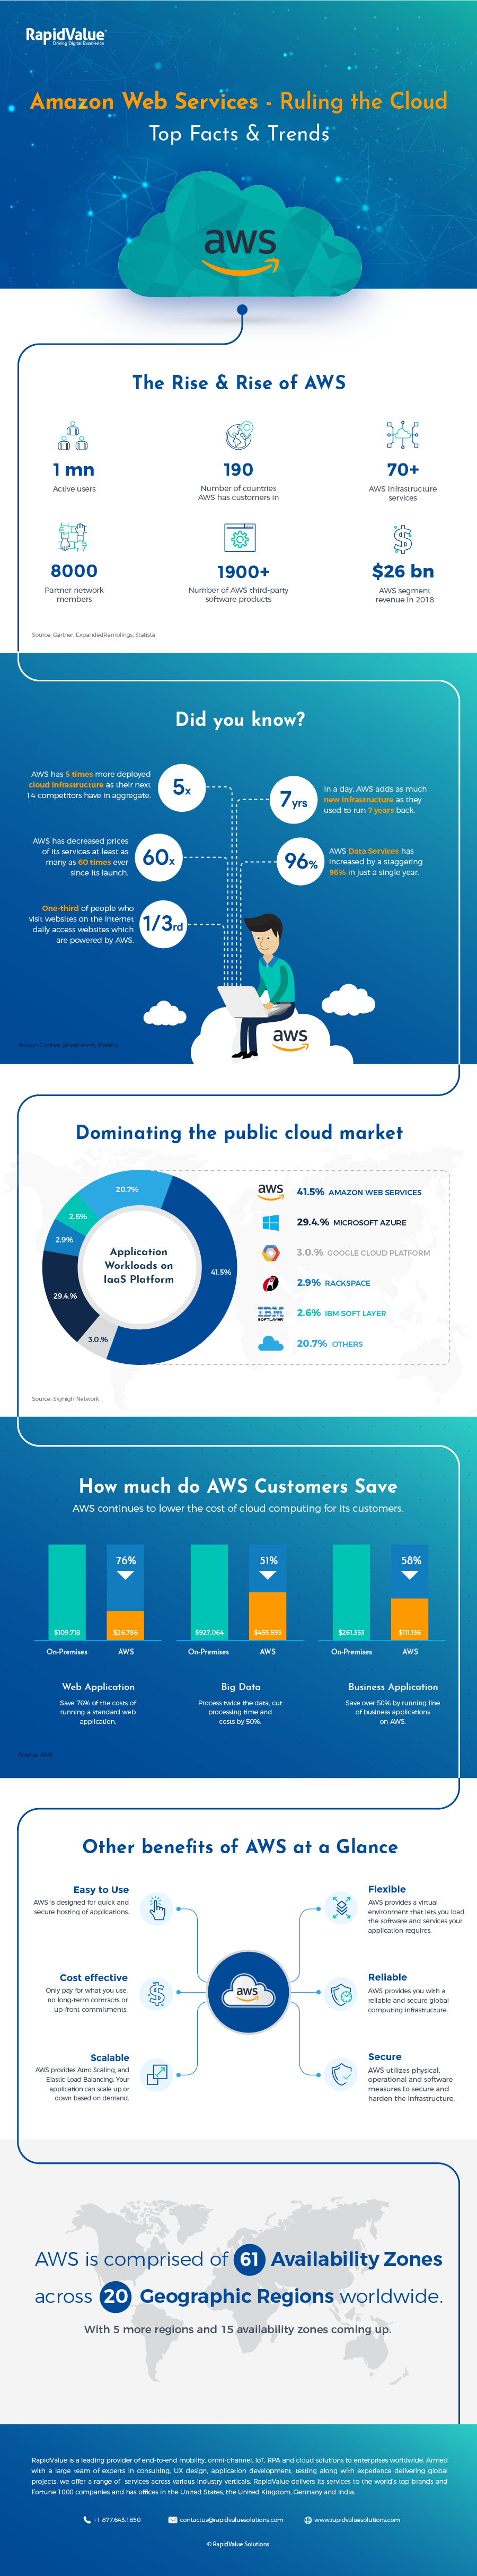
To understand the true scale of AWS, you need to look at the numbers.
- AWS has over 1 million active users in 190 countries
- AWS has 5x more deployed cloud infrastructure as their next 14 competitors combined
- Each day, AWS adds as much infrastructure as they used to run in total 7 years back
- Amazon S3 is designed to deliver 99.999999999% durability and scale past trillions of objects worldwide
- AWS partner, Netflix, accounts for up to one-third of Internet traffic during peak usage times
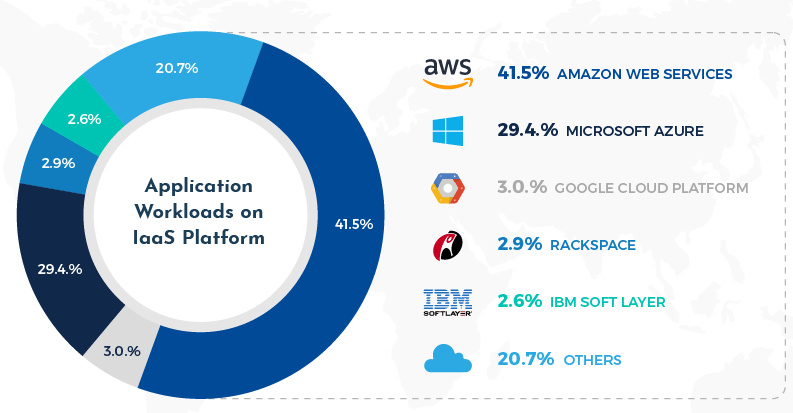
- AWS accounts for 41.5% of the public cloud market, bigger than Microsoft, Google, Rackspace, and IBM combined
Through incredible economies of scale, AWS has decreased its prices at least as many as 60 times since its launch – and despite this, AWS generated a whopping $26 billion in revenue for parent Amazon in 2018.


Technology
Visualizing AI Patents by Country
See which countries have been granted the most AI patents each year, from 2012 to 2022.


Visualizing AI Patents by Country
This was originally posted on our Voronoi app. Download the app for free on iOS or Android and discover incredible data-driven charts from a variety of trusted sources.
This infographic shows the number of AI-related patents granted each year from 2010 to 2022 (latest data available). These figures come from the Center for Security and Emerging Technology (CSET), accessed via Stanford University’s 2024 AI Index Report.
From this data, we can see that China first overtook the U.S. in 2013. Since then, the country has seen enormous growth in the number of AI patents granted each year.
| Year | China | EU and UK | U.S. | RoW | Global Total |
|---|---|---|---|---|---|
| 2010 | 307 | 137 | 984 | 571 | 1,999 |
| 2011 | 516 | 129 | 980 | 581 | 2,206 |
| 2012 | 926 | 112 | 950 | 660 | 2,648 |
| 2013 | 1,035 | 91 | 970 | 627 | 2,723 |
| 2014 | 1,278 | 97 | 1,078 | 667 | 3,120 |
| 2015 | 1,721 | 110 | 1,135 | 539 | 3,505 |
| 2016 | 1,621 | 128 | 1,298 | 714 | 3,761 |
| 2017 | 2,428 | 144 | 1,489 | 1,075 | 5,136 |
| 2018 | 4,741 | 155 | 1,674 | 1,574 | 8,144 |
| 2019 | 9,530 | 322 | 3,211 | 2,720 | 15,783 |
| 2020 | 13,071 | 406 | 5,441 | 4,455 | 23,373 |
| 2021 | 21,907 | 623 | 8,219 | 7,519 | 38,268 |
| 2022 | 35,315 | 1,173 | 12,077 | 13,699 | 62,264 |
In 2022, China was granted more patents than every other country combined.
While this suggests that the country is very active in researching the field of artificial intelligence, it doesn’t necessarily mean that China is the farthest in terms of capability.
Key Facts About AI Patents
According to CSET, AI patents relate to mathematical relationships and algorithms, which are considered abstract ideas under patent law. They can also have different meaning, depending on where they are filed.
In the U.S., AI patenting is concentrated amongst large companies including IBM, Microsoft, and Google. On the other hand, AI patenting in China is more distributed across government organizations, universities, and tech firms (e.g. Tencent).
In terms of focus area, China’s patents are typically related to computer vision, a field of AI that enables computers and systems to interpret visual data and inputs. Meanwhile America’s efforts are more evenly distributed across research fields.
Learn More About AI From Visual Capitalist
If you want to see more data visualizations on artificial intelligence, check out this graphic that shows which job departments will be impacted by AI the most.

-

 Markets1 week ago
U.S. Debt Interest Payments Reach $1 Trillion
-

 Business2 weeks ago
Charted: Big Four Market Share by S&P 500 Audits
-

 Real Estate2 weeks ago
Ranked: The Most Valuable Housing Markets in America
-

 Money2 weeks ago
Which States Have the Highest Minimum Wage in America?
-

 AI2 weeks ago
Ranked: Semiconductor Companies by Industry Revenue Share
-

 Markets2 weeks ago
Ranked: The World’s Top Flight Routes, by Revenue
-

 Demographics2 weeks ago
Population Projections: The World’s 6 Largest Countries in 2075
-

 Markets2 weeks ago
The Top 10 States by Real GDP Growth in 2023