Markets
The Pandemic Economy: What are Shoppers Buying Online During COVID-19?
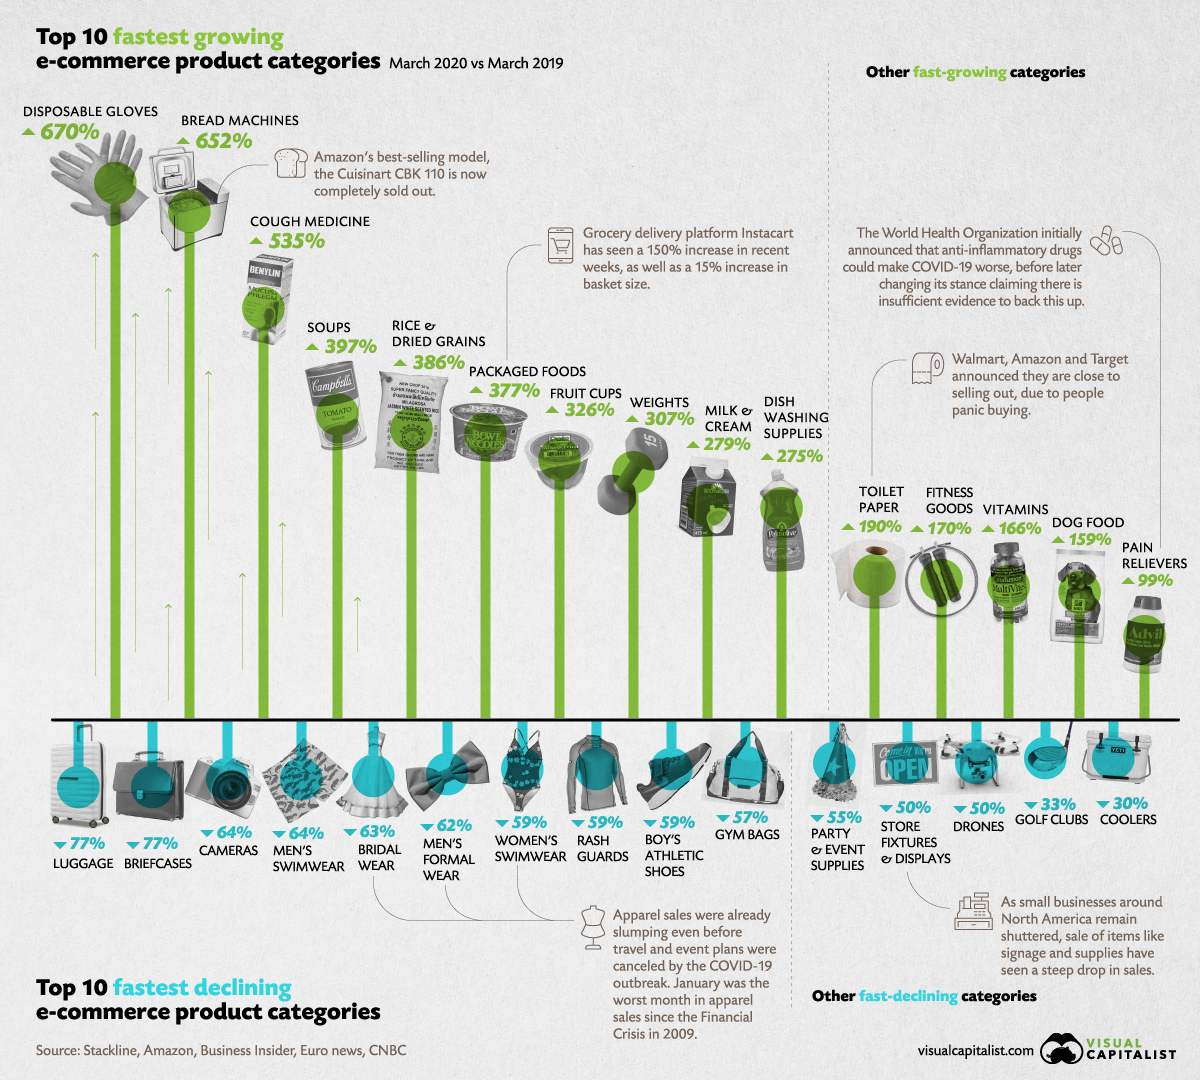


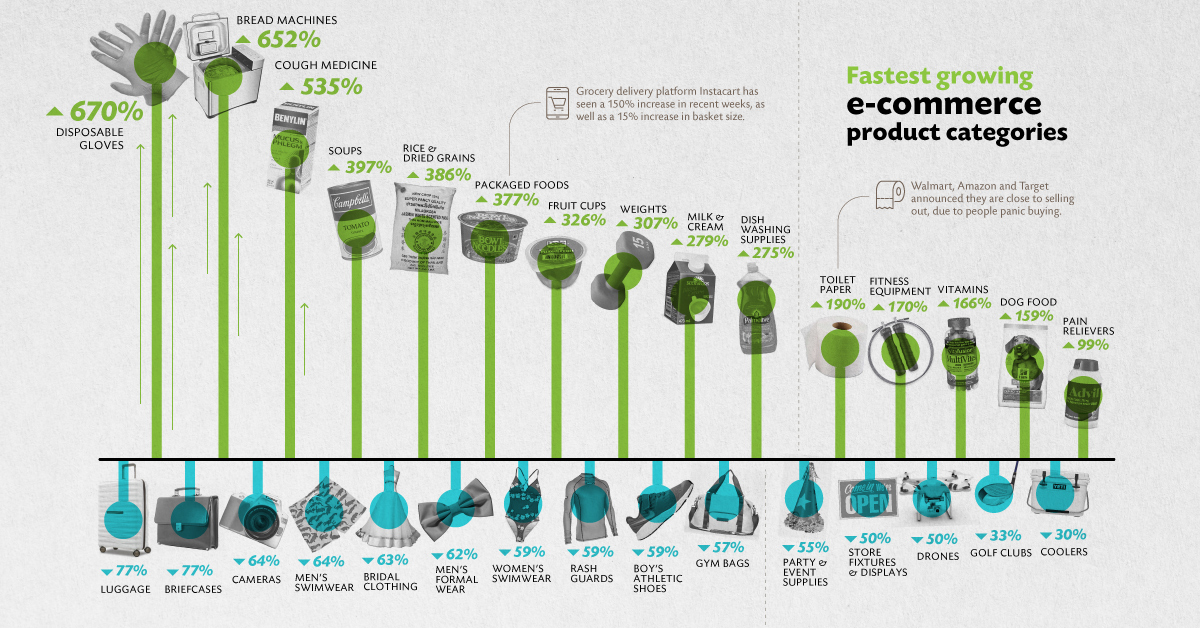
The Fastest Growing and Declining E-Commerce Categories
The COVID-19 pandemic is having a significant impact on every aspect of life, including how people shop for their necessities, and their not-so-necessities.
With online retail sales estimated to reach an eye-watering $6.5 trillion by 2023, the ecommerce sector was already booming. But since the outbreak, online shopping has been catapulted into complete overdrive. Even the largest retailers on the planet are struggling to keep up with the unprecedented consumer demand—but what exactly are people buying?
To answer this question, retail intelligence firm Stackline analyzed ecommerce sales across the U.S. and compiled a list of the fastest growing and declining ecommerce categories (March 2020 vs. March 2019) with surprising results.
The Frenzy of Buyer Behavior
As people come to terms with their new living situations, their buying behavior has adapted to suit their needs. While panic buying may have slowed in some countries, consumers continue to stock up on supplies, or “pandemic pantry products”.
Many consumers are also using their newfound time to focus on their health, with 85% of consumers taking up some kind of exercise while in social isolation, and 40% of them saying they intend to keep it up when restrictions are lifted.
These changing behaviors have resulted in a number of product categories experiencing a surge in demand — and although a lot of them are practical, others are wonderfully weird.
The Fastest Growing Categories
While the below list features several shelf-stable items, it seems as though consumers are taking matters into their own hands, with bread making machines sitting in second place and retailers selling out of their top models.
It’s clear from the list that consumers are considering positive changes to their lifestyle while in isolation, as fitness, smoking cessation, and respiratory categories are all experiencing growth.
Explore the 100 fastest growing product categories below:
| Rank | Category | % Change in March (2020 vs. 2019) |
|---|---|---|
| #1 | Disposable Gloves | 670% |
| #2 | Bread Machines | 652% |
| #3 | Cough & Cold | 535% |
| #4 | Soups | 397% |
| #5 | Dried Grains & Rice | 386% |
| #6 | Packaged Foods | 377% |
| #7 | Fruit Cups | 326% |
| #8 | Weight Training | 307% |
| #9 | Milk & Cream | 279% |
| #10 | Dishwashing Supplies | 275% |
| #11 | Paper Towels | 264% |
| #12 | Hand Soap & Sanitizer | 262% |
| #13 | Pasta | 249% |
| #14 | Vegetables | 238% |
| #15 | Flour | 238% |
| #16 | Facial Tissues | 235% |
| #17 | Allergy Medicine | 232% |
| #18 | Women’s Health | 215% |
| #19 | Cereals | 214% |
| #20 | Power Generators | 210% |
| #21 | Laundry Supplies | 200% |
| #22 | Household Cleaners | 195% |
| #23 | Soap & Body Wash | 194% |
| #24 | Toilet Paper | 190% |
| #25 | Jerky & Dried Meats | 187% |
| #26 | Chips & Pretzels | 186% |
| #27 | Crackers | 184% |
| #28 | Health Monitors | 182% |
| #29 | Popcorn | 179% |
| #30 | Computer Monitors | 172% |
| #31 | Fitness Equipment | 170% |
| #32 | Single Vitamins | 166% |
| #33 | Nut & Seed Butters | 163% |
| #34 | Cat Food | 162% |
| #35 | Fruit Snacks | 162% |
| #36 | Baby Care Products | 162% |
| #37 | Refrigerators | 160% |
| #38 | Baking Mixes | 160% |
| #39 | Toilet Accessories | 160% |
| #40 | Dog Food | 159% |
| #41 | Diapers | 154% |
| #42 | Yoga Equipment | 154% |
| #43 | Bottled Beverages | 153% |
| #44 | Baby Meals | 153% |
| #45 | Cookies | 147% |
| #46 | Digestion & Nausea | 144% |
| #47 | Snack Foods | 141% |
| #48 | Herbal Supplements | 136% |
| #49 | Cooking Oils | 135% |
| #50 | Water | 130% |
| #51 | Incontinence & Tummy | 129% |
| #52 | Mutivitamin | 126% |
| #53 | Cat Litter | 125% |
| #54 | Training Pads and Trays | 125% |
| #55 | Juices | 125% |
| #56 | Smoking Cessation | 122% |
| #57 | Dried Fruit & Raisins | 120% |
| #58 | Salt & Pepper Seasoning | 118% |
| #59 | Craft Kits & Projects | 117% |
| #60 | Batteries | 116% |
| #61 | Trash Bags | 116% |
| #62 | Nuts & Seeds | 116% |
| #63 | Hair Coloring | 115% |
| #64 | Sauce & Gravy | 115% |
| #65 | Deli Foods | 114% |
| #66 | Syrups | 114% |
| #67 | Breads & Bakery | 114% |
| #68 | Minerals | 113% |
| #69 | Condiments | 111% |
| #70 | First Aid | 108% |
| #71 | Nail Care | 108% |
| #72 | Humidifiers | 105% |
| #73 | Art Paint | 104% |
| #74 | Office Chairs | 104% |
| #75 | Deodorant | 103% |
| #76 | Jams, Jellies & Spreads | 102% |
| #77 | Coffee | 101% |
| #78 | Spices & Seasoning | 100% |
| #79 | Skin Care | 99% |
| #80 | Pain Relievers | 99% |
| #81 | Cooking Vinegars | 98% |
| #82 | Air Purifiers | 97% |
| #83 | Granola & Nutrition Bars | 97% |
| #84 | Pudding & Gelatin | 97% |
| #85 | Toy Clay & Dough | 95% |
| #86 | Single Spices | 95% |
| #87 | Bird Food & Treats | 91% |
| #88 | Lab & Science Products | 90% |
| #89 | Eczema & Psoriasis | 90% |
| #90 | Ping Pong | 89% |
| #91 | Chocolate | 86% |
| #92 | Baking Ingredients | 84% |
| #93 | Energy Supplements | 84% |
| #94 | Respiratory | 82% |
| #95 | Office Desks | 82% |
| #96 | Potty Training Supplies | 82% |
| #97 | Herbs, Spices & Seasonings | 82% |
| #98 | Keyboard & Mice | 80% |
| #99 | Body Lotion | 79% |
| #100 | Safes | 69% |
Interestingly, toilet paper has seen more growth than baby care products, and cured meats have seen more growth than water. But while some categories are experiencing a drastic increase in demand, others are slumping in the pandemic economy.
The Fastest Declining Categories
An unprecedented wave of event and vacation cancellations is having a huge impact on the products people consume. For instance, luggage and suitcases, cameras, and men’s swimwear have all seen a dip in sales.
See the full list of 100 fastest declining categories below:
| Rank | Category | % Change in March (2020 vs. 2019) |
|---|---|---|
| #1 | Luggage & Suitcases | -77% |
| #2 | Briefcases | -77% |
| #3 | Cameras | -64% |
| #4 | Men’s Swimwear | -64% |
| #5 | Bridal Clothing | -63% |
| #6 | Men's Formal Wear | -62% |
| #7 | Women’s Swimwear | -59% |
| #8 | Rash Guards | -59% |
| #9 | Boy’s Athletic Shoes | -59% |
| #10 | Gym Bags | -57% |
| #11 | Backpacks | -56% |
| #12 | Snorkelling Equipment | -56% |
| #13 | Girl’s Swimwear | -55% |
| #14 | Baseball Equipment | -55% |
| #15 | Event & Party Supplies | -55% |
| #16 | Motorcycle Protective Gear | -55% |
| #17 | Camera Bags & Cases | -54% |
| #18 | Women’s Suits & Dresses | -53% |
| #19 | Women’s Boots | -51% |
| #20 | Cargo Racks | -51% |
| #21 | Women’s Sandals | -50% |
| #22 | Drones | -50% |
| #23 | Boy's Active Clothing | -50% |
| #24 | Lunch Boxes | -50% |
| #25 | Store Fixtures & Displays | -50% |
| #26 | Automotive Mats | -50% |
| #27 | Men’s Outerwear | -49% |
| #28 | Watches & Accessories | -49% |
| #29 | Cargo Bed Covers | -48% |
| #30 | Track & Field Equipment | -48% |
| #31 | Ceiling Lighting | -47% |
| #32 | Camera Lenses | -47% |
| #33 | Girl’s Coats and Jackets | -47% |
| #34 | Women’s Hats & Caps | -47% |
| #35 | Women's Outerwear | -47% |
| #36 | Video Cameras | -46% |
| #37 | Wheels & Tires | -46% |
| #38 | Motorcycle Parts | -45% |
| #39 | Women’s Wallets | -45% |
| #40 | Shocks & Struts | -44% |
| #41 | Transmission & Parts | -44% |
| #42 | Girl’s Athletic Shoes | -44% |
| #43 | Women’s Shoes | -44% |
| #44 | Telescopes | -44% |
| #45 | Sunglasses & Eyeglasses | -43% |
| #46 | Men’s Tops | -41% |
| #47 | Video Projectors | -40% |
| #48 | Men’s Athletic Shoes | -40% |
| #49 | Marine Electronics | -40% |
| #50 | Hand Tools | -40% |
| #51 | Wine Racks | -40% |
| #52 | Men's Shoes | -40% |
| #53 | Clocks | -39% |
| #54 | Baby Girl’s Shoes | -39% |
| #55 | Bracelets | -39% |
| #56 | Men’s Boots | -39% |
| #57 | Tapestries | -39% |
| #58 | Camping Equipment | -39% |
| #59 | Men’s Bottoms | -38% |
| #60 | Cell Phones | -38% |
| #61 | Tool Storage & Organizers | -38% |
| #62 | Necklaces | -38% |
| #63 | Swimming Equipment | -37% |
| #64 | Men’s Hats & Caps | -37% |
| #65 | Girl’s Shoes | -37% |
| #66 | Industrial Tools | -36% |
| #67 | Juicers | -36% |
| #68 | Desktops | -35% |
| #69 | Classroom Furniture | -35% |
| #70 | Bar & Wine Tools | -35% |
| #71 | Glassware & Drinkware | -35% |
| #72 | Musical Instruments | -34% |
| #73 | Power Winches | -34% |
| #74 | Home Bar Furniture | -34% |
| #75 | Office Storage Supplies | -34% |
| #76 | Girl's Active Clothing | -34% |
| #77 | Women’s Tops | -34% |
| #78 | Braces, Splints & Supports | -34% |
| #79 | Car Anti-theft | -34% |
| #80 | Rings | -34% |
| #81 | Blankets & Quilts | -33% |
| #82 | Women's Athletic Shoes | -33% |
| #83 | Kitchen Sinks | -33% |
| #84 | Golf Clubs | -33% |
| #85 | Equestrian Equipment | -33% |
| #86 | GPS & Navigation | -32% |
| #87 | Recording Supplies | -32% |
| #88 | Home Audio | -32% |
| #89 | Boy's Accessories | -32% |
| #90 | Earrings | -32% |
| #91 | Dining Sets | -31% |
| #92 | Calculators | -31% |
| #93 | Boy's Shoes | -31% |
| #94 | Volleyball Equipment | -31% |
| #95 | Strollers | -31% |
| #96 | Coolers | -30% |
| #97 | Sanders & Grinders | -30% |
| #98 | Men's Activewear | -29% |
| #99 | Living Room Furniture | -29% |
| #100 | Climbing & Hiking Bags | -28% |
Regardless of which list a product falls under, it is clear that the pandemic has impacted retailers of every kind in both positive and negative ways.
The New Normal?
Officially the world’s largest retailer, Amazon has announced it can no longer keep up with consumer demand. As a result, it will be delaying the delivery of non-essential items, or in some cases not taking orders for non-essentials at all.
This presents a double-edged sword, as the new dynamic that is bringing some retailers unprecedented demand could also bring about an untimely end for others.
Meanwhile, the question remains: will this drastic change in consumer behavior stabilize once we flatten the curve, or is this our new normal?


Markets
U.S. Debt Interest Payments Reach $1 Trillion
U.S. debt interest payments have surged past the $1 trillion dollar mark, amid high interest rates and an ever-expanding debt burden.


U.S. Debt Interest Payments Reach $1 Trillion
This was originally posted on our Voronoi app. Download the app for free on iOS or Android and discover incredible data-driven charts from a variety of trusted sources.
The cost of paying for America’s national debt crossed the $1 trillion dollar mark in 2023, driven by high interest rates and a record $34 trillion mountain of debt.
Over the last decade, U.S. debt interest payments have more than doubled amid vast government spending during the pandemic crisis. As debt payments continue to soar, the Congressional Budget Office (CBO) reported that debt servicing costs surpassed defense spending for the first time ever this year.
This graphic shows the sharp rise in U.S. debt payments, based on data from the Federal Reserve.
A $1 Trillion Interest Bill, and Growing
Below, we show how U.S. debt interest payments have risen at a faster pace than at another time in modern history:
| Date | Interest Payments | U.S. National Debt |
|---|---|---|
| 2023 | $1.0T | $34.0T |
| 2022 | $830B | $31.4T |
| 2021 | $612B | $29.6T |
| 2020 | $518B | $27.7T |
| 2019 | $564B | $23.2T |
| 2018 | $571B | $22.0T |
| 2017 | $493B | $20.5T |
| 2016 | $460B | $20.0T |
| 2015 | $435B | $18.9T |
| 2014 | $442B | $18.1T |
| 2013 | $425B | $17.2T |
| 2012 | $417B | $16.4T |
| 2011 | $433B | $15.2T |
| 2010 | $400B | $14.0T |
| 2009 | $354B | $12.3T |
| 2008 | $380B | $10.7T |
| 2007 | $414B | $9.2T |
| 2006 | $387B | $8.7T |
| 2005 | $355B | $8.2T |
| 2004 | $318B | $7.6T |
| 2003 | $294B | $7.0T |
| 2002 | $298B | $6.4T |
| 2001 | $318B | $5.9T |
| 2000 | $353B | $5.7T |
| 1999 | $353B | $5.8T |
| 1998 | $360B | $5.6T |
| 1997 | $368B | $5.5T |
| 1996 | $362B | $5.3T |
| 1995 | $357B | $5.0T |
| 1994 | $334B | $4.8T |
| 1993 | $311B | $4.5T |
| 1992 | $306B | $4.2T |
| 1991 | $308B | $3.8T |
| 1990 | $298B | $3.4T |
| 1989 | $275B | $3.0T |
| 1988 | $254B | $2.7T |
| 1987 | $240B | $2.4T |
| 1986 | $225B | $2.2T |
| 1985 | $219B | $1.9T |
| 1984 | $205B | $1.7T |
| 1983 | $176B | $1.4T |
| 1982 | $157B | $1.2T |
| 1981 | $142B | $1.0T |
| 1980 | $113B | $930.2B |
| 1979 | $96B | $845.1B |
| 1978 | $84B | $789.2B |
| 1977 | $69B | $718.9B |
| 1976 | $61B | $653.5B |
| 1975 | $55B | $576.6B |
| 1974 | $50B | $492.7B |
| 1973 | $45B | $469.1B |
| 1972 | $39B | $448.5B |
| 1971 | $36B | $424.1B |
| 1970 | $35B | $389.2B |
| 1969 | $30B | $368.2B |
| 1968 | $25B | $358.0B |
| 1967 | $23B | $344.7B |
| 1966 | $21B | $329.3B |
Interest payments represent seasonally adjusted annual rate at the end of Q4.
At current rates, the U.S. national debt is growing by a remarkable $1 trillion about every 100 days, equal to roughly $3.6 trillion per year.
As the national debt has ballooned, debt payments even exceeded Medicaid outlays in 2023—one of the government’s largest expenditures. On average, the U.S. spent more than $2 billion per day on interest costs last year. Going further, the U.S. government is projected to spend a historic $12.4 trillion on interest payments over the next decade, averaging about $37,100 per American.
Exacerbating matters is that the U.S. is running a steep deficit, which stood at $1.1 trillion for the first six months of fiscal 2024. This has accelerated due to the 43% increase in debt servicing costs along with a $31 billion dollar increase in defense spending from a year earlier. Additionally, a $30 billion increase in funding for the Federal Deposit Insurance Corporation in light of the regional banking crisis last year was a major contributor to the deficit increase.
Overall, the CBO forecasts that roughly 75% of the federal deficit’s increase will be due to interest costs by 2034.

-

 Maps2 weeks ago
Mapped: Average Wages Across Europe
-

 Money1 week ago
Which States Have the Highest Minimum Wage in America?
-

 Real Estate1 week ago
Ranked: The Most Valuable Housing Markets in America
-

 Markets1 week ago
Charted: Big Four Market Share by S&P 500 Audits
-

 AI1 week ago
The Stock Performance of U.S. Chipmakers So Far in 2024
-

 Automotive2 weeks ago
Almost Every EV Stock is Down After Q1 2024
-

 Money2 weeks ago
Where Does One U.S. Tax Dollar Go?
-

 Green2 weeks ago
Ranked: Top Countries by Total Forest Loss Since 2001