Markets
Shapes of Recovery: When Will the Global Economy Bounce Back?
The Shape of Economic Recovery, According to CEOs
Is the glass half full, or half empty?
Whenever the economy is put through the ringer, levels of optimism and pessimism about its potential recovery can vary greatly. The current state mid-pandemic is no exception.
This graphic first details the various shapes that economic recovery can take, and what they mean. We then dive into which of the four scenarios are perceived the most likely to occur, based on predictions made by CEOs from around the world.
The ABCs of Economic Recovery
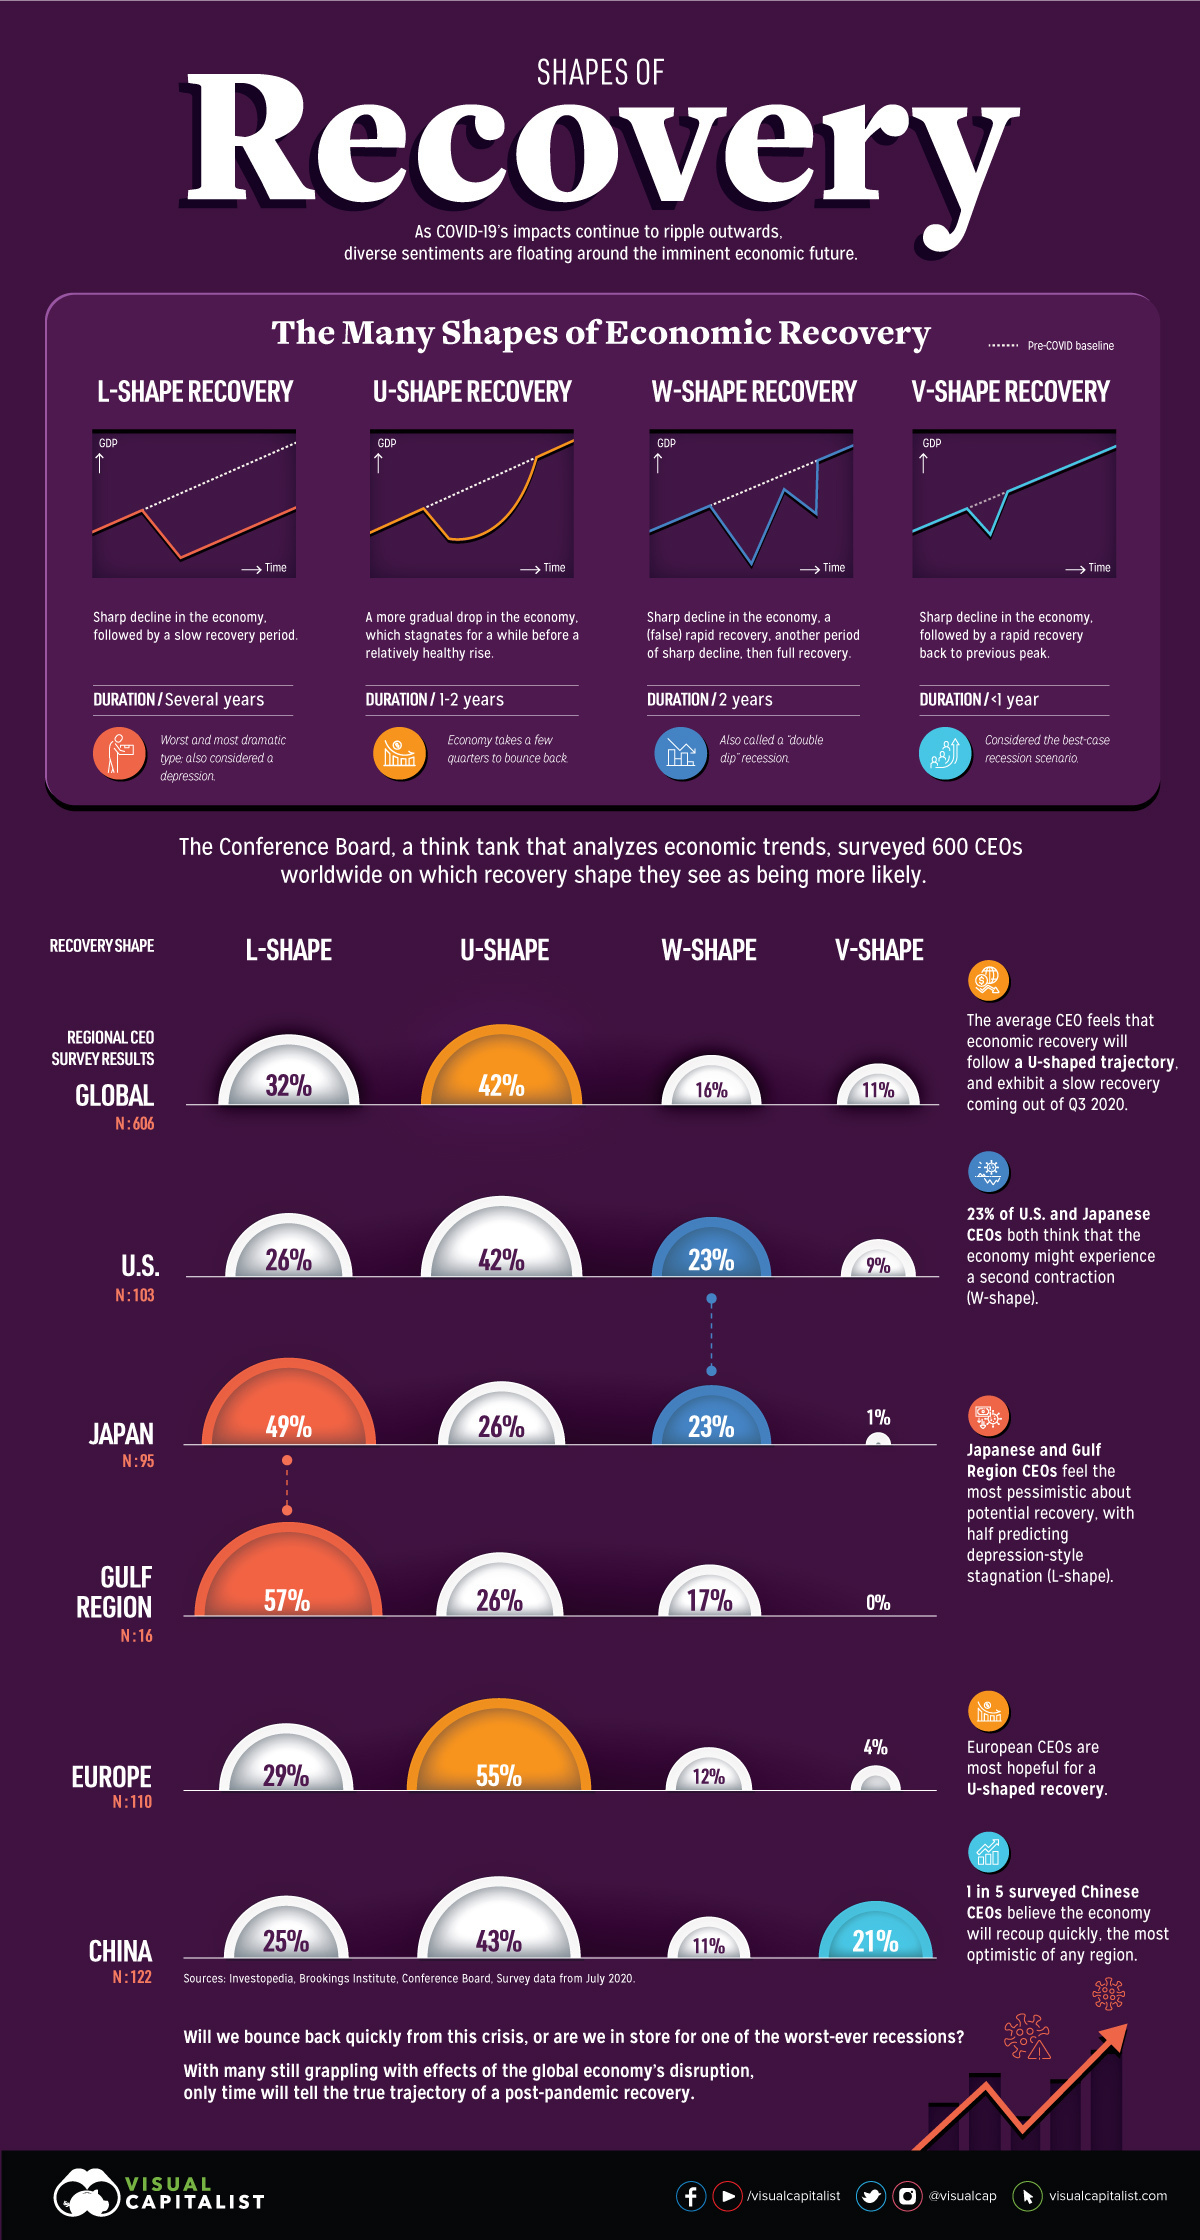
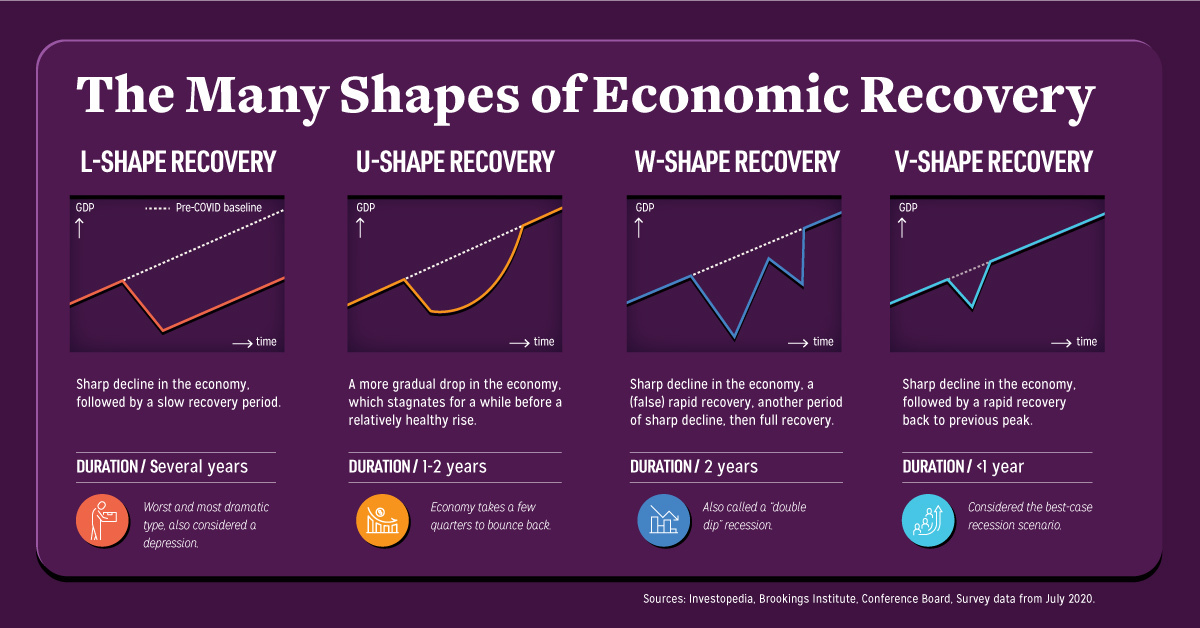
Economic recovery comes in four distinct shapes—L, U, W, and V. Here’s what each of these are characterized by, and how long they typically last.
- L-shape
This scenario exhibits a sharp decline in the economy, followed by a slow recovery period. It’s often punctuated by persistent unemployment, taking several years to recoup back to previous levels. - U-shape
Also referred to as the “Nike Swoosh” recovery, in this scenario the economy stagnates for a few quarters and up to two years, before experiencing a relatively healthy rise back to its previous peak. - W-shape
This scenario offers a tempting promise of recovery, dips back into a sharp decline, and then finally enters the full recovery period of up to two years. This is also known as a “double-dip recession“, similar to what was seen in the early 1980s. - V-shape
In this best-case scenario, the sharp decline in the economy is quickly and immediately followed by a rapid recovery back to its previous peak in less than a year, bolstered especially by economic measures and strong consumer spending.
Another scenario not covered here is the Z-shape, defined by a boom after pent-up demand. However, it doesn’t quite make the cut for the present pandemic situation, as it’s considered even more optimistic than a V-shaped recovery.
Depending on who you ask, the sentiments about a post-pandemic recovery differ greatly. So which of these potential scenarios are we really dealing with?
How CEOs Think The Economy Could Recover
The think tank The Conference Board surveyed over 600 CEOs worldwide, to uncover how they feel about the likelihood of each recovery shape playing out in the near future.
The average CEO felt that economic recovery will follow a U-shaped trajectory (42%), eventually exhibiting a slow recovery coming out of Q3 of 2020—a moderately optimistic view.
However, geography seems to play a part in these CEO estimates of how rapidly things might revert back to “normal”. Over half of European CEOs (55%) project a U-shaped recovery, which is significantly higher than the global average. This could be because recent COVID-19 hotspots have mostly shifted to other areas outside of the continent, such as the U.S., India, and Brazil.
Here’s how responses vary by region:
| Region | L-shape | U-shape | W-shape | V-shape |
|---|---|---|---|---|
| Global (N=606) | 32% | 42% | 16% | 11% |
| U.S. (N=103) | 26% | 42% | 23% | 9% |
| Europe (N=110) | 29% | 55% | 12% | 4% |
| China (N=122) | 25% | 43% | 11% | 21% |
| Japan (N=95) | 49% | 26% | 23% | 1% |
| Gulf Region (N=16) | 57% | 26% | 17% | - |
In the U.S. and Japan, 23% of CEOs expect a second contraction to occur, meaning that economic activity could undergo a W-shape recovery. Both countries have experienced quite the hit, but there are stark differences in their resultant unemployment rates—15% at its peak in the U.S., but a mere 2.6% in Japan.
In China, 21% of CEOs—or one in five—anticipate a quick, V-shaped recovery. This is the most optimistic outlook of any region, and with good reason. Although economic growth contracted by 6.8% in the first quarter, China has bounced back to a 3.2% growth rate in the second quarter.
Finally, Gulf Region CEOs feel the most pessimistic about potential economic recovery. In the face of an oil shock, 57% predict the economy will see an L-shaped recovery that could result in depression-style stagnation in years to come.
The Economic Recovery, According to Risk Analysts
At the end of the day, CEO opinions are all over the map on the potential shape of the economic recovery—and this variance likely stems from geography, cultural biases, and of course the status of their own individual countries and industries.
Despite this, portions of all cohorts saw some possibility of an extended and drawn-out recovery. Earlier in the year, risk analysts surveyed by the World Economic Forum had similar thoughts, projecting a prolonged recession as the top risk of the post-COVID fallout.
It remains to be seen whether this will ultimately indeed be the trajectory we’re in store for.


Economy
Economic Growth Forecasts for G7 and BRICS Countries in 2024
The IMF has released its economic growth forecasts for 2024. How do the G7 and BRICS countries compare?


G7 & BRICS Real GDP Growth Forecasts for 2024
The International Monetary Fund’s (IMF) has released its real gross domestic product (GDP) growth forecasts for 2024, and while global growth is projected to stay steady at 3.2%, various major nations are seeing declining forecasts.
This chart visualizes the 2024 real GDP growth forecasts using data from the IMF’s 2024 World Economic Outlook for G7 and BRICS member nations along with Saudi Arabia, which is still considering an invitation to join the bloc.
Get the Key Insights of the IMF’s World Economic Outlook
Want a visual breakdown of the insights from the IMF’s 2024 World Economic Outlook report?
This visual is part of a special dispatch of the key takeaways exclusively for VC+ members.
Get the full dispatch of charts by signing up to VC+.
Mixed Economic Growth Prospects for Major Nations in 2024
Economic growth projections by the IMF for major nations are mixed, with the majority of G7 and BRICS countries forecasted to have slower growth in 2024 compared to 2023.
Only three BRICS-invited or member countries, Saudi Arabia, the UAE, and South Africa, have higher projected real GDP growth rates in 2024 than last year.
| Group | Country | Real GDP Growth (2023) | Real GDP Growth (2024P) |
|---|---|---|---|
| G7 | 🇺🇸 U.S. | 2.5% | 2.7% |
| G7 | 🇨🇦 Canada | 1.1% | 1.2% |
| G7 | 🇯🇵 Japan | 1.9% | 0.9% |
| G7 | 🇫🇷 France | 0.9% | 0.7% |
| G7 | 🇮🇹 Italy | 0.9% | 0.7% |
| G7 | 🇬🇧 UK | 0.1% | 0.5% |
| G7 | 🇩🇪 Germany | -0.3% | 0.2% |
| BRICS | 🇮🇳 India | 7.8% | 6.8% |
| BRICS | 🇨🇳 China | 5.2% | 4.6% |
| BRICS | 🇦🇪 UAE | 3.4% | 3.5% |
| BRICS | 🇮🇷 Iran | 4.7% | 3.3% |
| BRICS | 🇷🇺 Russia | 3.6% | 3.2% |
| BRICS | 🇪🇬 Egypt | 3.8% | 3.0% |
| BRICS-invited | 🇸🇦 Saudi Arabia | -0.8% | 2.6% |
| BRICS | 🇧🇷 Brazil | 2.9% | 2.2% |
| BRICS | 🇿🇦 South Africa | 0.6% | 0.9% |
| BRICS | 🇪🇹 Ethiopia | 7.2% | 6.2% |
| 🌍 World | 3.2% | 3.2% |
China and India are forecasted to maintain relatively high growth rates in 2024 at 4.6% and 6.8% respectively, but compared to the previous year, China is growing 0.6 percentage points slower while India is an entire percentage point slower.
On the other hand, four G7 nations are set to grow faster than last year, which includes Germany making its comeback from its negative real GDP growth of -0.3% in 2023.
Faster Growth for BRICS than G7 Nations
Despite mostly lower growth forecasts in 2024 compared to 2023, BRICS nations still have a significantly higher average growth forecast at 3.6% compared to the G7 average of 1%.
While the G7 countries’ combined GDP is around $15 trillion greater than the BRICS nations, with continued higher growth rates and the potential to add more members, BRICS looks likely to overtake the G7 in economic size within two decades.
BRICS Expansion Stutters Before October 2024 Summit
BRICS’ recent expansion has stuttered slightly, as Argentina’s newly-elected president Javier Milei declined its invitation and Saudi Arabia clarified that the country is still considering its invitation and has not joined BRICS yet.
Even with these initial growing pains, South Africa’s Foreign Minister Naledi Pandor told reporters in February that 34 different countries have submitted applications to join the growing BRICS bloc.
Any changes to the group are likely to be announced leading up to or at the 2024 BRICS summit which takes place October 22-24 in Kazan, Russia.
Get the Full Analysis of the IMF’s Outlook on VC+
This visual is part of an exclusive special dispatch for VC+ members which breaks down the key takeaways from the IMF’s 2024 World Economic Outlook.
For the full set of charts and analysis, sign up for VC+.

-

 Markets1 week ago
U.S. Debt Interest Payments Reach $1 Trillion
-

 Markets2 weeks ago
Ranked: The Most Valuable Housing Markets in America
-

 Money2 weeks ago
Which States Have the Highest Minimum Wage in America?
-

 AI2 weeks ago
Ranked: Semiconductor Companies by Industry Revenue Share
-

 Markets2 weeks ago
Ranked: The World’s Top Flight Routes, by Revenue
-

 Countries2 weeks ago
Population Projections: The World’s 6 Largest Countries in 2075
-

 Markets2 weeks ago
The Top 10 States by Real GDP Growth in 2023
-

 Money2 weeks ago
The Smallest Gender Wage Gaps in OECD Countries