Demographics
Ranking U.S. Generations on Their Power and Influence Over Society

Introducing our new index, which ranks U.S. generations on their economic, political, and cultural influence.


Which U.S. Generation has the Most Power and Influence?
We’re on the cusp of one of the most impactful generational shifts in history.
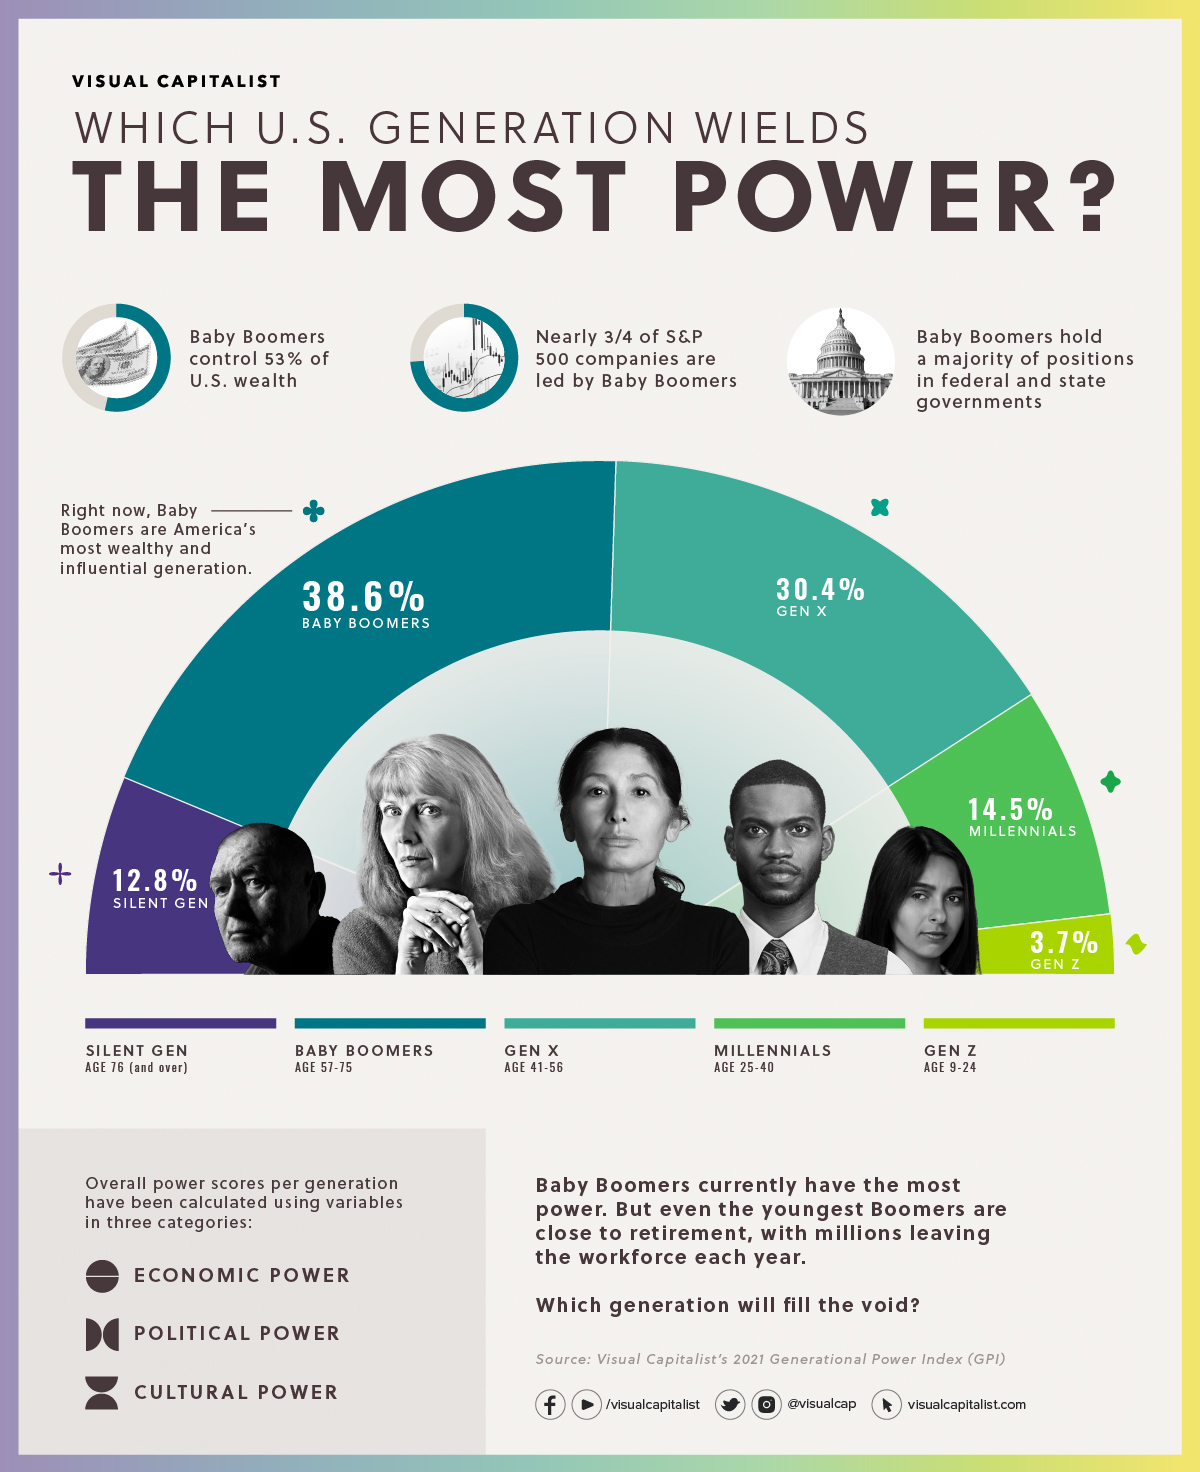
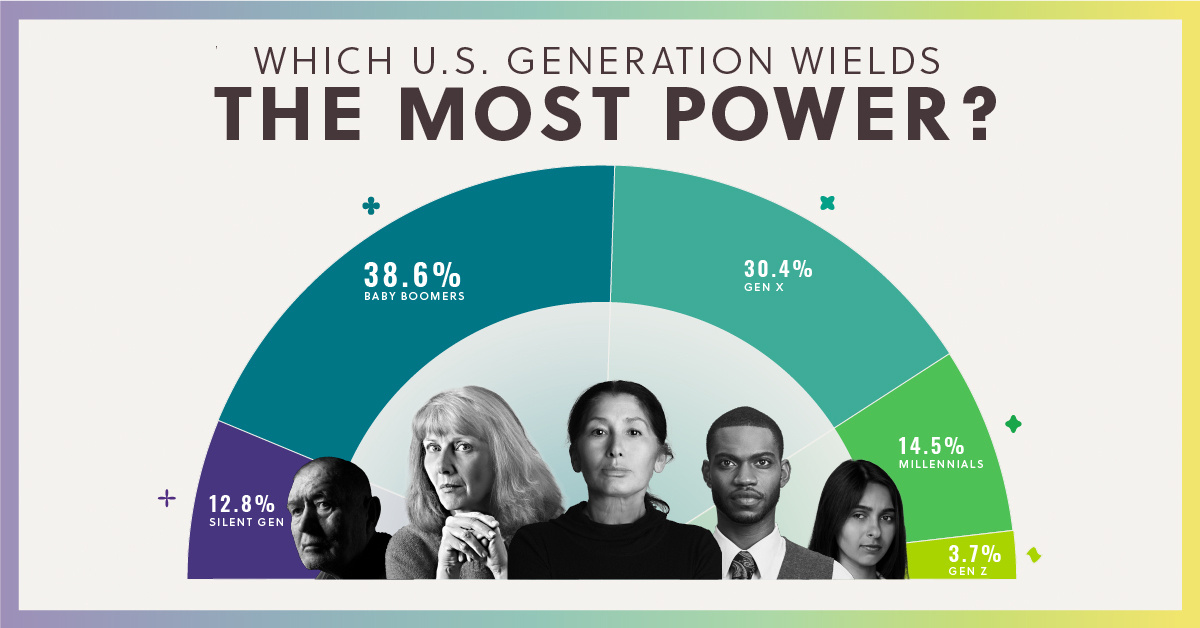
As it stands, the Baby Boomers (born 1946-1964) are America’s most wealthy and influential generation. But even the youngest Boomers are close to retirement, with millions leaving the workforce every year. As Baby Boomers pass the torch, which generation will take their place as America’s most powerful?
In our inaugural Generational Power Index (GPI) for 2021, we’ve attempted to quantify how much power and influence each generation holds in American society, and what that means for the near future.
Download the Generational Power Report (.pdf)

Generation and Power, Defined
Before diving into the results of the first GPI, it’s important to explain how we’ve chosen to define both generations and power.
Here’s the breakdown of how we categorized each generation, along with their age ranges and birth years.
| Generation | Age range (years) | Birth year range |
|---|---|---|
| The Silent Generation | 76 and over | 1928-1945 |
| Baby Boomers | 57-75 | 1946-1964 |
| Gen X | 41-56 | 1965-1980 |
| Millennials | 25-40 | 1981-1996 |
| Gen Z | 9-24 | 1997-2012 |
| Gen Alpha | 8 and below | 2013-present |
The above age brackets for each generation aren’t universally accepted. However, since our report largely focuses on U.S. data, we went with the most widely cited definitions, used by establishments such as Pew Research Center and the U.S. Federal Reserve.
To measure power, we considered a variety of factors that fell under three main categories:
- Economic Power
- Political Power
- Cultural Power
We’ll dive deeper into each category, and which generations dominated each one, below.
Overall Power, By Generation
Baby Boomers lead the pack when it comes to overall generational power, capturing 38.6%.
| Generation | Overall Power Share |
|---|---|
| The Silent Generation | 12.8% |
| Baby Boomers | 38.6% |
| Gen X | 30.4% |
| Millennials | 14.5% |
| Gen Z | 3.7% |
| Gen Alpha | 0.0% |
| Total | 100.0% |
While Boomers hold the largest share of power, it’s interesting to note that they only make up 21.8% of the total U.S. population.
Gen X comes in second place, capturing 30.4% of power, while Gen Z ranks last, snagging a mere 3.7%. Gen Alpha has yet to score on the ranking, but keep in mind that the oldest members of this generation will only be eight years old this year—they haven’t even reached double digits yet.
Generational Power: Economics
Considering that Baby Boomers hold nearly 53% of all U.S. household wealth, it makes sense that they dominate when it comes to our measurement of Economic Power.

At 43.4%, the GPI shows that Boomers hold more economic influence than Gen X, Millennials, and Gen Z combined. They make up a majority of business leaders in the U.S., and hold 42% of billionaire wealth in America.
Timing plays a role in the economic prosperity of Baby Boomers. They grew up in a post-WWII era, and spent their primary working years in a relatively stable, prosperous economy.
In contrast, Millennials entered the workforce during the Great Recession and have seen only tenuous economic and wage growth, impacting their ability to accumulate wealth. Combine this with crippling amounts of student debt, and it’s no surprise that Millennials have nearly 50% less wealth than other generations (Boomers, Gen X) at a comparable age.
Generational Power: Political
In addition to holding the most Economic Power in the GPI, Baby Boomers also rank number one when it comes to Political Power.
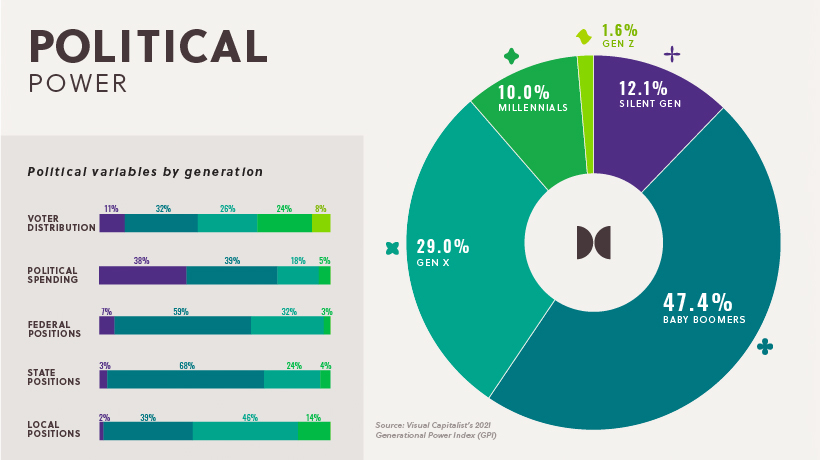
Boomers capture 47.4% of political influence. This generation accounts for 32% of all U.S. voters, and holds the majority of federal and state positions. For instance, 68% of U.S. senators are Baby Boomers.
Political spending on election campaigns and lobbying predominantly comes from Boomers, too. When it comes to money spent on lobbying, we found that 60% of the top 20 spenders were from organizations led by Baby Boomers.
In contrast, Millennials and Gen Zers barely make a splash in the political realm. That said, in the coming years, it’s estimated that the combined voting power of Millennials and Gen Z will see immense growth, rising from 32% of voters in 2020 up to 55% by 2036.
Cultural Power
There is one category where other generations gave Boomers a run for their money, which is in Cultural Power.
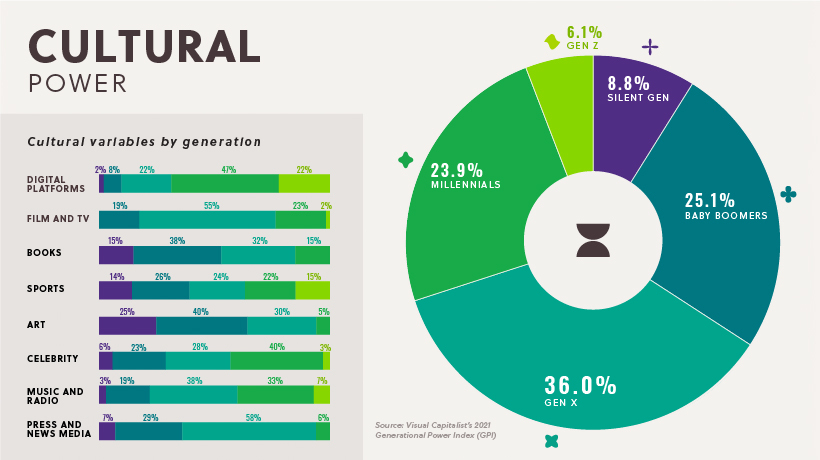
In this category, it’s actually Gen X that leads the pack, capturing 36.0% of Cultural Power. Gen X is especially dominant in press and news media—over half of America’s largest news corporations have a Gen Xer as their CEO, and a majority of the most influential news personalities are also members of Gen X.
Despite a strong showing in our culture category, Gen X falls short in one key variable we looked at—the digital realm. On digital platforms, Millennials dominate when it comes to both users and content creators, and Gen Z has growing influence here as well.
The Future of Generational Power
Generational power is not stagnant, and it ebbs and flows over time.
As this process naturally plays out, our new Generational Power Index and the coinciding annual report will aim to help quantify future shifts in power each year, while also highlighting the key stories that exemplify these new developments.
For a full methodology of how we built the Generational Power Index, see pages 28-30 in the report PDF. This is the first year of the report, and any feedback is welcomed.


Demographics
The Smallest Gender Wage Gaps in OECD Countries
Which OECD countries have the smallest gender wage gaps? We look at the 10 countries with gaps lower than the average.


The Smallest Gender Pay Gaps in OECD Countries
This was originally posted on our Voronoi app. Download the app for free on iOS or Android and discover incredible data-driven charts from a variety of trusted sources.
Among the 38 member countries in the Organization for Economic Cooperation and Development (OECD), several have made significant strides in addressing income inequality between men and women.
In this graphic we’ve ranked the OECD countries with the 10 smallest gender pay gaps, using the latest data from the OECD for 2022.
The gender pay gap is calculated as the difference between median full-time earnings for men and women divided by the median full-time earnings of men.
Which Countries Have the Smallest Gender Pay Gaps?
Luxembourg’s gender pay gap is the lowest among OECD members at only 0.4%—well below the OECD average of 11.6%.
| Rank | Country | Percentage Difference in Men's & Women's Full-time Earnings |
|---|---|---|
| 1 | 🇱🇺 Luxembourg | 0.4% |
| 2 | 🇧🇪 Belgium | 1.1% |
| 3 | 🇨🇷 Costa Rica | 1.4% |
| 4 | 🇨🇴 Colombia | 1.9% |
| 5 | 🇮🇪 Ireland | 2.0% |
| 6 | 🇭🇷 Croatia | 3.2% |
| 7 | 🇮🇹 Italy | 3.3% |
| 8 | 🇳🇴 Norway | 4.5% |
| 9 | 🇩🇰 Denmark | 5.8% |
| 10 | 🇵🇹 Portugal | 6.1% |
| OECD Average | 11.6% |
Notably, eight of the top 10 countries with the smallest gender pay gaps are located in Europe, as labor equality laws designed to target gender differences have begun to pay off.
The two other countries that made the list were Costa Rica (1.4%) and Colombia (1.9%), which came in third and fourth place, respectively.
How Did Luxembourg (Nearly) Eliminate its Gender Wage Gap?
Luxembourg’s virtually-non-existent gender wage gap in 2020 can be traced back to its diligent efforts to prioritize equal pay. Since 2016, firms that have not complied with the Labor Code’s equal pay laws have been subjected to penalizing fines ranging from €251 to €25,000.
Higher female education rates also contribute to the diminishing pay gap, with Luxembourg tied for first in the educational attainment rankings of the World Economic Forum’s Global Gender Gap Index Report for 2023.
See More Graphics about Demographics and Money
While these 10 countries are well below the OECD’s average gender pay gap of 11.6%, many OECD member countries including the U.S. are significantly above the average. To see the full list of the top 10 OECD countries with the largest gender pay gaps, check out this visualization.

-

 Mining2 weeks ago
Charted: The Value Gap Between the Gold Price and Gold Miners
-

 Real Estate1 week ago
Ranked: The Most Valuable Housing Markets in America
-

 Business1 week ago
Charted: Big Four Market Share by S&P 500 Audits
-

 AI1 week ago
The Stock Performance of U.S. Chipmakers So Far in 2024
-

 Misc1 week ago
Almost Every EV Stock is Down After Q1 2024
-

 Money2 weeks ago
Where Does One U.S. Tax Dollar Go?
-

 Green2 weeks ago
Ranked: Top Countries by Total Forest Loss Since 2001
-

 Real Estate2 weeks ago
Visualizing America’s Shortage of Affordable Homes