Markets
Ranked: Which NHL Team Takes Home the Most Revenue?
![]() See this visualization first on the Voronoi app.
See this visualization first on the Voronoi app.
Which NHL Team Takes Home the Most Revenues?
This was originally posted on our Voronoi app. Download the app for free on iOS or Android and discover incredible data-driven charts from a variety of trusted sources.
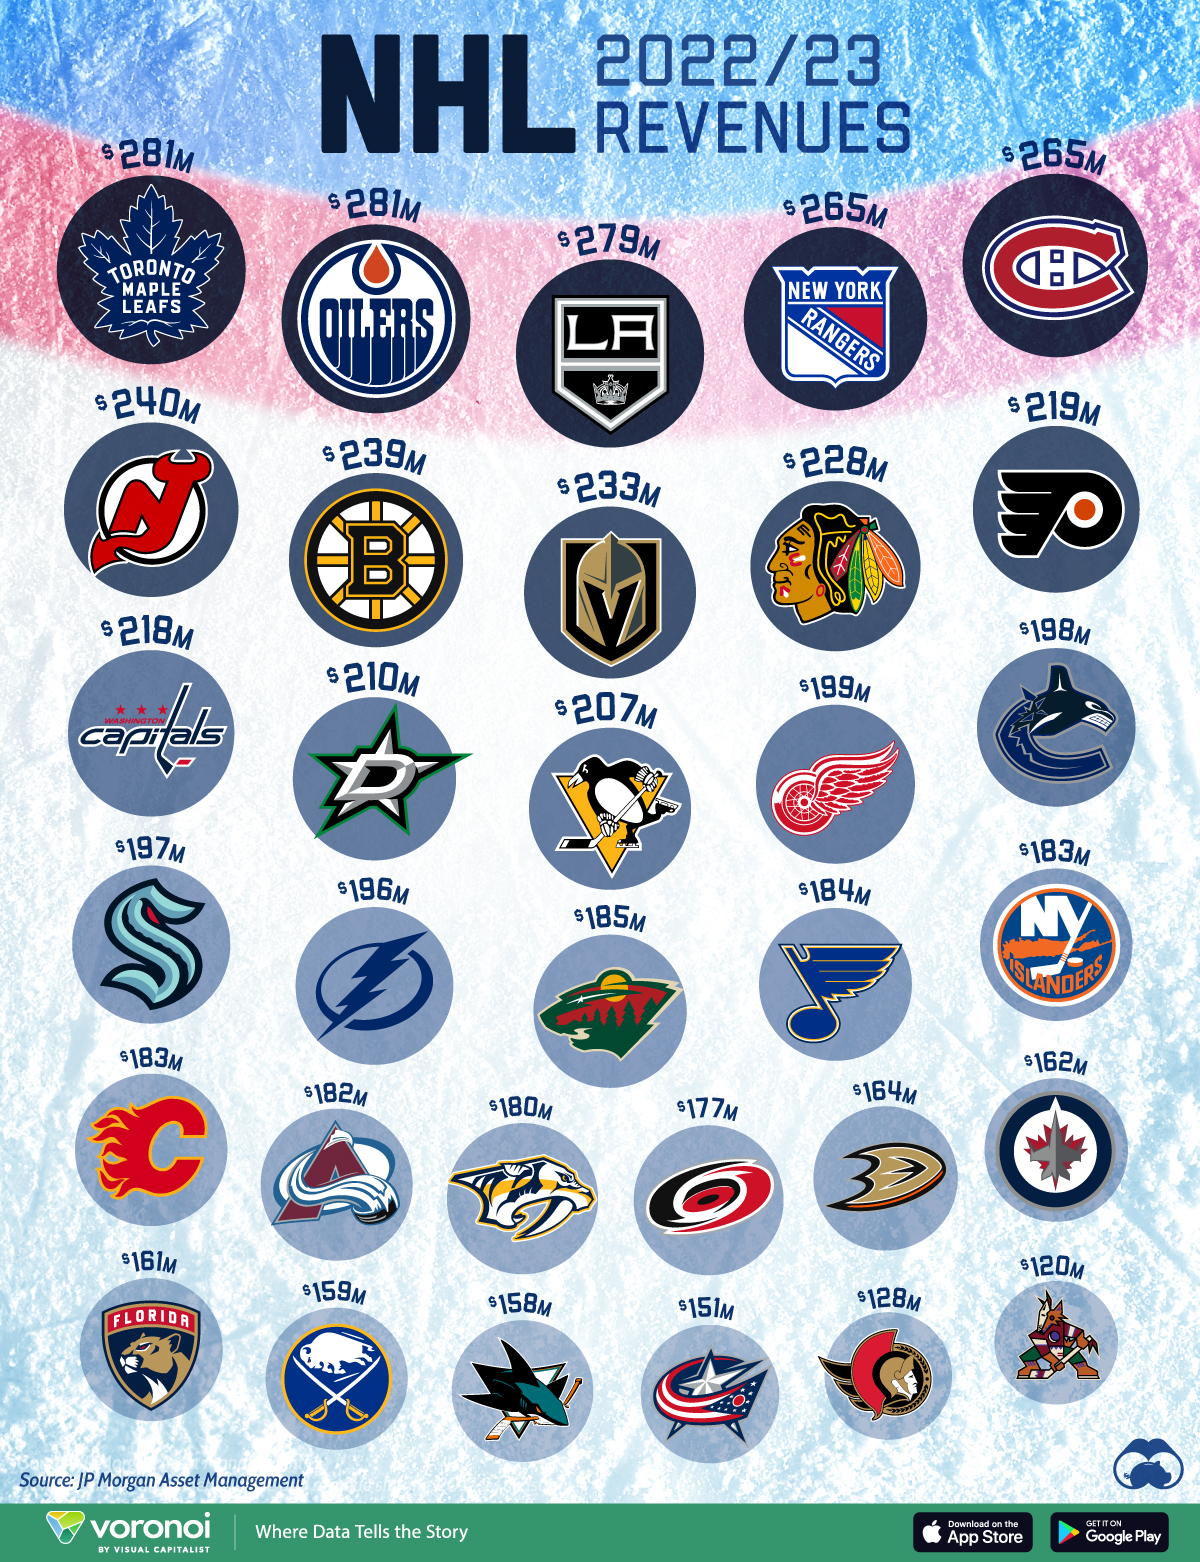
This graphic shows every NHL team’s revenue from the 2022/23 season using data from Forbes, compiled by JP Morgan Asset Management.
Ranked: The Highest-Earning NHL Teams
As the final round of the Stanley Cup Playoffs wears on, two teams on different ends of the revenue spectrum face off.
Despite representing a much smaller city than the other teams at the top of the ranking, the Edmonton Oilers have the second highest revenue in the league at $281 million. The Oilers have seen the fastest revenue growth over the past five years (13%) as the team has improved.
| Team | 2022-23 Season Revenue | Valuation |
|---|---|---|
| Toronto Maple Leafs | $281M | $2.8B |
| Edmonton Oilers | $281M | $1.9B |
| Los Angeles Kings | $279M | $2.0B |
| New York Rangers | $265M | $2.7B |
| Montreal Canadiens | $265M | $2.3B |
| New Jersey Devils | $240M | $1.5B |
| Boston Bruins | $239M | $1.9B |
| Vegas Golden Knights | $233M | $1.1B |
| Chicago Blackhawks | $228M | $1.9B |
| Philadelphia Flyers | $219M | $1.7B |
| Washington Capitals | $218M | $1.6B |
| Dallas Stars | $210M | $1.1B |
| Pittsburgh Penguins | $207M | $1.2B |
| Detroit Red Wings | $199M | $1.2B |
| Vancouver Canucks | $198M | $1.3B |
| Seattle Kraken | $197M | $1.2B |
| Tampa Bay Lightning | $196M | $1.3B |
| Minnesota Wild | $185M | $1.1B |
| St Louis Blues | $184M | $1.0B |
| New York Islanders | $183M | $1.6B |
| Calgary Flames | $183M | $1.1B |
| Colorado Avalanche | $182M | $1.2B |
| Nashville Predators | $180M | $1.0B |
| Carolina Hurricanes | $177M | $0.8B |
| Anaheim Ducks | $164M | $0.9B |
| Winnipeg Jets | $162M | $0.8B |
| Florida Panthers | $161M | $0.8B |
| Buffalo Sabres | $159M | $0.8B |
| San Jose Sharks | $158M | $0.9B |
| Columbus Blue Jackets | $151M | $0.8B |
| Ottawa Senators | $128M | $1.0B |
| Arizona Coyotes | $120M | $0.5B |
In the 2022/23 season, the Florida Panthers pulled off a major upset in the first round of the playoffs and fought their way to the finals before losing to the Vegas Golden Knights.
Despite the success last season, the Panthers still find themselves in the bottom six in this ranking, with $161 million in revenue. The team also has the second lowest operating income in the league, after Ottawa. Florida is an emerging hockey market though, with revenue increasing 9% over the past five years.
Other Hockey Revenue Highlights
- Along with the Oilers, the Toronto Maple Leafs sit at the top of the revenue ranking. There is a key difference though: the Maple Leafs have a higher valuation-to-revenue multiple (10x vs 6.6x).
- Professional hockey remains attractive to advertisers. In the 2022/23 season, team-specific sponsorship revenue was 36% higher than in 2018/19.
- The team with the lowest revenue, the Arizona Coyotes, will be moving to Utah next season.

Markets
The Stocks Driving S&P 500 Returns in 2024
We show the top 10 S&P 500 stocks that are fueling the market’s rally as the index hovers near record-highs.

The Stocks Driving S&P 500 Returns in 2024
This was originally posted on our Voronoi app. Download the app for free on iOS or Android and discover incredible data-driven charts from a variety of trusted sources.
The S&P 500 is sitting at near-record highs, returning 15% year-to-date as of June 26, 2024.
Today, a limited number of stocks are powering the stock market’s rally as investors pour money into companies that are advancing AI technologies. As share prices skyrocket, many wonder if company valuations are overheated—or if they are supported by strong corporate fundamentals.
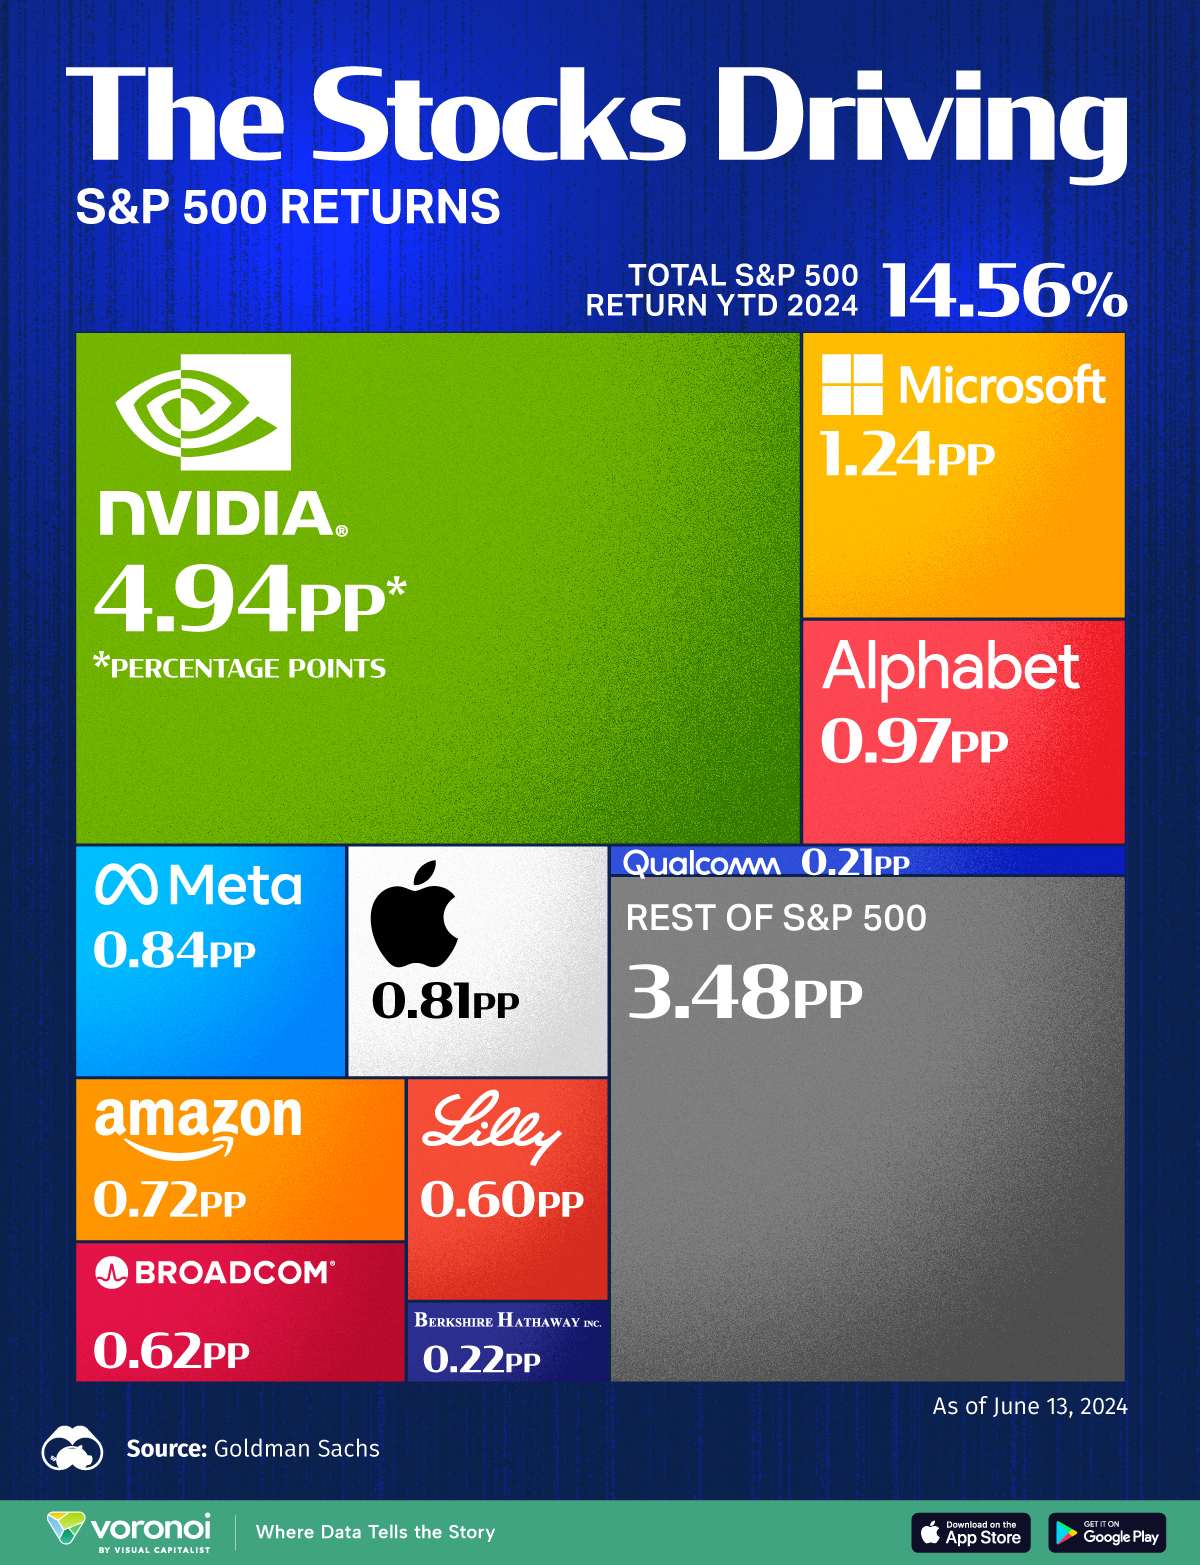
This graphic shows the top 10 S&P 500 stocks driving stock market returns in 2024, based on data from Goldman Sachs.
Big Tech Stocks Are Fueling Gains
Below, we show the companies making the largest contribution to the S&P 500’s rally:
| Rank | Company | Ticker | Contribution to S&P 500 Return YTD as of June 13, 2024 |
|---|---|---|---|
| 1 | Nvidia | NVDA | 4.94% |
| 2 | Microsoft | MSFT | 1.24% |
| 3 | Alphabet | GOOGL | 0.97% |
| 4 | Meta | META | 0.84% |
| 5 | Apple | AAPL | 0.81% |
| 6 | Amazon | AMZN | 0.72% |
| 7 | Broadcom | AVGO | 0.62% |
| 8 | Eli Lilly & Co. | LLY | 0.60% |
| 9 | Berkshire Hathaway | BRK.B | 0.22% |
| 10 | QUALCOMM | QCOM | 0.21% |
| Total S&P 500 Return YTD 2024 | 14.65% |
As of June 13, 2024.
Chipmaker Nvidia has driven over a third of S&P 500 returns this year, with its share price soaring 162% year-to-date as of June 13, 2024.
In June, Nvidia became the world’s most valuable firm, commanding an estimated 70% to 95% of the AI chip market. In the latest quarter, revenue surged by threefold compared to a year earlier amid high chip demand. Overall, big tech companies such as Meta, Amazon, and Microsoft made up roughly 45% of its data-center revenue, with Meta running a staggering 350,000 H100 chips to power its AI systems this year alone.
Falling in second is Microsoft, which has invested billions in AI startups including OpenAI and Wayve, a self-driving car firm. Microsoft is a cloud service provider for ChatGPT, the large language model built by OpenAI. As AI demand exceeds capacity, and other business segments see solid growth, Microsoft’s revenue increased 17% year-over-year as of the second quarter of 2024.
Google’s parent, Alphabet, ranks next, followed by Meta and Apple. Each of these companies is working on their own large language model which costs millions to train and run. Together, the top five stocks are driving about 60% of the S&P 500’s returns.
As we can see, just two of the top 10 S&P 500 stocks are not big tech names: pharmaceutical giant Eli Lilly and Berkshire Hathaway. This year, Eli Lilly’s share price is surging due to strong demand for its weight loss drug, Zepbound. During the first quarter of 2024, the newly-approved drug generated over $517 million in sales. Given its reported effectiveness, some analysts are forecasting it could be the best-selling drug ever in American history.

-

 Money2 weeks ago
Visualizing the Wealth of Americans Under 40 (1989-2023)
-

 Maps1 week ago
Mapped: 15 Countries with the Highest Smoking Rates
-
 Maps1 week ago
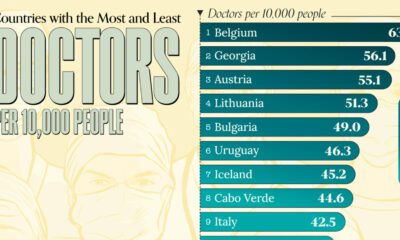
Mapped: Highest and Lowest Doctor Density Around the World
-

 Money1 week ago
Ranked: The World’s Top 10 Billionaires in 2024
-

 Stocks1 week ago
All of the World’s Trillion-Dollar Companies in One Chart
-
 Markets1 week ago
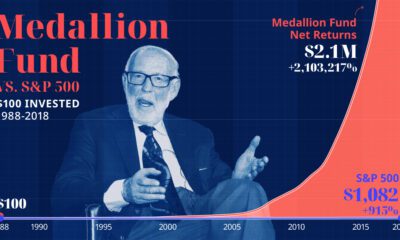
The Growth of $100 Invested in Jim Simons’ Medallion Fund
-

 Stocks1 week ago
Charted: Four Decades of U.S. Tech IPOs
-

 Retail1 week ago
Ranked: The 20 Top Retailers Worldwide, by Revenue