Markets
Ranked: The Megaregions Driving the Global Economy
View the full-resolution version of this infographic
Ranked: The Megaregions Driving the Global Economy
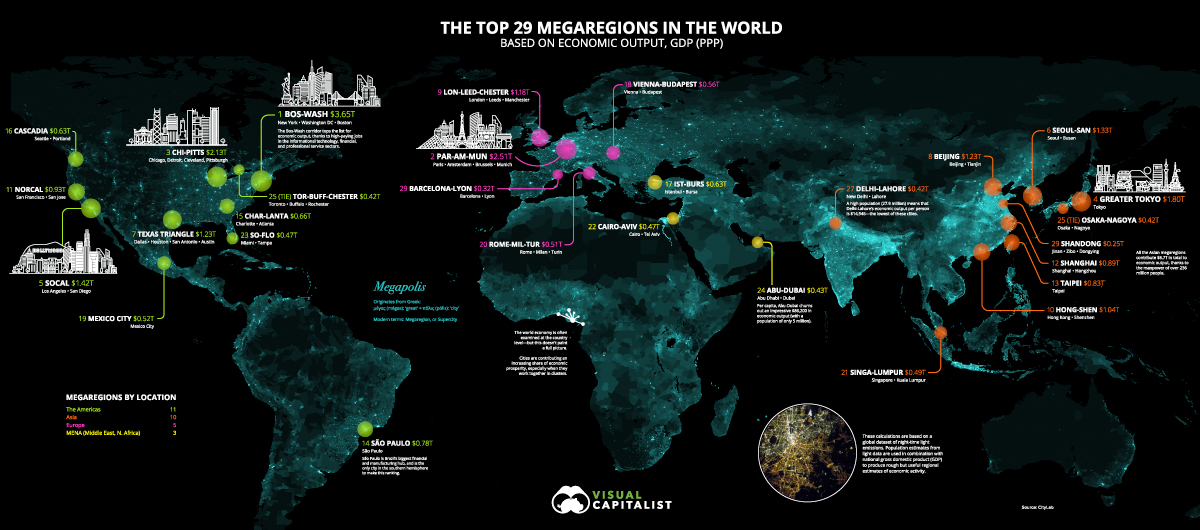
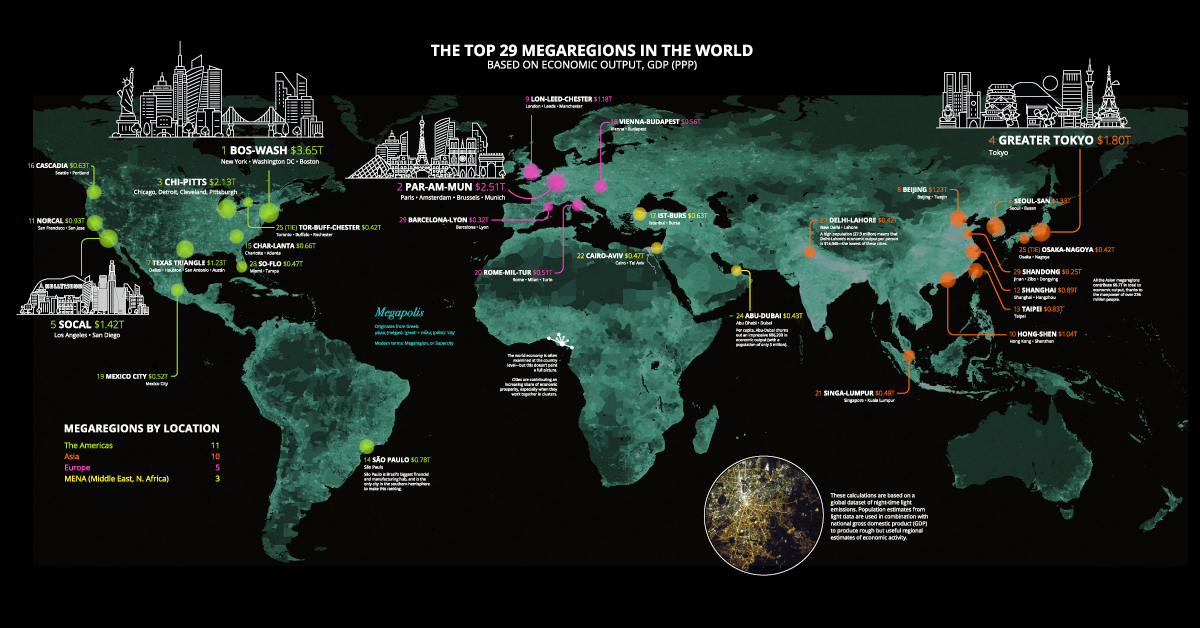
If you’ve ever flown cross-country in a window seat, chances are, the bright lights at night have caught your eye. From above, the world tells its own story—as concentrated pockets of bright light keep the world’s economy thriving.
Today’s visualization relies on data compiled by CityLab researchers to identify the world’s largest megaregions. The team defines megaregions as:
- Areas of continuous light, based on the latest night satellite imagery
- Capturing metro areas or networks of metro areas, with a combined population of 5 million or higher
- Generating economic output (GDP) of over $300 billion, on a PPP basis
The satellite imagery comes from the NOAA, while the base data for economic output is calculated from Oxford Economics via Brookings’ Global Metro Monitor 2018.
It’s worth pointing out that each megaregion may not be connected by specific trade relationships. Rather, satellite data highlights the proximity between these rough but useful regional estimates contributing to the global economy—and supercities are at the heart of it.
From Megalopolis to Megaregion
Throughout history, academics have described vast, interlinked urban regions as a ‘megalopolis’, or ‘megapolis’. Economic geographer Jean Gottman popularized the Greek term, referring to the booming and unprecedented urbanization in Bos-Wash—the northeast stretch from Boston and New York down to Washington, D.C.:
This region has indeed a “personality” of its own […] Every city in this region spreads out far and wide around its original nucleus.
By looking at adjacent metropolitan areas rather than country-level data, it can help provide an entirely new perspective on the global distribution of economic activity.
Where in the world are the most powerful urban economic clusters today?
The Largest Megaregions Today
The world’s economy is a sum of its parts. Each megaregion contributes significantly to the global growth engine, but arguably, certain areas pull more weight than others.
| Megaregion | Cities | Region | Population | Economic Output (EO) | EO per Capita |
|---|---|---|---|---|---|
| 1. Bos-Wash | New York, Washington, D.C., Boston | North America | 47.6M | $3,650B | $76,681 |
| 2. Par-Am-Mun | Paris, Amsterdam, Brussels, Munich | Europe | 43.5M | $2,505B | $57,586 |
| 3. Chi-Pitts | Chicago, Detroit, Cleveland, Pittsburgh | North America | 32.9M | $2,130B | $64,742 |
| 4. Greater Tokyo | Tokyo | Asia | 39.1M | $1,800B | $46,036 |
| 5. SoCal | Los Angeles, San Diego | North America | 22M | $1,424B | $64,727 |
| 6. Seoul-San | Seoul, Busan | Asia | 35.5M | $1,325B | $37,324 |
| 7. Texas Triangle | Dallas, Houston, San Antonio, Austin | North America | 18.4M | $1,227B | $66,685 |
| 8. Beijing | Beijing, Tianjin | Asia | 37.4M | $1,226B | $32,781 |
| 9. Lon-Leed-Chester | London, Leeds, Manchester | Europe | 22.6M | $1,177B | $52,080 |
| 10. Hong-Shen | Hong Kong, Shenzhen | Asia | 19.5M | $1,043B | $53,487 |
| 11. NorCal | San Francisco, San Jose | North America | 10.8M | $925B | $85,648 |
| 12. Shanghai | Shanghai, Hangzhou | Asia | 24.2M | $892B | $36,860 |
| 13. Taipei | Taipei | Asia | 16.7M | $827B | $49,521 |
| 14. São Paolo | São Paolo | South America | 33.5M | $780B | $23,284 |
| 15. Char-Lanta | Charlotte, Atlanta | North America | 10.5M | $656B | $62,476 |
| 16. Cascadia | Seattle, Portland | North America | 8.8M | $627B | $71,250 |
| 17. Ista-Burs | Istanbul, Bursa | MENA | 14.8M | $626B | $42,297 |
| 18. Vienna-Budapest | Vienna, Budapest | Europe | 12.8M | $555B | $43,359 |
| 19. Mexico City | Mexico City | North America | 24.5M | $524B | $21,388 |
| 20. Rome-Mil-Tur | Rome, Milan, Turin | Europe | 13.8M | $513B | $37,174 |
| 21. Singa-Lumpur | Singapore, Kuala Lumpur | Asia | 12.7M | $493B | $38,819 |
| 22. Cairo-Aviv | Cairo, Tel Aviv | MENA | 19.8M | $472B | $23,838 |
| 23. So-Flo | Miami, Tampa | North America | 9.1M | $470B | $51,648 |
| 24. Abu-Dubai | Abu Dhabi, Dubai | MENA | 5M | $431B | $86,200 |
| 25. Osaka-Nagoya (tied) | Osaka, Nagoya | Asia | 9.1M | $424B | $46,593 |
| 25. Tor-Buff-Chester (tied) | Toronto, Buffalo, Rochester | North America | 8.5M | $424B | $49,882 |
| 27. Delhi-Lahore | New Delhi, Lahore | Asia | 27.9M | $417B | $14,946 |
| 28. Barcelona-Lyon | Barcelona, Lyon | Europe | 7M | $323B | $46,143 |
| 29. Shandong | Jinan, Zibo, Dongying | Asia | 14.2M | $249B | $17,535 |
| Total | 602.2M | $28,135B | $46,720 |
Altogether, these powerhouses bring in over $28 trillion in economic output.
Unsurprisingly, Bos-Wash reigns supreme even today, with $3.6 trillion in economic output, over 13% of the total. The corridor hosts some of the highest-paying sectors: information technology, finance, and professional services.
The largest city in Brazil, São Paulo, is the only city in the Southern Hemisphere to make the list. The city was once heavily reliant on manufacturing and trade, but the $780 billion city economy is now embracing its role as a nascent financial hub.
On the other side of the world, the cluster of Asian megaregions combines for $8.7 trillion in total economic output. Of these, Greater Tokyo in Japan is the largest, while Shandong might be a name that fewer people are familiar with. Sandwiched between Beijing and Shanghai, the coastal province houses multiple high-tech industrial and export processing zones.
The data is even more interesting when broken down into economic output per capita—Abu-Dubai churns out an impressive $86,200 per person. Meanwhile, Delhi-Lahore is lowest on the per-capita list, at $14,946 per person across nearly 28 million people.
Where To Next?
This trend shows no sign of slowing down, as megacities are on the rise in the coming decade. Eventually, more Indian and African megaregions will make its way onto this list, led by cities like Lagos and Chennai.
Stay tuned to Visual Capitalist for a North America-specific outlook coming soon, and a deep dive into the biggest factors contributing to the growth of these megaregions.


Markets
Ranked: The Largest U.S. Corporations by Number of Employees
We visualized the top U.S. companies by employees, revealing the massive scale of retailers like Walmart, Target, and Home Depot.


The Largest U.S. Corporations by Number of Employees
This was originally posted on our Voronoi app. Download the app for free on Apple or Android and discover incredible data-driven charts from a variety of trusted sources.
Revenue and profit are common measures for measuring the size of a business, but what about employee headcount?
To see how big companies have become from a human perspective, we’ve visualized the top U.S. companies by employees. These figures come from companiesmarketcap.com, and were accessed in March 2024. Note that this ranking includes publicly-traded companies only.
Data and Highlights
The data we used to create this list of largest U.S. corporations by number of employees can be found in the table below.
| Company | Sector | Number of Employees |
|---|---|---|
| Walmart | Consumer Staples | 2,100,000 |
| Amazon | Consumer Discretionary | 1,500,000 |
| UPS | Industrials | 500,000 |
| Home Depot | Consumer Discretionary | 470,000 |
| Concentrix | Information Technology | 440,000 |
| Target | Consumer Staples | 440,000 |
| Kroger | Consumer Staples | 430,000 |
| UnitedHealth | Health Care | 400,000 |
| Berkshire Hathaway | Financials | 383,000 |
| Starbucks | Consumer Discretionary | 381,000 |
| Marriott International | Consumer Discretionary | 377,000 |
| Cognizant | Information Technology | 346,600 |
Retail and Logistics Top the List
Companies like Walmart, Target, and Kroger have a massive headcount due to having many locations spread across the country, which require everything from cashiers to IT professionals.
Moving goods around the world is also highly labor intensive, explaining why UPS has half a million employees globally.
Below the Radar?
Two companies that rank among the largest U.S. corporations by employees which may be less familiar to the public include Concentrix and Cognizant. Both of these companies are B2B brands, meaning they primarily work with other companies rather than consumers. This contrasts with brands like Amazon or Home Depot, which are much more visible among average consumers.
A Note on Berkshire Hathaway
Warren Buffett’s company doesn’t directly employ 383,000 people. This headcount actually includes the employees of the firm’s many subsidiaries, such as GEICO (insurance), Dairy Queen (retail), and Duracell (batteries).
If you’re curious to see how Buffett’s empire has grown over the years, check out this animated graphic that visualizes the growth of Berkshire Hathaway’s portfolio from 1994 to 2022.

-

 Business2 weeks ago
America’s Top Companies by Revenue (1994 vs. 2023)
-

 Environment1 week ago
Ranked: Top Countries by Total Forest Loss Since 2001
-

 Markets1 week ago
Visualizing America’s Shortage of Affordable Homes
-

 Maps2 weeks ago
Mapped: Average Wages Across Europe
-

 Mining2 weeks ago
Charted: The Value Gap Between the Gold Price and Gold Miners
-

 Demographics2 weeks ago
Visualizing the Size of the Global Senior Population
-

 Misc2 weeks ago
Tesla Is Once Again the World’s Best-Selling EV Company
-

 Technology2 weeks ago
Ranked: The Most Popular Smartphone Brands in the U.S.