Visualized: Mid-Year Interest Rate Cut Forecasts for 2024
The Top 10 Highest Paid CEOs in America
Mapped: The Growth in U.S. House Prices by State in 2024
The Stocks Driving S&P 500 Returns in 2024
Which Countries Have the Highest Corporate Tax Rates in the G20?
Ranked: The 20 Biggest Tech Companies by Market Cap
What is the Median Pay of Magnificent Seven Companies?
Visualizing the 15 Most Valuable Bitcoin Addresses
Charted: How Many Data Centers do Major Big Tech Companies Have?
Visualizing the Training Costs of AI Models Over Time
The Most Expensive States to Maintain a Home
Ranked: The Countries Sending the Most Remittances Abroad
Ranked: The Most Expensive U.S. Metro Areas to Raise a Child
Charted: U.S. Wealth by Generation
Mapped: The World’s Wealthiest Cities, by Millionaires and Billionaires
Mapped: Abortion Legality by U.S. State
Mapped: 15 Countries with the Highest Smoking Rates
Mapped: Highest and Lowest Doctor Density Around the World
Which Countries Have Universal Health Coverage?
Visualizing Daily Protein Sources by Region
Visualizing Saudi Aramco’s Massive Oil Reserves
Comparing Saudi Aramco’s $1.9T Valuation to Its Rivals
Ranked: The World’s Largest Lithium Producers in 2023
Who’s Building the Most Solar Energy?
Mapped: The Age of Energy Projects in Interconnection Queues, by State
Map: Where are American Troops Stationed Overseas?
Mapped: Median Income by State in 2024
Charted: Unauthorized Immigrants in the U.S., by Country of Origin
Visualizing Raw Steel Production in 2023
Visualizing Cobalt Production by Country in 2023
The Biggest Salt Producing Countries in 2023
Visualizing Copper Production by Country in 2023
Ranked: Top 20 Countries by Plastic Waste per Capita
How People Get Around in America, Europe, and Asia
The Carbon Footprint of Major Travel Methods
Ranking the Top 15 Countries by Carbon Tax Revenue
Ranked: The Countries With the Most Air Pollution in 2023
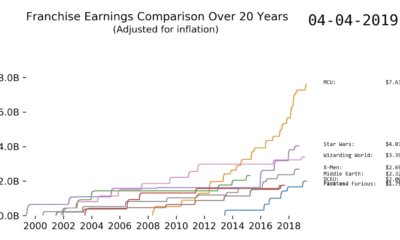
This fascinating animation charts the revenue of some big movie franchises. Watch blockbusters like Marvel shoot up the rankings over time.
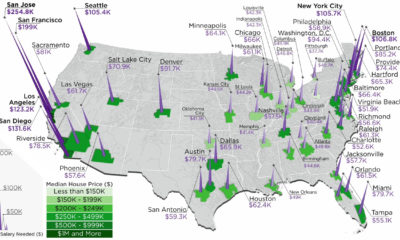
The annual salary needed to buy a home in the U.S. ranges from $38k to $255k, depending on the metropolitan area you are looking in.
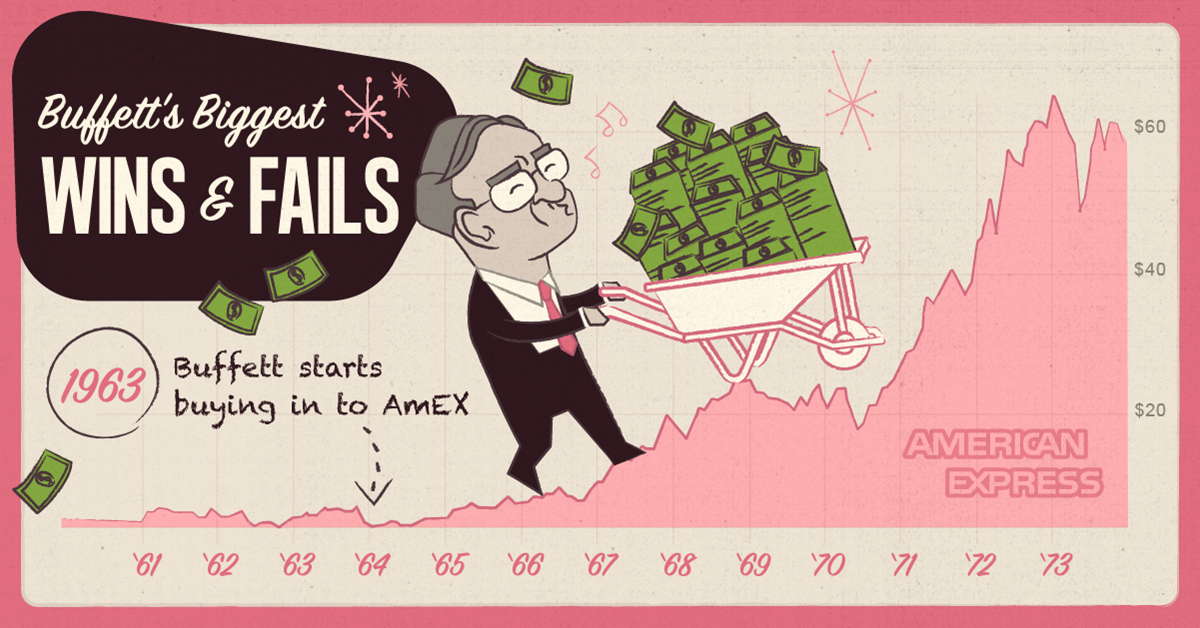
Counting down Warren Buffett's biggest wins and fails, including a mistake that the iconic investor estimates has costed him $200 billion to date.
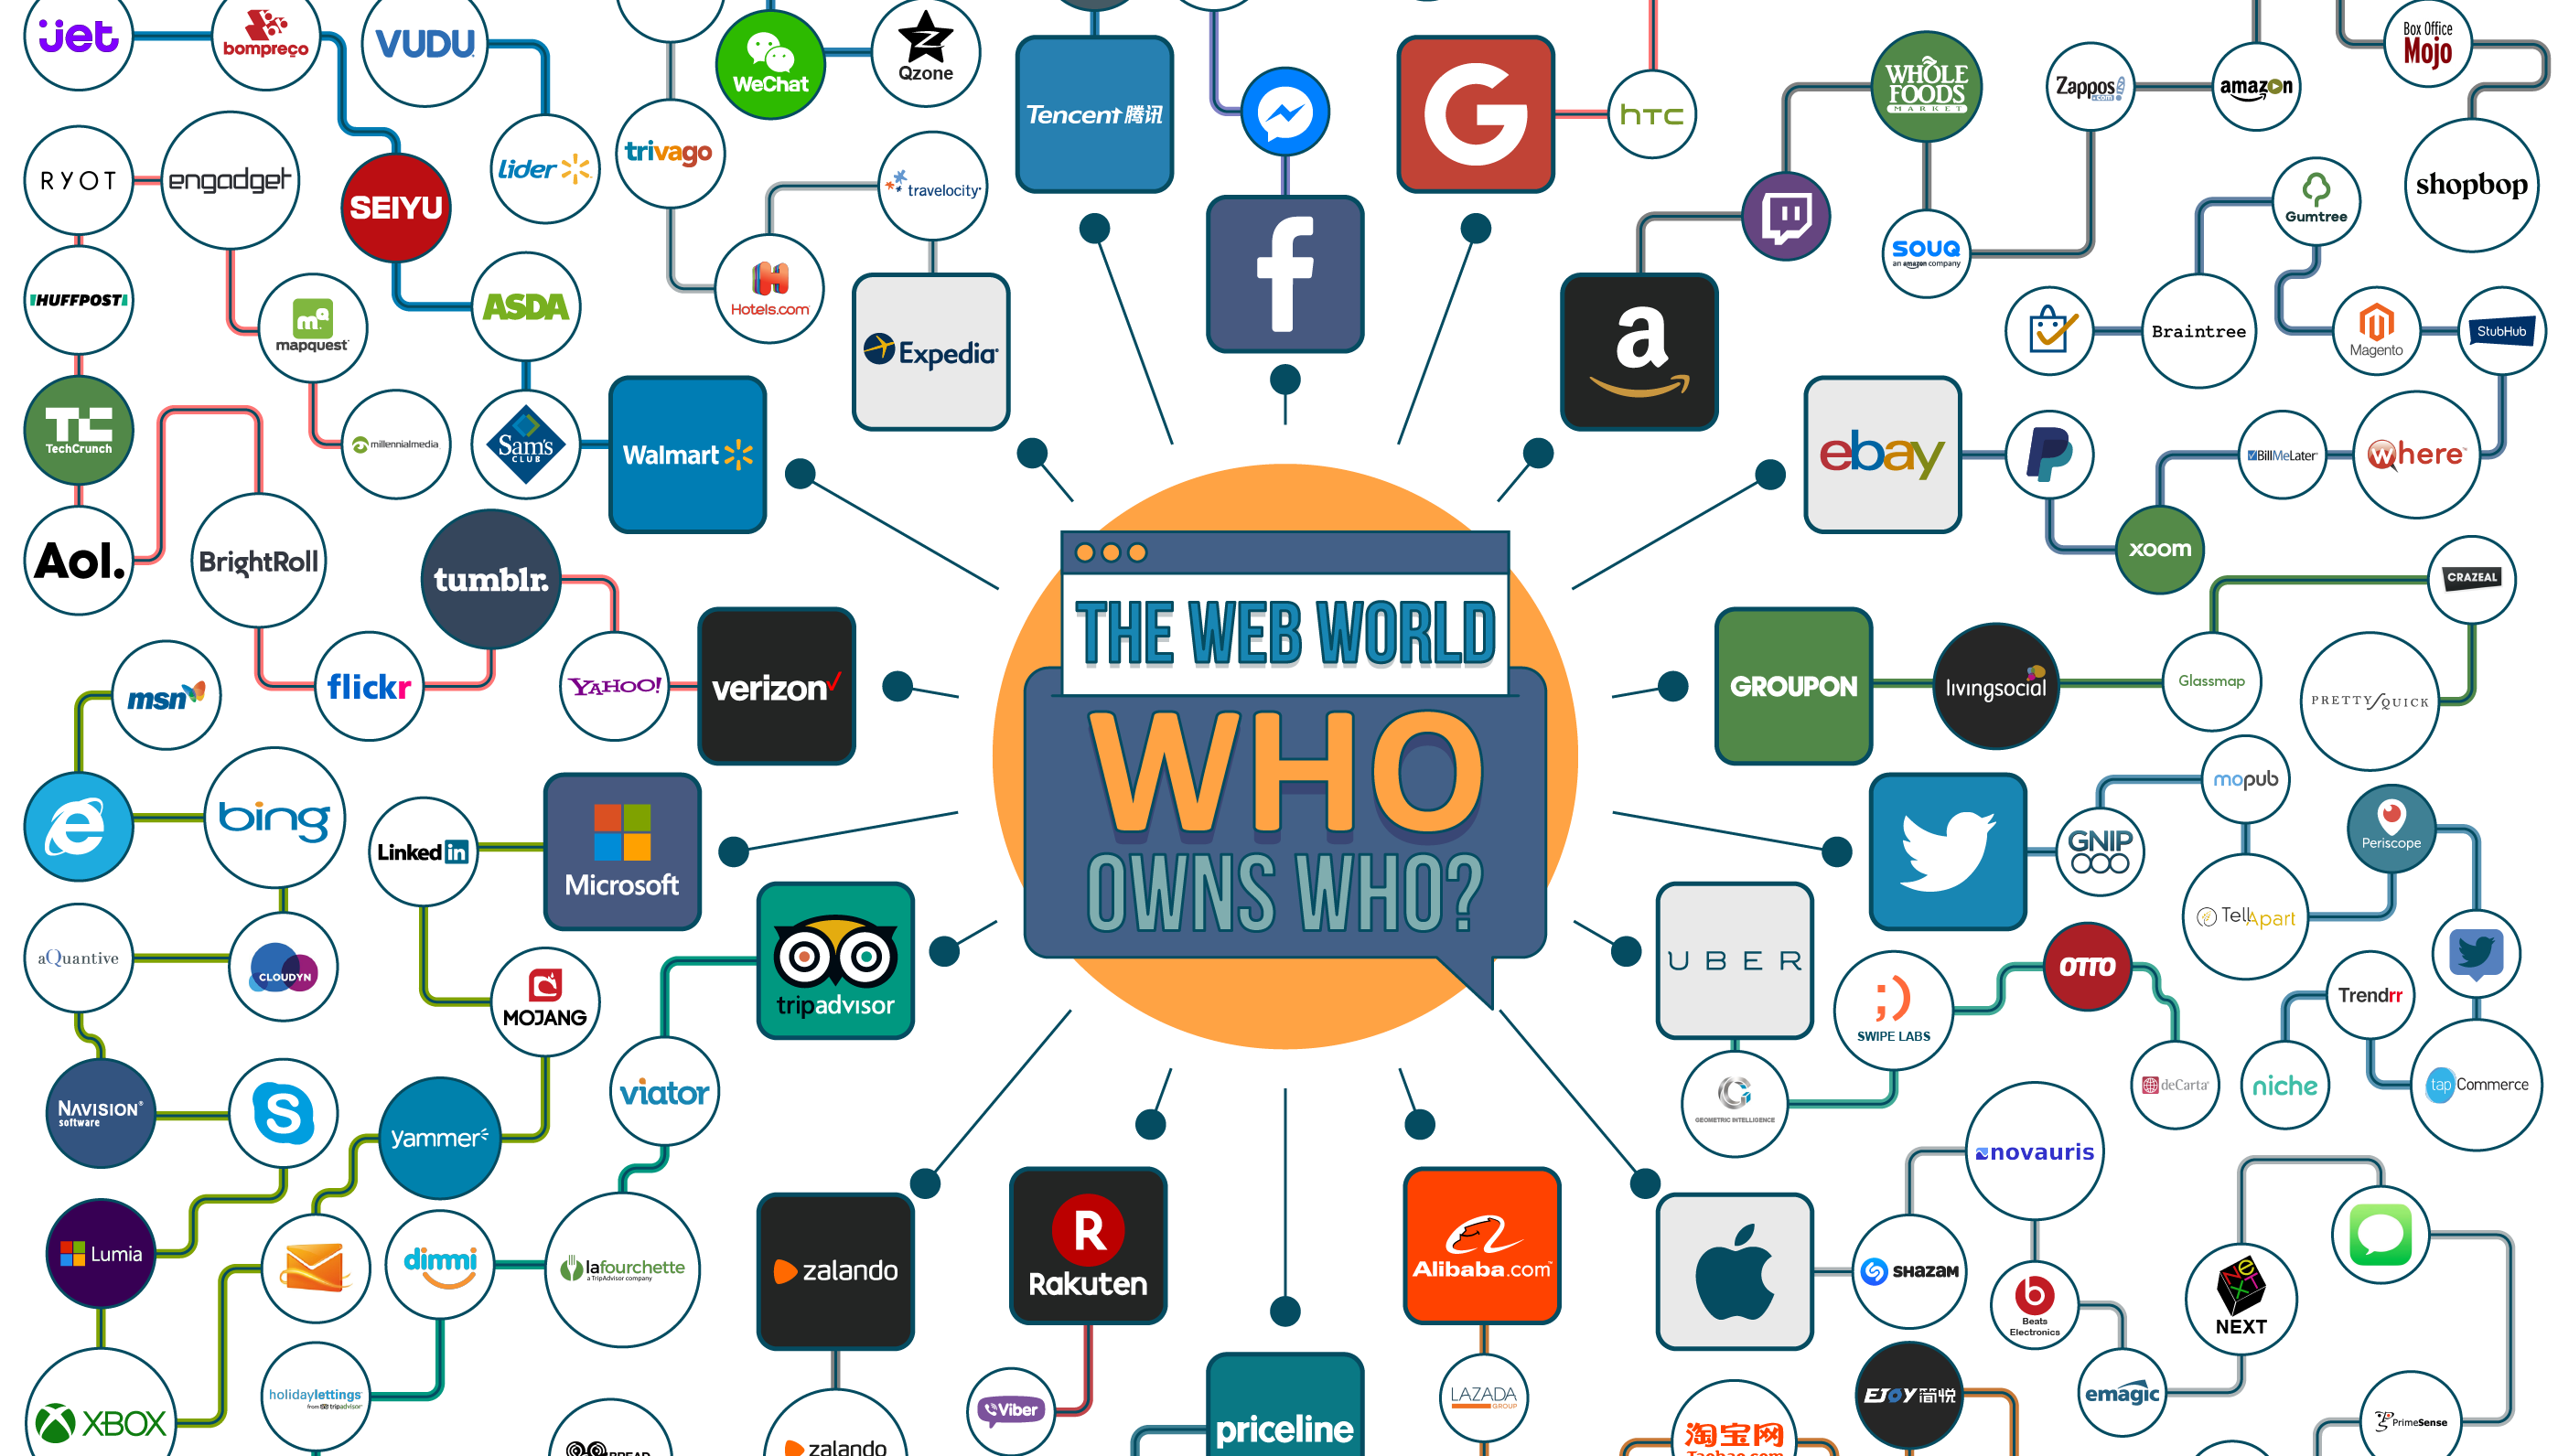
The tech world is becoming much more consolidated. This infographic shows the major entities owned by internet giants like Facebook, Amazon, and Google.
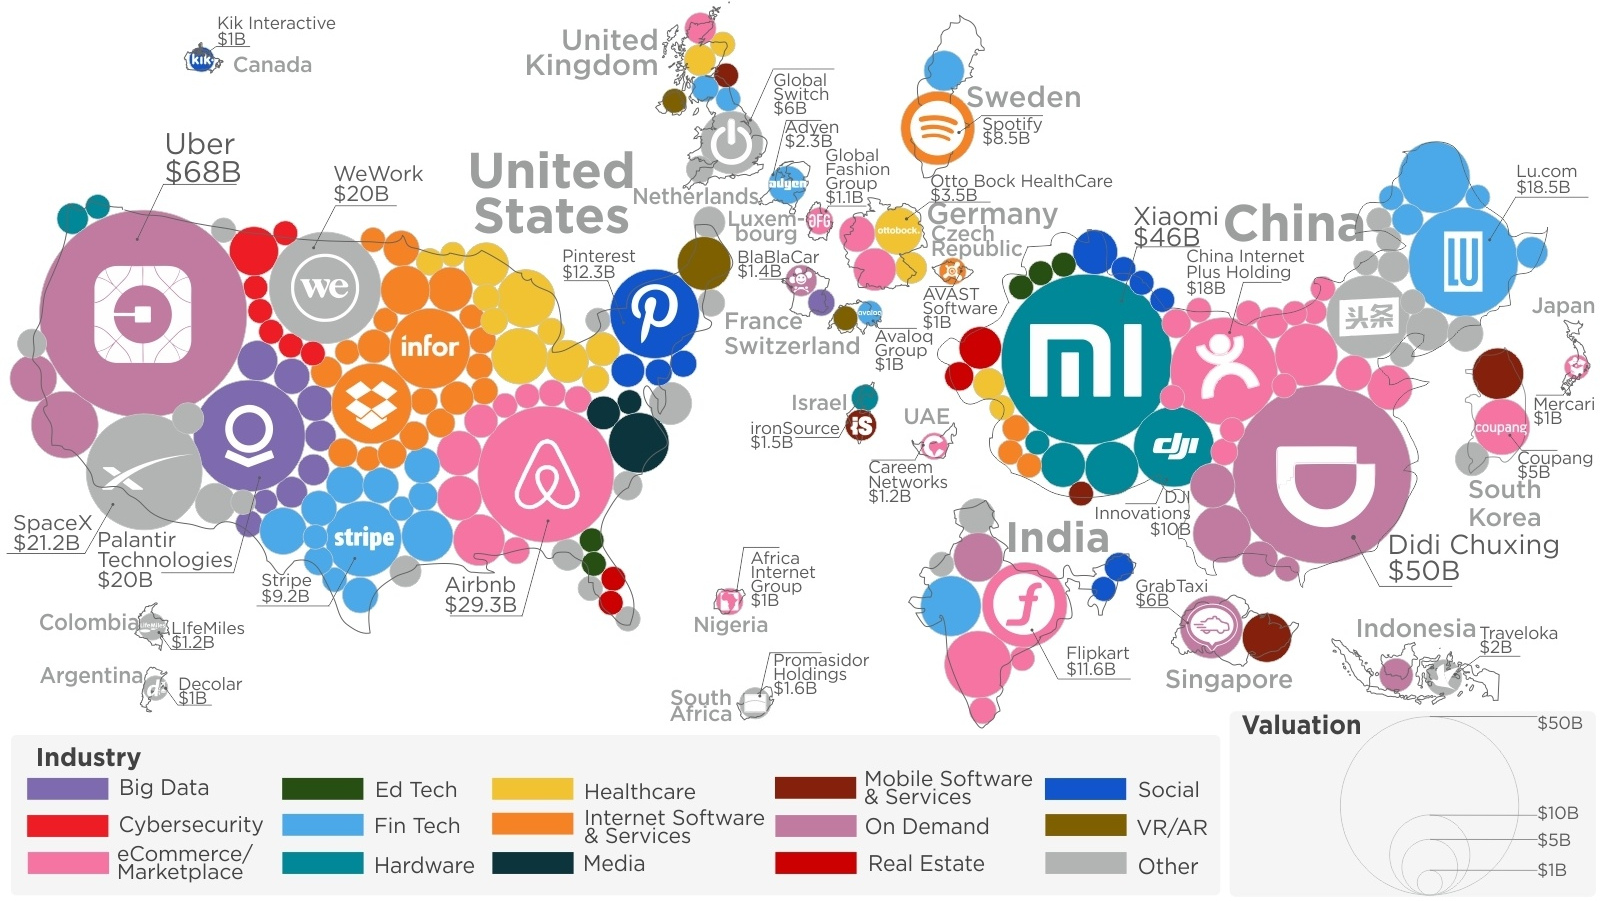
Plotting all the world's unicorns reveals two big things: extreme dominance by USA/China, as well as the disproportionate size of the Top 10 companies.
The U.S. market is up 9.5% so far in 2017, but individual sectors are all over the place. We look at four of the best -...
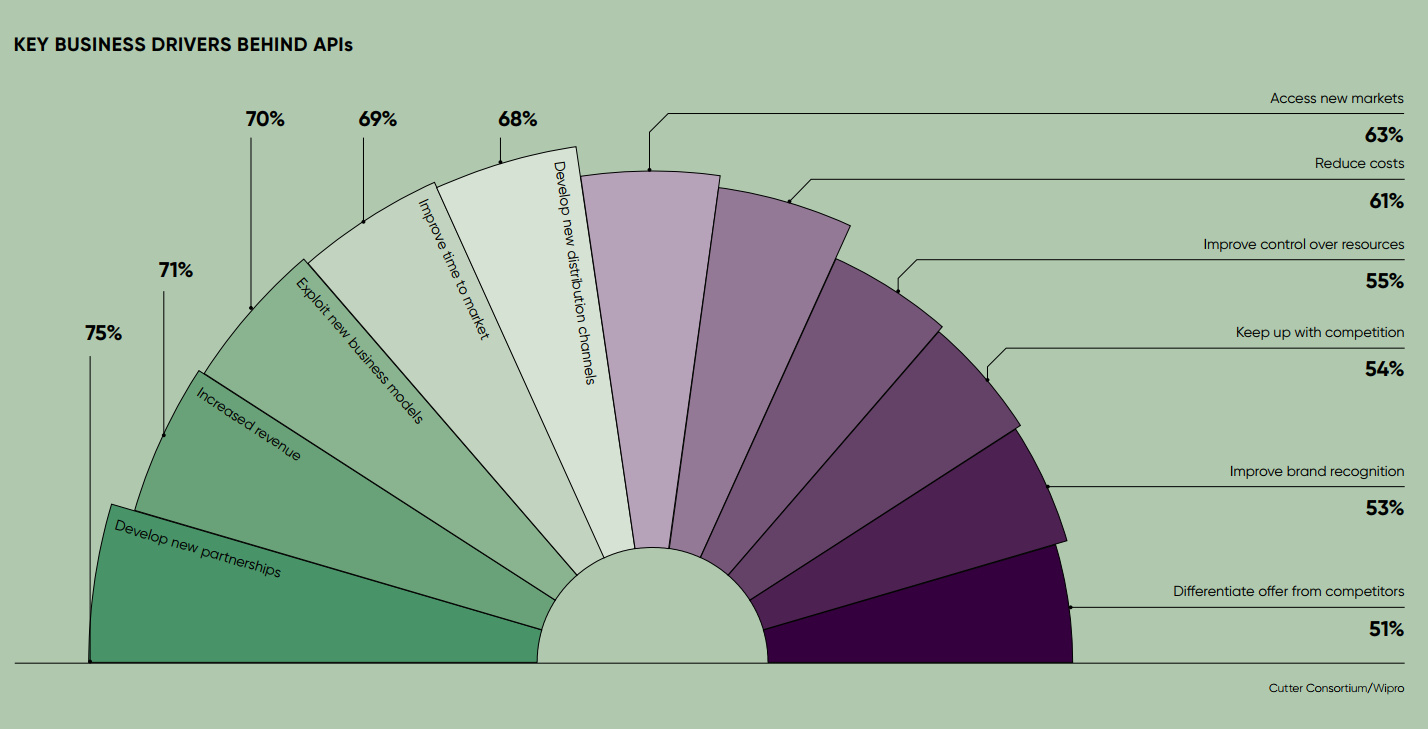
From searching flight deals to checking the weather, we rely on connected digital platforms in many ways. APIs work behind the scenes to make it all...
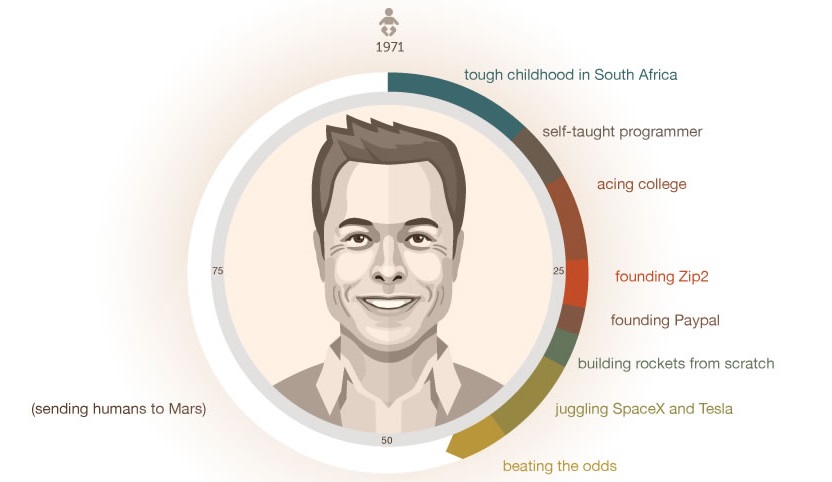
This lengthy infographic details Elon Musk's life from birth until today, showing how he built his vast empire of companies such as Tesla, SpaceX, and Paypal.
Like Aileen Lee's "Unicorn Club", our Narwhal Club is home to Canadian tech startups with valuations over $1 billion.
In this list, we count down the 14 best Visual Capitalist infographics of 2014.