Visualized: Mid-Year Interest Rate Cut Forecasts for 2024
The Top 10 Highest Paid CEOs in America
Mapped: The Growth in U.S. House Prices by State in 2024
The Stocks Driving S&P 500 Returns in 2024
Which Countries Have the Highest Corporate Tax Rates in the G20?
Ranked: The 20 Biggest Tech Companies by Market Cap
What is the Median Pay of Magnificent Seven Companies?
Visualizing the 15 Most Valuable Bitcoin Addresses
Charted: How Many Data Centers do Major Big Tech Companies Have?
Visualizing the Training Costs of AI Models Over Time
Ranked: Countries With the Most Millionaires and Billionaires
The Most Expensive States to Maintain a Home
Ranked: The Countries Sending the Most Remittances Abroad
Ranked: The Most Expensive U.S. Metro Areas to Raise a Child
Charted: U.S. Wealth by Generation
Mapped: Abortion Legality by U.S. State
Mapped: 15 Countries with the Highest Smoking Rates
Mapped: Highest and Lowest Doctor Density Around the World
Which Countries Have Universal Health Coverage?
Visualizing Daily Protein Sources by Region
Visualizing Saudi Aramco’s Massive Oil Reserves
Comparing Saudi Aramco’s $1.9T Valuation to Its Rivals
Ranked: The World’s Largest Lithium Producers in 2023
Who’s Building the Most Solar Energy?
Mapped: The Age of Energy Projects in Interconnection Queues, by State
Mapped: The Fastest Growing American Cities, by Population Gain
See China’s Population Density Visualized Using a 3D Map
Map: Where are American Troops Stationed Overseas?
Mapped: Median Income by State in 2024
Visualizing Raw Steel Production in 2023
Visualizing Cobalt Production by Country in 2023
The Biggest Salt Producing Countries in 2023
Visualizing Copper Production by Country in 2023
Ranked: Top 20 Countries by Plastic Waste per Capita
How People Get Around in America, Europe, and Asia
The Carbon Footprint of Major Travel Methods
Ranking the Top 15 Countries by Carbon Tax Revenue
Ranked: The Countries With the Most Air Pollution in 2023
This era of data abundance should be propelling humankind forward, but valuable insights are often lost in the noise. Data storytelling holds the key.
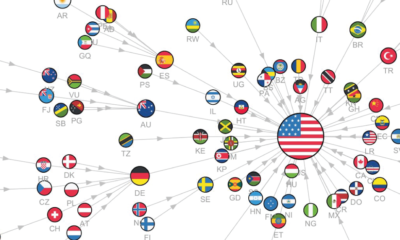
This series of visualizations uses Google trends search data to show the most googled countries around the world, from 2004 to 2022.
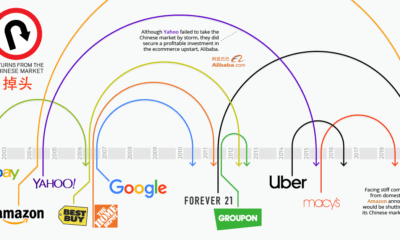
It's hard to ignore the massive economic opportunities available in the Chinese market, but it's also notoriously difficult to succeed in.
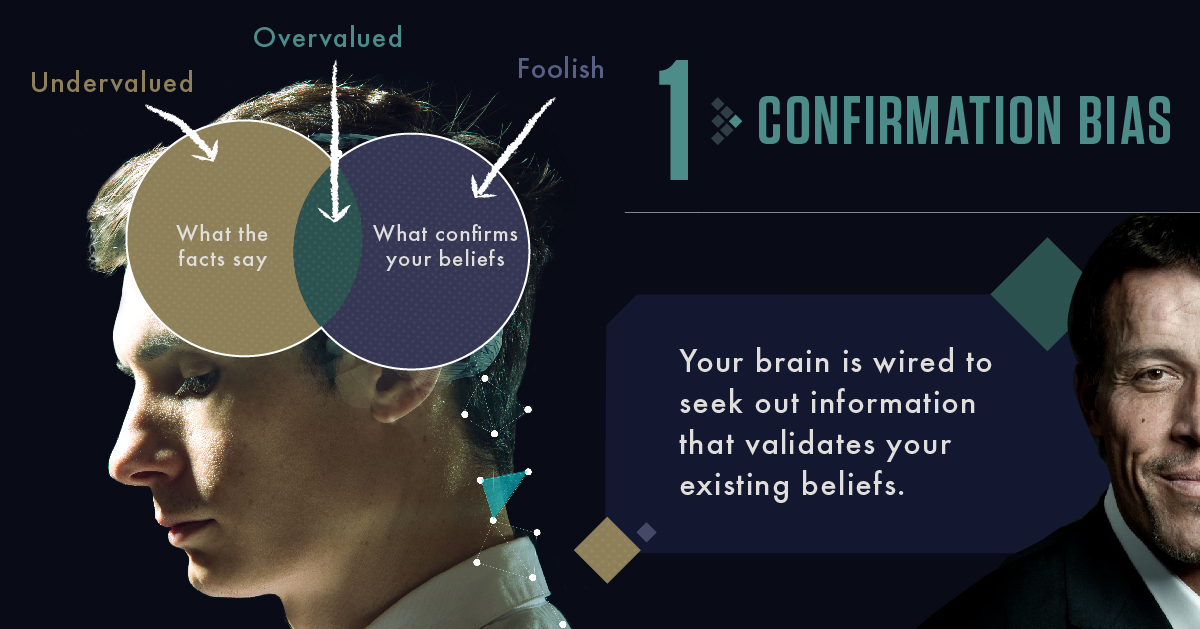
Our brain can be our own worst enemy. It's hardwired to avoid pain, and to seek pleasure - and these instincts can wreak havoc on your...
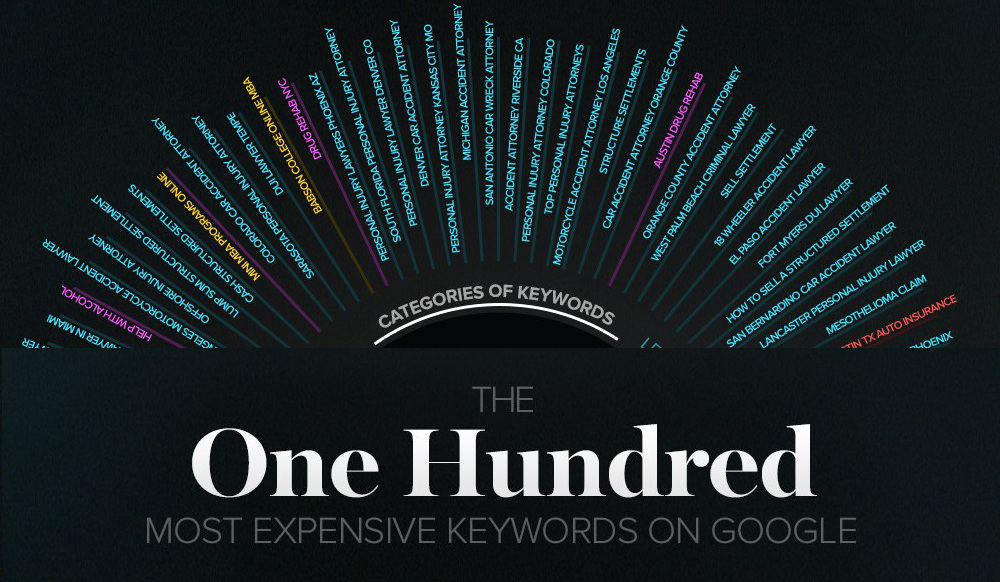
Ever wonder what lawyers use all of their legal fees for? Apparently it is to cover cost-per-click advertising on Google. Today's infographic looks at the most...
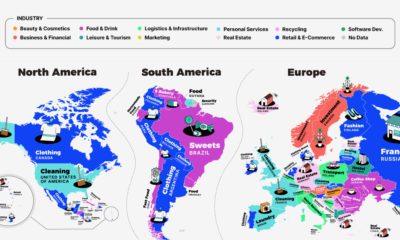
This series of maps shows a regional breakdown of the most popular types of businesses people want to start, based on online search results.
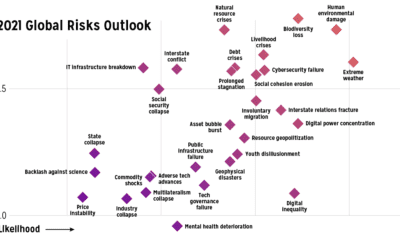
Which risks are top of mind in 2021? We visualize the World Economic Forum's risk assessment for top global risks by impact and livelihood.
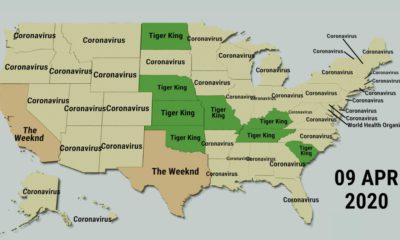
This fascinating animated map provides an overview of the top trending Google searches in every state over the last decade.
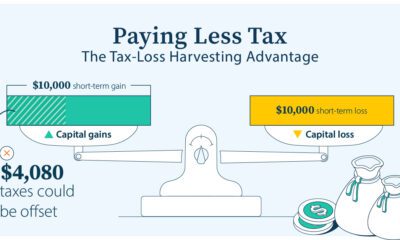
Learn how tax-loss harvesting works by using capital losses to offset capital gains, potentially reducing your tax bill.
Like many other companies in Silicon Valley, Google has its own famous folklore. In this infographic is 26 facts about Google you probably did not know.


 Creator Program