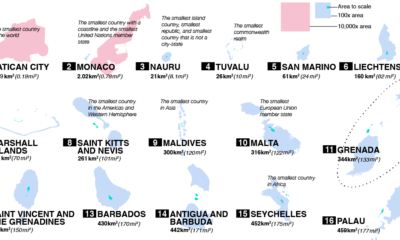

From Vatican City to Fiji, take a closer look at the world’s 100 smallest countries and their spheres of influence.
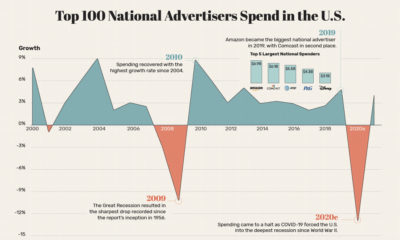

This graphic visualizes the fluctuations in advertising spend in the U.S., along with its brutal decline of 13% as a result of COVID-19.
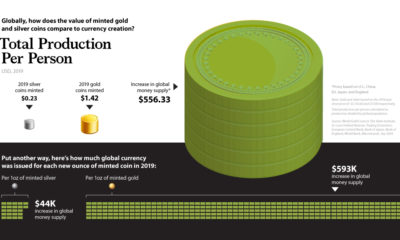

In 2019, the value of global money creation was over 500 times higher than the world's gold and silver coin production combined.
Here’s a look at the different parts of Amazon’s revenue model, and how much money each business segment makes.
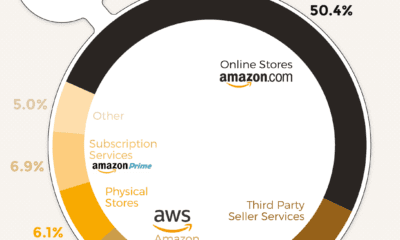

In 2019, Amazon generated $281 billion in total revenue—but where does all this revenue come from? Here’s a breakdown of how Amazon makes its money.


Most of us will experience impostor syndrome at some point in our careers. This flow chart helps identify which of 5 archetypes you fit with.
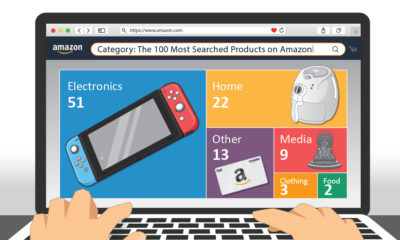

This graphic highlights the top product searches on Amazon in the U.S., providing a glimpse of what items American consumers are after.
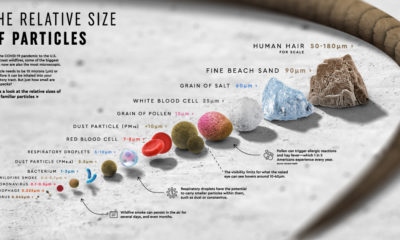

From wildfire smoke molecules to the coronavirus, this graphic compares the relative size of particles that we, for the most part, can't see.
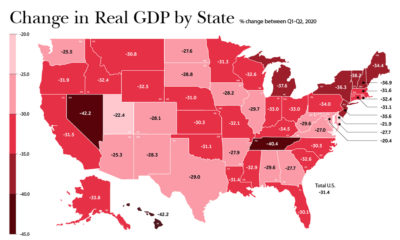

In just a few months, the U.S. economy reeled from COVID-19. As real change in GDP suffered, which states and industries were the hardest-hit?
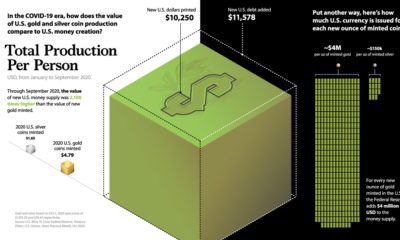

Amid trillions in COVID-19 stimulus, this graphic compares new U.S. dollars printed to U.S. precious metal coin production.


