Technology
The Rise of Online Dating, and the Company That Dominates the Market
The Rise of Online Dating, and the One Company That Dominates the Market
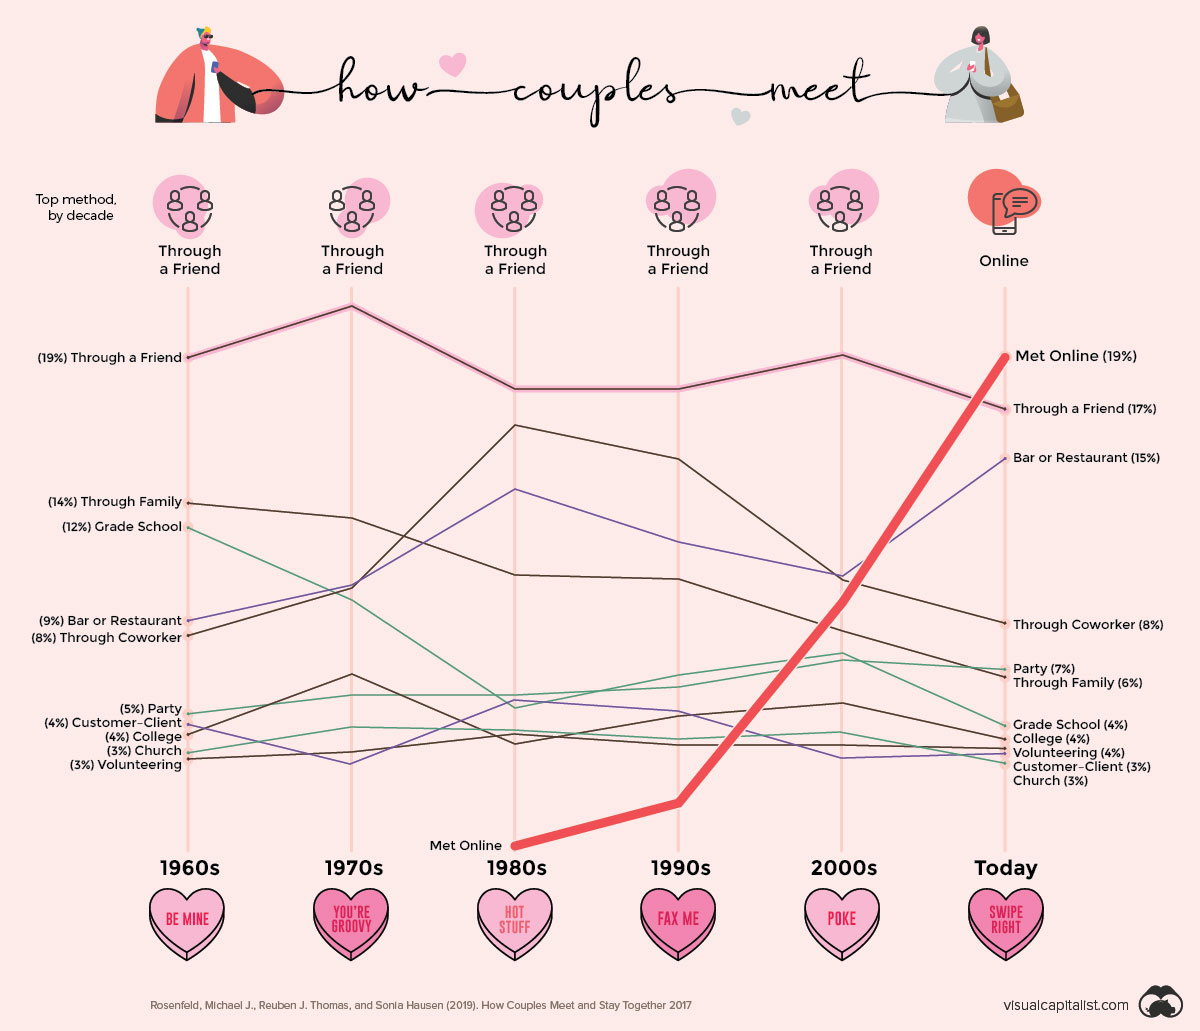
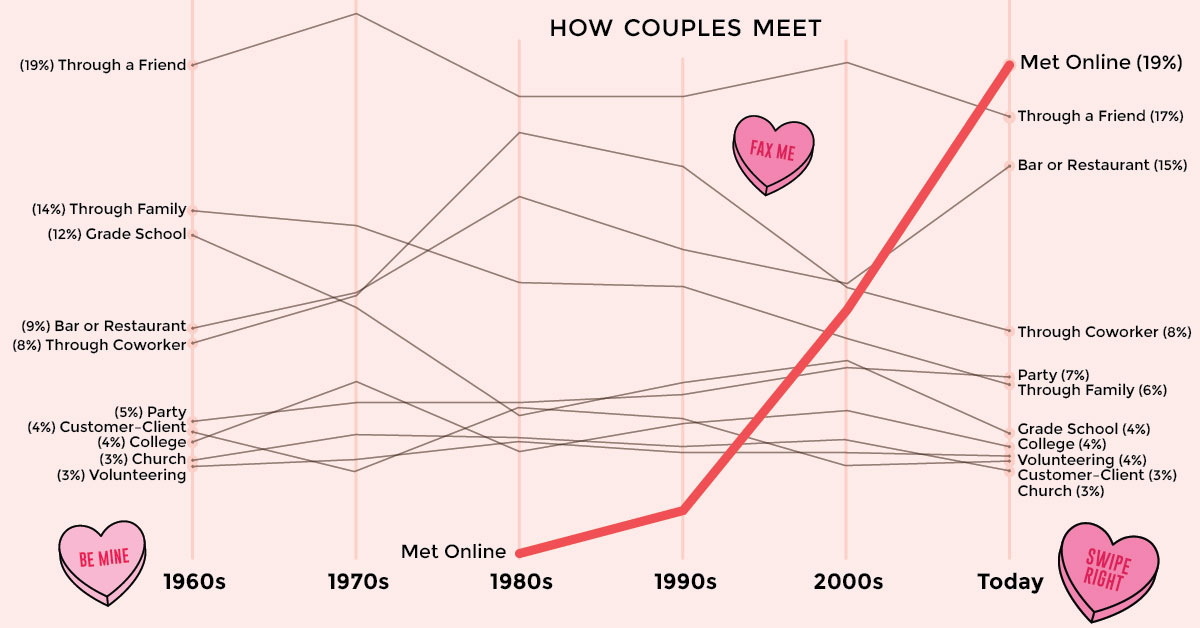
Couples used to meet in real life, but now more and more people are “matching” online.
While online dating was once considered taboo, the number of couples meeting online has more than doubled in the last decade to about 1-in-5. Nowadays, you’re much more likely to meet your next partner online rather than through your family or co-workers. But don’t worry, your friends are still a good help too.
The data used in today’s chart is from the “How Couples Meet and Stay Together” survey by Stanford University. This unique dataset charts a significant shift in the way couples meet each other, and demonstrates how our changing communication habits are driving massive growth in the online dating market.
The Rise of Dating Apps
The rise of online dating in the last decade goes hand in hand with the rise of dating apps.
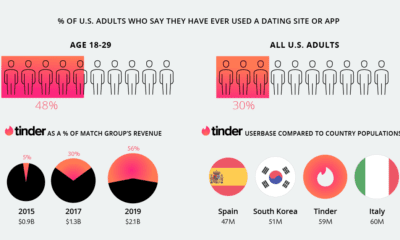
Tinder globally popularized app-based matchmaking when it launched on iPhones in 2012, and later on Android in 2013. Unlike traditional dating websites, which required lengthy profiles and complicated profile searches, Tinder gamified online dating with quick account setups and its “swipe-right-to-like” approach. By 2017, Tinder had grown to 57 million active users across the globe and billions of swipes per day.
Since the launch of Tinder, hundreds of dating services have appeared on app stores worldwide. Investors are taking notice of this booming market, while analysts estimate the global online dating market could be worth $12 billion by next year.
But it might surprise you that despite the growing variety of dating options online, most popular apps are owned by just one group.
The Big Business of Dating Apps: Match Group
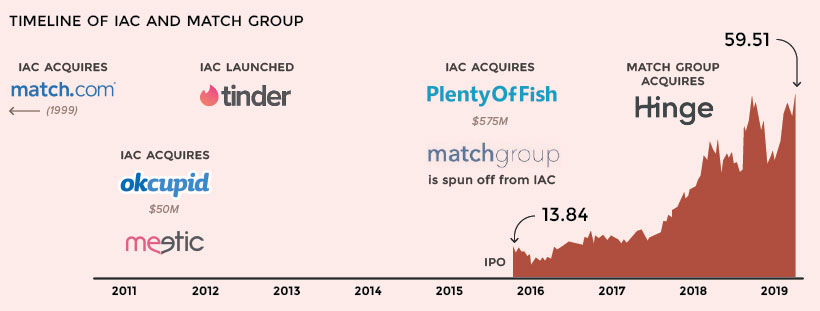
Today, nearly all major dating apps are owned by the Match Group, a publicly-traded pure play that was spun out of IAC, a conglomerate controlled by media mogul Barry Diller.
IAC saw the online dating trend early, purchasing early online dating pioneer Match.com way back in 1999. However, with online dating shifting into the mainstream over recent years, the strategy quickly shifted to aggressively buying up major players in the market.
We’re highly acquisitive, and we’re always talking to companies. If you want to sell, you should be talking to us.
–Mandy Ginsberg, Match Group CEO
In addition to its prized app Tinder – which doubled its revenue in 2018 to $805 million – Match Group owns popular online dating services like OkCupid, Plenty of Fish, Hinge, and has even bought out international competitors like Meetic in Europe, and Eureka in Japan. The dating giant reported revenues of $1.73 billion in 2018.
According to reports, Match Group now owns more than 45 dating-related businesses, including 25 acquisitions.
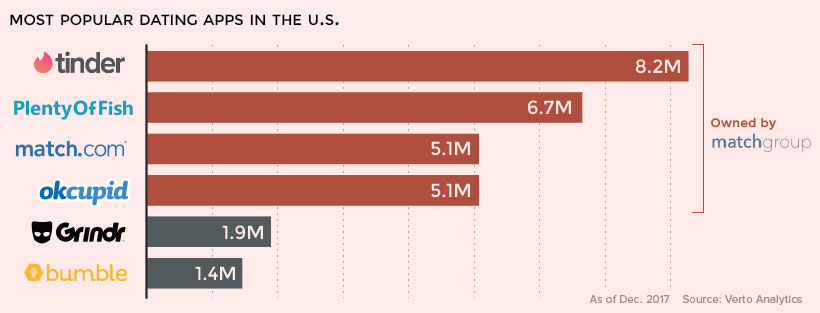
As Match Group continues to swallow up the online dating market, it now boasts dating sites or apps in every possible niche – including the four most-used apps in the United States.
Despite Match Group’s dominant efforts, there are still two competitors that remain outside the dating giant’s reach.
The One That Got Away
In 2017, Match Group tried to acquire its last major competitor, Bumble – which had grown to over 23 million users in just three years – for $450 million. Bumble rejected the offer and by the next year, Match Group sued Bumble for patent infringement, for what some felt was a bargaining chip to force an acquisition.
Bumble responded with an ad in the Dallas Morning News denouncing Match Group: “We swipe left on your multiple attempts to buy us, copy us, and, now, to intimidate us. We’ll never be yours. No matter the price tag, we’ll never compromise our values.”
It remains to be seen if Match Group will be able to acquire Bumble, but another tech giant’s decision to launch its own dating service has also complicated Match’s conquest of the online dating market.
New Face in Town
In 2018, social media giant Facebook launched its own dating service—potentially leveraging its 2.2 billion active users—to join the online dating market.
While the announcement initially caused Match Group’s stock to drop 21%, it since has rebounded as Facebook has been slow to roll out their service.
Going forward, Match Group’s dominance may be hindered by anti-trust calls in the U.S., Bumble’s growth and direct competition to Tinder, and whether the sleeping giant Facebook can change the global online dating market with its own service.
Who will win our hearts?
Hat tip to Nathan Yau at Flowing Data, who introduced us to the data on how couples meet. His dynamic chart is worth a look as well.


Technology
Ranked: Semiconductor Companies by Industry Revenue Share
Nvidia is coming for Intel’s crown. Samsung is losing ground. AI is transforming the space. We break down revenue for semiconductor companies.


Semiconductor Companies by Industry Revenue Share
This was originally posted on our Voronoi app. Download the app for free on Apple or Android and discover incredible data-driven charts from a variety of trusted sources.
Did you know that some computer chips are now retailing for the price of a new BMW?
As computers invade nearly every sphere of life, so too have the chips that power them, raising the revenues of the businesses dedicated to designing them.
But how did various chipmakers measure against each other last year?
We rank the biggest semiconductor companies by their percentage share of the industry’s revenues in 2023, using data from Omdia research.
Which Chip Company Made the Most Money in 2023?
Market leader and industry-defining veteran Intel still holds the crown for the most revenue in the sector, crossing $50 billion in 2023, or 10% of the broader industry’s topline.
All is not well at Intel, however, with the company’s stock price down over 20% year-to-date after it revealed billion-dollar losses in its foundry business.
| Rank | Company | 2023 Revenue | % of Industry Revenue |
|---|---|---|---|
| 1 | Intel | $51B | 9.4% |
| 2 | NVIDIA | $49B | 9.0% |
| 3 | Samsung Electronics | $44B | 8.1% |
| 4 | Qualcomm | $31B | 5.7% |
| 5 | Broadcom | $28B | 5.2% |
| 6 | SK Hynix | $24B | 4.4% |
| 7 | AMD | $22B | 4.1% |
| 8 | Apple | $19B | 3.4% |
| 9 | Infineon Tech | $17B | 3.2% |
| 10 | STMicroelectronics | $17B | 3.2% |
| 11 | Texas Instruments | $17B | 3.1% |
| 12 | Micron Technology | $16B | 2.9% |
| 13 | MediaTek | $14B | 2.6% |
| 14 | NXP | $13B | 2.4% |
| 15 | Analog Devices | $12B | 2.2% |
| 16 | Renesas Electronics Corporation | $11B | 1.9% |
| 17 | Sony Semiconductor Solutions Corporation | $10B | 1.9% |
| 18 | Microchip Technology | $8B | 1.5% |
| 19 | Onsemi | $8B | 1.4% |
| 20 | KIOXIA Corporation | $7B | 1.3% |
| N/A | Others | $126B | 23.2% |
| N/A | Total | $545B | 100% |
Note: Figures are rounded. Totals and percentages may not sum to 100.
Meanwhile, Nvidia is very close to overtaking Intel, after declaring $49 billion of topline revenue for 2023. This is more than double its 2022 revenue ($21 billion), increasing its share of industry revenues to 9%.
Nvidia’s meteoric rise has gotten a huge thumbs-up from investors. It became a trillion dollar stock last year, and broke the single-day gain record for market capitalization this year.
Other chipmakers haven’t been as successful. Out of the top 20 semiconductor companies by revenue, 12 did not match their 2022 revenues, including big names like Intel, Samsung, and AMD.
The Many Different Types of Chipmakers
All of these companies may belong to the same industry, but they don’t focus on the same niche.
According to Investopedia, there are four major types of chips, depending on their functionality: microprocessors, memory chips, standard chips, and complex systems on a chip.
Nvidia’s core business was once GPUs for computers (graphics processing units), but in recent years this has drastically shifted towards microprocessors for analytics and AI.
These specialized chips seem to be where the majority of growth is occurring within the sector. For example, companies that are largely in the memory segment—Samsung, SK Hynix, and Micron Technology—saw peak revenues in the mid-2010s.

-

 Mining2 weeks ago
Charted: The Value Gap Between the Gold Price and Gold Miners
-

 Real Estate1 week ago
Ranked: The Most Valuable Housing Markets in America
-

 Business1 week ago
Charted: Big Four Market Share by S&P 500 Audits
-

 AI1 week ago
The Stock Performance of U.S. Chipmakers So Far in 2024
-

 Misc1 week ago
Almost Every EV Stock is Down After Q1 2024
-

 Money2 weeks ago
Where Does One U.S. Tax Dollar Go?
-

 Green2 weeks ago
Ranked: Top Countries by Total Forest Loss Since 2001
-

 Real Estate2 weeks ago
Visualizing America’s Shortage of Affordable Homes