Economy
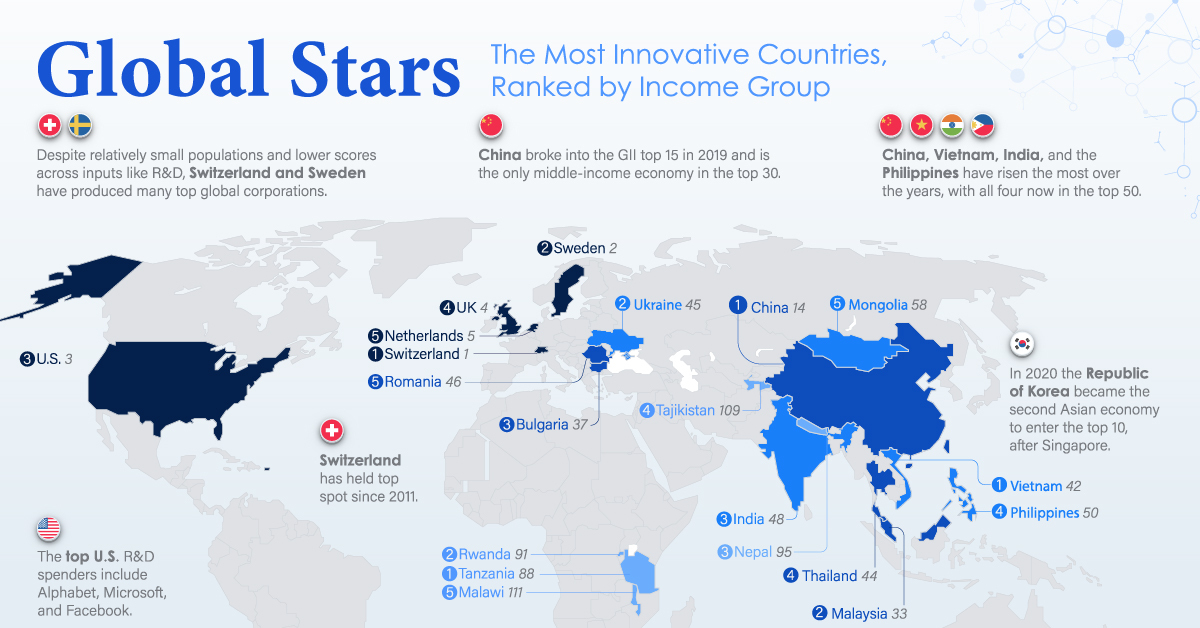
Global Stars: The Most Innovative Countries, Ranked by Income Group
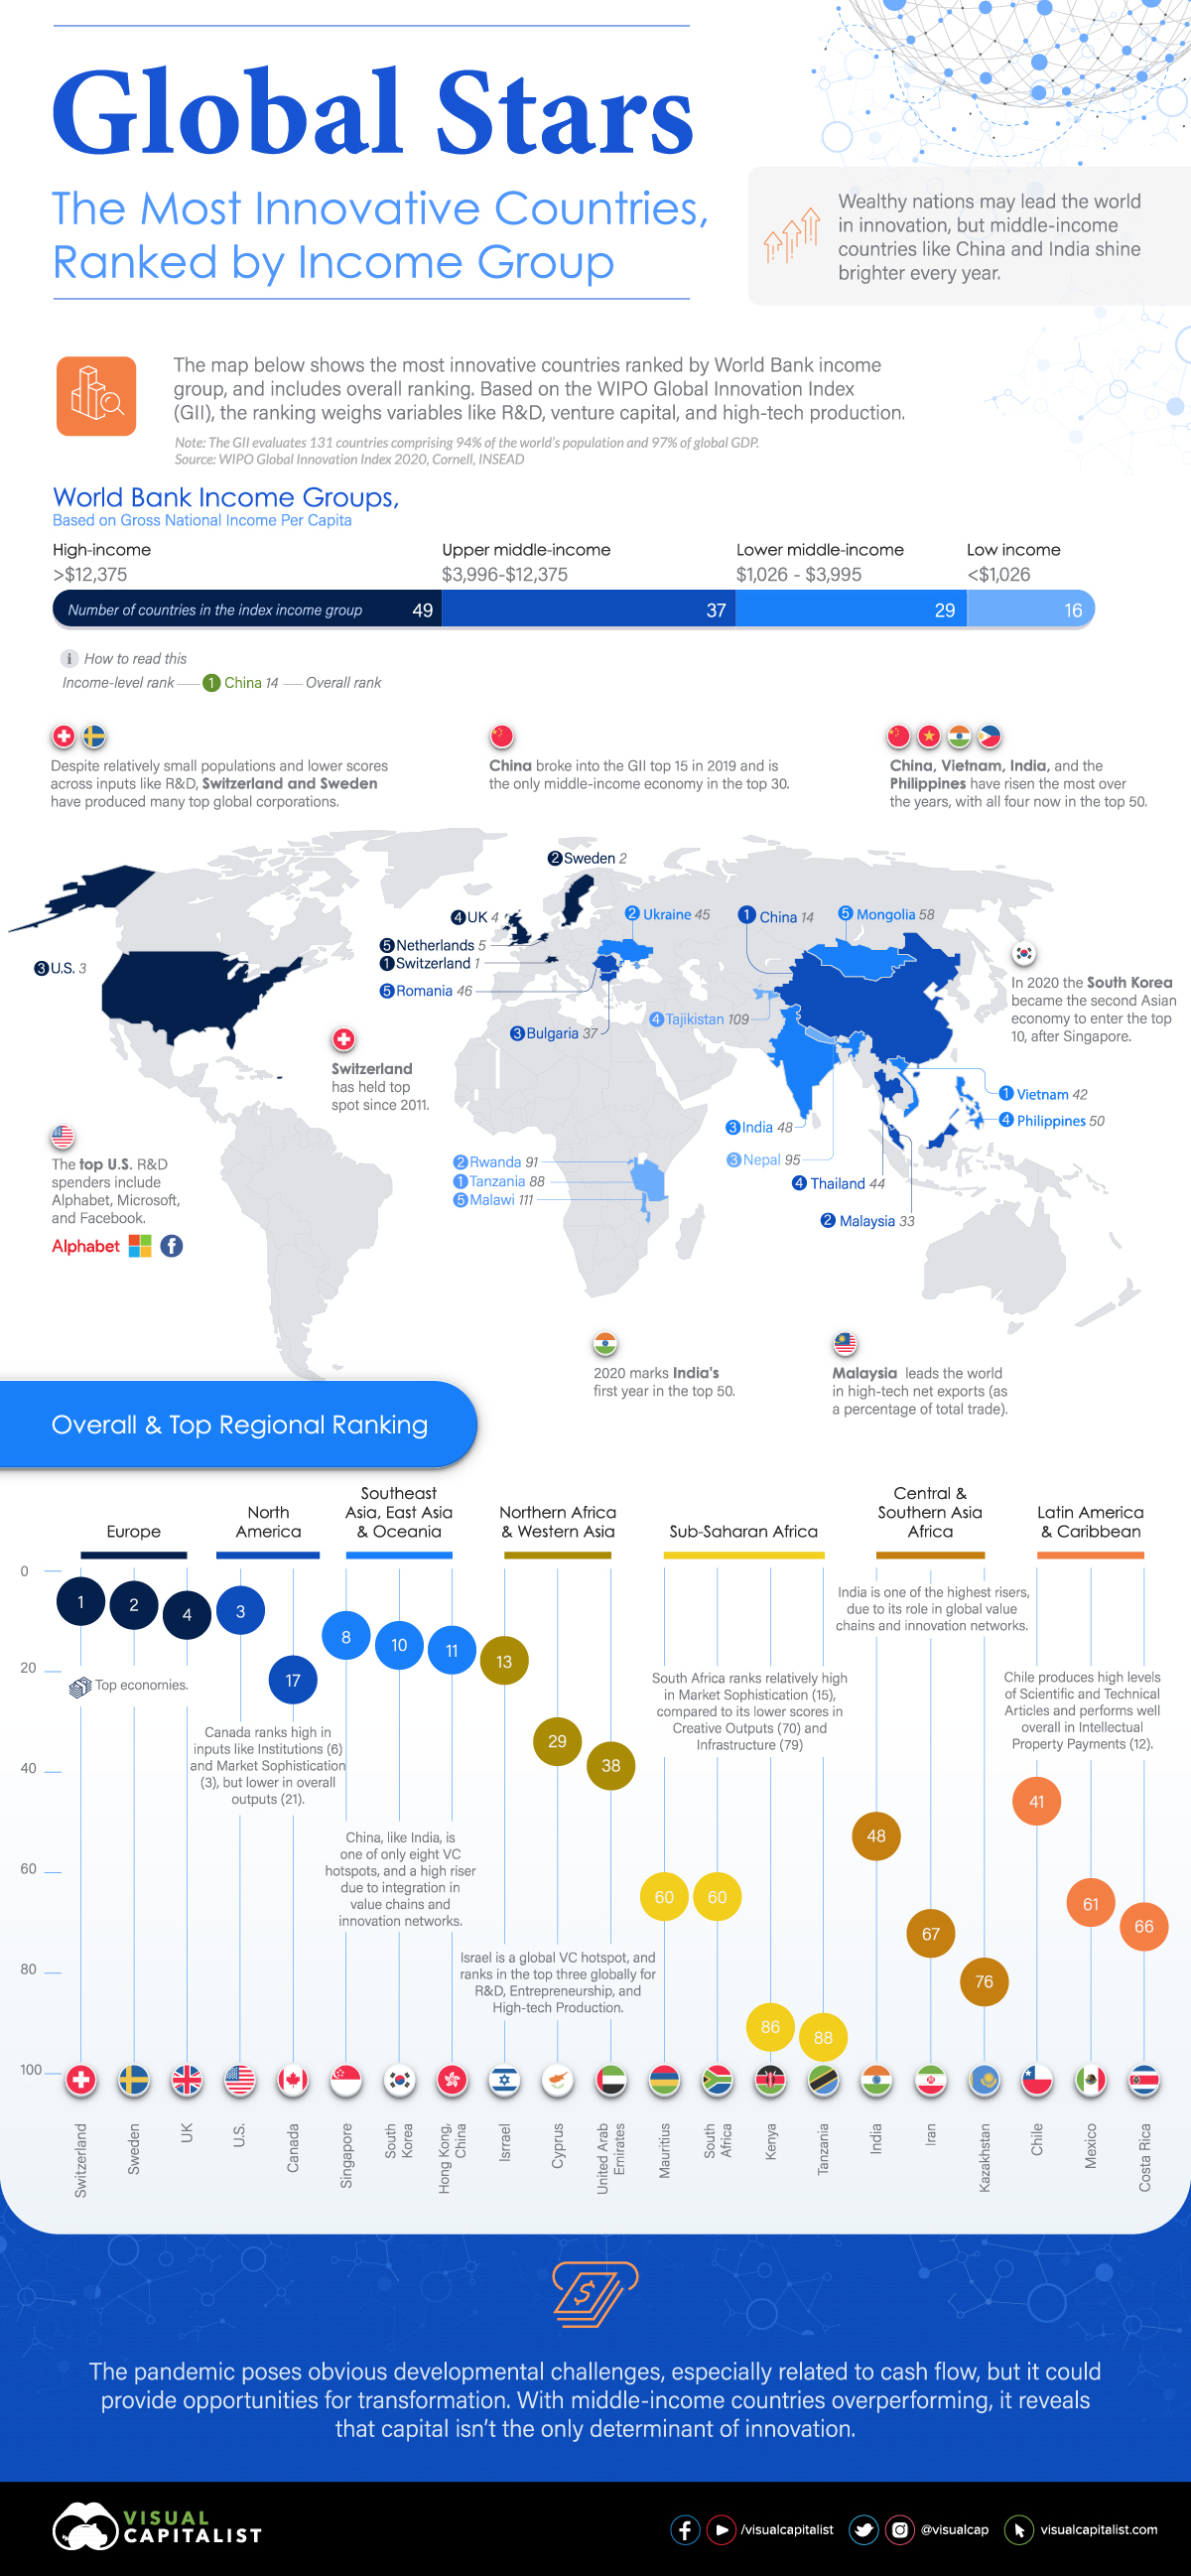


The Most Innovative Countries, Ranked by Income Group
Innovation can be instrumental to the success of economies, at macro and micro scales. While investment provides powerful fuel for innovation—the relationship isn’t always straightforward.
The 2020 ranking from the World Intellectual Property Organization (WIPO) reveals just that.
The above map breaks down the most innovative countries in each World Bank income group, based on data from WIPO’s Global Innovation Index (GII), which evaluates nations across 80 innovation indicators like research and development (R&D), venture capital, and high-tech production.
While wealthier nations continue to lead global innovation, the GII also shows that middle-income countries—particularly in Asia—are making impressive strides.
Fueling Innovation
The economic and regulatory spheres within countries can have an enormous impact on their level of innovation—and vice versa, as innovation in turn becomes an economic driver, stimulating further investment.
The positive feedback loop between investment and innovation results in the success of some of the top countries in the table below, which shows the three most innovative countries in each income group.
| Income Group | Group Rank | Country (Overall Rank) |
|---|---|---|
| High | 1 | 🇨🇭 Switzerland (#1) |
| High | 2 | 🇸🇪 Sweden (#2) |
| High | 3 | 🇺🇸 United States of America (#3) |
| Upper Middle | 1 | 🇨🇳 China (#14) |
| Upper Middle | 2 | 🇲🇾 Malaysia (#33) |
| Upper Middle | 3 | 🇧🇬 Bulgaria (#37) |
| Lower Middle | 1 | 🇻🇳 Vietnam (#42) |
| Lower Middle | 2 | 🇺🇦 Ukraine (#45) |
| Lower Middle | 3 | 🇮🇳 India (#48) |
| Low | 1 | 🇹🇿 Tanzania (#88) |
| Low | 2 | 🇷🇼 Rwanda (#91) |
| Low | 3 | 🇲🇼 Malawi (#111) |
Switzerland, Sweden, and the U.S. are the top three in the high-income group. Considering that Switzerland has the second-highest GDP per capita globally, it is not a surprise leader on this list.
Upper middle-income countries are led by China, Malaysia, and Bulgaria. Note that China far surpasses other nations in the upper-middle-income group ranking, reaching 14th spot overall in 2020. Others in the income group only appear in the overall ranking after 30th place.
Below are several income group leaders, and some of their key areas of output:
- Switzerland: First in Knowledge Creation, second in Global Brand Value
- U.S.: First in Entertainment and Media, Computer Software Spending, Intellectual Property Receipts
- China: First in Patents Registered
- Vietnam: Second in High-Technology Net Exports
- India: First in Information and Communication Technology Services Exports
- Tanzania: 23rd in Printing and Other Media
Shining a Light on Global Innovators
Since 2011, Switzerland has led the world in innovation according to this index, and the top five countries have seen few changes in recent years.
Sweden regained second place in 2019 and the U.S. moved into third—positions they maintain in 2020. The Netherlands entered the top two in 2018 and now sits at fifth.
Here’s how the overall ranking shakes out:
| Rank | Country | Score | Income Group |
|---|---|---|---|
| 1 | Switzerland | 66.1 | High |
| 2 | Sweden | 62.5 | High |
| 3 | United States of America | 60.6 | High |
| 4 | United Kingdom | 59.8 | High |
| 5 | Netherlands | 58.8 | High |
| 6 | Denmark | 57.5 | High |
| 7 | Finland | 57.0 | High |
| 8 | Singapore | 56.6 | High |
| 9 | Germany | 56.6 | High |
| 10 | South Korea | 56.1 | High |
| 11 | Hong Kong, China | 54.2 | High |
| 12 | France | 53.7 | High |
| 13 | Israel | 53.6 | High |
| 14 | China | 53.3 | Upper Middle |
| 15 | Ireland | 53.1 | High |
| 16 | Japan | 52.7 | High |
| 17 | Canada | 52.3 | High |
| 18 | Luxembourg | 50.8 | High |
| 19 | Austria | 50.1 | High |
| 20 | Norway | 49.3 | High |
| 21 | Iceland | 49.2 | High |
| 22 | Belgium | 49.1 | High |
| 23 | Australia | 48.4 | High |
| 24 | Czech Republic | 48.3 | High |
| 25 | Estonia | 48.3 | High |
| 26 | New Zealand | 47.0 | High |
| 27 | Malta | 46.4 | High |
| 28 | Italy | 45.7 | High |
| 29 | Cyprus | 45.7 | High |
| 30 | Spain | 45.6 | High |
| 31 | Portugal | 43.5 | High |
| 32 | Slovenia | 42.9 | High |
| 33 | Malaysia | 42.4 | Upper Middle |
| 34 | United Arab Emiratesx | 42.4 | High |
| 35 | Hungary | 41.5 | High |
| 36 | Latvia | 41.1 | High |
| 37 | Bulgaria | 40.0 | Upper Middle |
| 38 | Poland | 40.0 | High |
| 39 | Slovakia | 39.7 | High |
| 40 | Lithuania | 39.2 | High |
| 41 | Croatia | 37.3 | High |
| 42 | Viet Nam | 37.1 | Lower Middle |
| 43 | Greece | 36.8 | High |
| 44 | Thailand | 36.7 | Upper Middle |
| 45 | Ukraine | 36.3 | Lower Middle |
| 46 | Romania | 36.0 | Upper Middle |
| 47 | Russian Federation | 35.6 | Upper Middle |
| 48 | India | 35.6 | Lower Middle |
| 49 | Montenegro | 35.4 | Upper Middle |
| 50 | Philippines | 35.2 | Lower Middle |
| 51 | Turkey | 34.9 | Upper Middle |
| 52 | Mauritius | 34.4 | Upper Middle |
| 53 | Serbia | 34.3 | Upper Middle |
| 54 | Chile | 33.9 | High |
| 55 | Mexico | 33.6 | Upper Middle |
| 56 | Costa Rica | 33.5 | Upper Middle |
| 57 | North Macedonia | 33.4 | Upper Middle |
| 58 | Mongolia | 33.4 | Lower Middle |
| 59 | Republic of Moldova | 33.0 | Lower Middle |
| 60 | South Africa | 32.7 | Upper Middle |
| 61 | Armenia | 32.6 | Upper Middle |
| 62 | Brazil | 31.9 | Upper Middle |
| 63 | Georgia | 31.8 | Upper Middle |
| 64 | Belarus | 31.3 | Upper Middle |
| 65 | Tunisia | 31.2 | Lower Middle |
| 66 | Saudi Arabia | 30.9 | High |
| 67 | Iran (Islamic Republic of) | 30.9 | High |
| 68 | Colombia | 30.8 | Upper Middle |
| 69 | Uruguay | 30.8 | High |
| 70 | Qatar | 30.8 | High |
| 71 | Brunei Darussalam | 29.8 | High |
| 72 | Jamaica | 29.1 | Upper Middle |
| 73 | Panama | 29.0 | High |
| 74 | Bosnia and Herzegovina | 29.0 | Upper Middle |
| 75 | Morocco | 29.0 | Lower Middle |
| 76 | Peru | 28.8 | Upper Middle |
| 77 | Kazakhstan | 28.6 | Upper Middle |
| 78 | Kuwait | 28.4 | High |
| 79 | Bahrain | 28.4 | High |
| 80 | Argentina | 28.3 | Upper Middle |
| 81 | Jordan | 27.8 | Upper Middle |
| 82 | Azerbaijan | 27.2 | Upper Middle |
| 83 | Albania | 27.1 | Upper Middle |
| 84 | Oman | 26.5 | High |
| 85 | Indonesia | 26.5 | Lower Middle |
| 86 | Kenya | 26.1 | Lower Middle |
| 87 | Lebanon | 26.0 | Upper Middle |
| 88 | United Republic of Tanzania | 25.6 | Lower I |
| 89 | Botswana | 25.4 | Upper Middle |
| 90 | Dominican Republic | 25.1 | Upper Middle |
| 91 | Rwanda | 25.1 | Lower I |
| 92 | El Salvador | 24.9 | Lower Middle |
| 93 | Uzbekistan | 24.5 | Lower Middle |
| 94 | Kyrgyzstan | 24.5 | Lower Middle |
| 95 | Nepal | 24.4 | Lower I |
| 96 | Egypt | 24.2 | Lower Middle |
| 97 | Paraguay | 24.1 | Upper Middle |
| 98 | Trinidad and Tobago | 24.1 | High |
| 99 | Ecuador | 24.1 | Upper Middle |
| 100 | Cabo Verde | 23.9 | Lower Middle |
| 101 | Sri Lanka | 23.8 | Upper Middle |
| 102 | Senegal | 23.8 | Lower Middle |
| 103 | Honduras | 23.0 | Lower Middle |
| 104 | Namibia | 22.5 | Upper Middle |
| 105 | Bolivia (Plurinational State of) | 22.4 | Lower Middle |
| 106 | Guatemala | 22.4 | Upper Middle |
| 107 | Pakistan | 22.3 | Lower Middle |
| 108 | Ghana | 22.3 | Lower Middle |
| 109 | Tajikistan | 22.2 | Lower I |
| 110 | Cambodia | 21.5 | Lower Middle |
| 111 | Malawi | 21.4 | Lower I |
| 112 | Côte d’Ivoire | 21.2 | Lower Middle |
| 113 | Lao People’s Democratic Republic | 20.7 | Lower Middle |
| 114 | Uganda | 20.5 | Lower I |
| 115 | Madagascar | 20.4 | Lower I |
| 116 | Bangladesh | 20.4 | Lower Middle |
| 117 | Nigeria | 20.1 | Lower Middle |
| 118 | Burkina Faso | 20.0 | Lower I |
| 119 | Cameroon | 20.0 | Lower Middle |
| 120 | Zimbabwe | 20.0 | Lower Middle |
| 121 | Algeria | 19.5 | Upper Middle |
| 122 | Zambia | 19.4 | Lower Middle |
| 123 | Mali | 19.2 | Lower I |
| 124 | Mozambique | 18.7 | Lower I |
| 125 | Togo | 18.5 | Lower I |
| 126 | Benin | 18.1 | Lower I |
| 127 | Ethiopia | 18.1 | Lower I |
| 128 | Niger | 17.8 | Lower I |
| 129 | Myanmar | 17.7 | Lower Middle |
| 130 | Guinea | 17.3 | Lower I |
| 131 | Yemen | 13.6 | Lower I |
Nordic countries like Sweden, Denmark, and Finland continue their strong showing across innovation factors—like Knowledge Creation, Global Brand Value, Environmental Performance, and Intellectual Property Receipts—leading to their continued presence atop global innovators.
But the nations making the biggest moves in GII ranking are found in Asia.
China, Vietnam, India, and the Philippines have risen the most of all countries, with all four now in the top 50. China broke into the top 15 in 2019 and remains the only middle-income economy in the top 30.
In 2020, South Korea became the second Asian economy to enter the top 10, after Singapore. As the first Asian country to move into the global top five, Singapore joined the leaders in 2018, and now sits at 8th place.
In another first for 2020, India has now broken into the top 50.
Innovation Input & Output: The Overachievers
While annual rankings like these confirm the importance of a robust economy and innovation investment, variations in the relationship between input and output are not uncommon.
The correlation between wealth and innovation isn’t always straightforward, and neither is the connection between innovation input and output.
Below is an overview of the GII inputs and outputs, as well as several of the world’s overall leaders in each pillar.
Input variables can be characterized as factors that foster innovation—everything from the quality of a country’s university institutions to its levels of ecological sustainability.
| Input Pillars | Input Examples | Input Leaders |
|---|---|---|
| Institutions Human Capital & Research Infrastructure Market Sophistication Business Sophistication | University Institutions Regulatory Environment Intangible Assets Entrepreneurship R&D Spending Venture Capital Deals Researchers | 1. Singapore 2. Switzerland 3. Sweden 4. U.S. 5. Denmark 6. U.K. 7. Hong Kong, China 8. Finland 9. Canada 10. South Korea |
Output factors include innovation indicators like the creation of new businesses, and even the number of Wikipedia edits made per million people.
| Output Pillars | Output Types | Output Leaders |
|---|---|---|
| Knowledge & Technology Creative | Registered patents Creative goods and services Scientific publications National feature films Entertainment and media High-tech manufacturing | 1. Switzerland 2. Sweden 3. United Kingdom 4. Netherlands 5. U.S.A. 6. China 7. Germany 8. Finland 9. Denmark 10. South Korea |
Countries with impressive innovation outputs compared to input levels include:
- China: 26th in inputs, but sixth in overall innovation outputs
- Netherlands: 11th in innovation input, but fourth across outputs
- Thailand: 48th in overall input, first in business R&D
- Malaysia: 34th in overall input, first in high-tech net exports
Innovation Fuel Reductions Up Ahead?
Although financial markets have ignited, the economy as a whole has not fared well since lockdowns began. This begs the question of whether a steep decline in innovation capital will follow.
In response to the 2020 pandemic, will spending on R&D echo the 2009 recession and aftermath of 9/11? Will venture capital flows continue to decline more than they have since 2018?
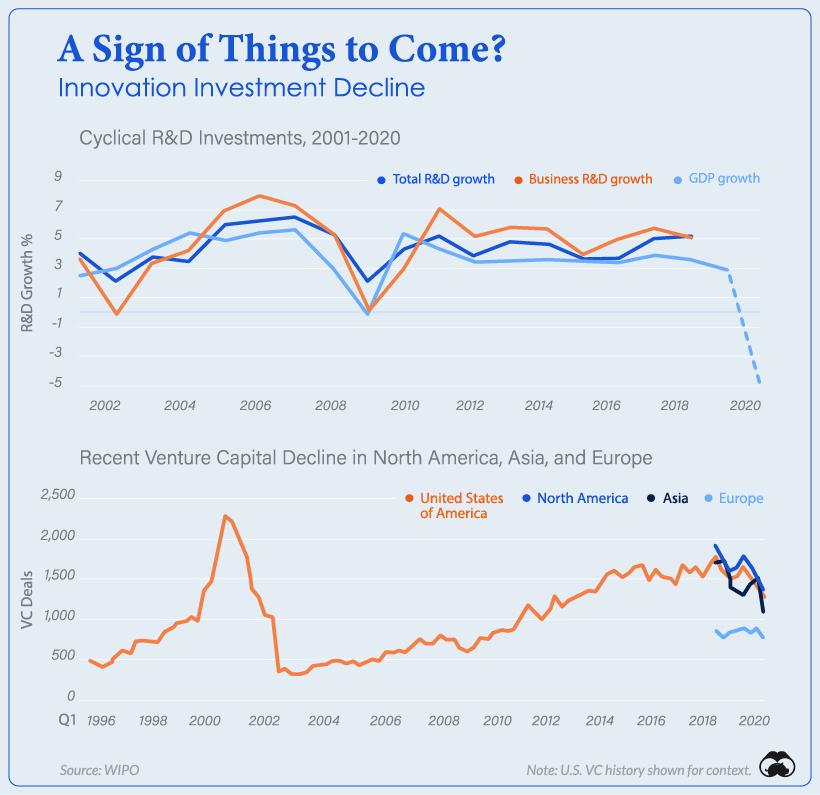
Because innovation is so entwined with the economic growth strategies of companies and nations alike, the WIPO notes that the potential decline may not be as severe as historical trends might suggest.
No Stopping Human Innovation
Thankfully, innovation opportunities are not solely contingent on the level of capital infused during any given year. Instead, the cumulative results of continuous innovation stimuli may be enough to maintain growth, while strategic cash reserves are put to use.
What the GII ranking shows is that inputs don’t always equal outputs—and that innovative strides can be made with even modest levels of capital flow.


Economy
Economic Growth Forecasts for G7 and BRICS Countries in 2024
The IMF has released its economic growth forecasts for 2024. How do the G7 and BRICS countries compare?


G7 & BRICS Real GDP Growth Forecasts for 2024
The International Monetary Fund’s (IMF) has released its real gross domestic product (GDP) growth forecasts for 2024, and while global growth is projected to stay steady at 3.2%, various major nations are seeing declining forecasts.
This chart visualizes the 2024 real GDP growth forecasts using data from the IMF’s 2024 World Economic Outlook for G7 and BRICS member nations along with Saudi Arabia, which is still considering an invitation to join the bloc.
Get the Key Insights of the IMF’s World Economic Outlook
Want a visual breakdown of the insights from the IMF’s 2024 World Economic Outlook report?
This visual is part of a special dispatch of the key takeaways exclusively for VC+ members.
Get the full dispatch of charts by signing up to VC+.
Mixed Economic Growth Prospects for Major Nations in 2024
Economic growth projections by the IMF for major nations are mixed, with the majority of G7 and BRICS countries forecasted to have slower growth in 2024 compared to 2023.
Only three BRICS-invited or member countries, Saudi Arabia, the UAE, and South Africa, have higher projected real GDP growth rates in 2024 than last year.
| Group | Country | Real GDP Growth (2023) | Real GDP Growth (2024P) |
|---|---|---|---|
| G7 | 🇺🇸 U.S. | 2.5% | 2.7% |
| G7 | 🇨🇦 Canada | 1.1% | 1.2% |
| G7 | 🇯🇵 Japan | 1.9% | 0.9% |
| G7 | 🇫🇷 France | 0.9% | 0.7% |
| G7 | 🇮🇹 Italy | 0.9% | 0.7% |
| G7 | 🇬🇧 UK | 0.1% | 0.5% |
| G7 | 🇩🇪 Germany | -0.3% | 0.2% |
| BRICS | 🇮🇳 India | 7.8% | 6.8% |
| BRICS | 🇨🇳 China | 5.2% | 4.6% |
| BRICS | 🇦🇪 UAE | 3.4% | 3.5% |
| BRICS | 🇮🇷 Iran | 4.7% | 3.3% |
| BRICS | 🇷🇺 Russia | 3.6% | 3.2% |
| BRICS | 🇪🇬 Egypt | 3.8% | 3.0% |
| BRICS-invited | 🇸🇦 Saudi Arabia | -0.8% | 2.6% |
| BRICS | 🇧🇷 Brazil | 2.9% | 2.2% |
| BRICS | 🇿🇦 South Africa | 0.6% | 0.9% |
| BRICS | 🇪🇹 Ethiopia | 7.2% | 6.2% |
| 🌍 World | 3.2% | 3.2% |
China and India are forecasted to maintain relatively high growth rates in 2024 at 4.6% and 6.8% respectively, but compared to the previous year, China is growing 0.6 percentage points slower while India is an entire percentage point slower.
On the other hand, four G7 nations are set to grow faster than last year, which includes Germany making its comeback from its negative real GDP growth of -0.3% in 2023.
Faster Growth for BRICS than G7 Nations
Despite mostly lower growth forecasts in 2024 compared to 2023, BRICS nations still have a significantly higher average growth forecast at 3.6% compared to the G7 average of 1%.
While the G7 countries’ combined GDP is around $15 trillion greater than the BRICS nations, with continued higher growth rates and the potential to add more members, BRICS looks likely to overtake the G7 in economic size within two decades.
BRICS Expansion Stutters Before October 2024 Summit
BRICS’ recent expansion has stuttered slightly, as Argentina’s newly-elected president Javier Milei declined its invitation and Saudi Arabia clarified that the country is still considering its invitation and has not joined BRICS yet.
Even with these initial growing pains, South Africa’s Foreign Minister Naledi Pandor told reporters in February that 34 different countries have submitted applications to join the growing BRICS bloc.
Any changes to the group are likely to be announced leading up to or at the 2024 BRICS summit which takes place October 22-24 in Kazan, Russia.
Get the Full Analysis of the IMF’s Outlook on VC+
This visual is part of an exclusive special dispatch for VC+ members which breaks down the key takeaways from the IMF’s 2024 World Economic Outlook.
For the full set of charts and analysis, sign up for VC+.

-

 Markets1 week ago
U.S. Debt Interest Payments Reach $1 Trillion
-

 Markets2 weeks ago
Ranked: The Most Valuable Housing Markets in America
-

 Money2 weeks ago
Which States Have the Highest Minimum Wage in America?
-

 AI2 weeks ago
Ranked: Semiconductor Companies by Industry Revenue Share
-

 Markets2 weeks ago
Ranked: The World’s Top Flight Routes, by Revenue
-

 Countries2 weeks ago
Population Projections: The World’s 6 Largest Countries in 2075
-

 Markets2 weeks ago
The Top 10 States by Real GDP Growth in 2023
-

 Money2 weeks ago
The Smallest Gender Wage Gaps in OECD Countries