Markets
Mapped: The Top 30 Most Valuable Real Estate Cities in the U.S.


The Most Valuable Real Estate Cities in America
According to real estate tycoon Harold Samuel, there are three things that matter when it comes to real estate value—location, location, and location.
America’s property market is no exception to this rule. Depending on the city and its—you guessed it—location, there are vast discrepancies in real estate value across the country.
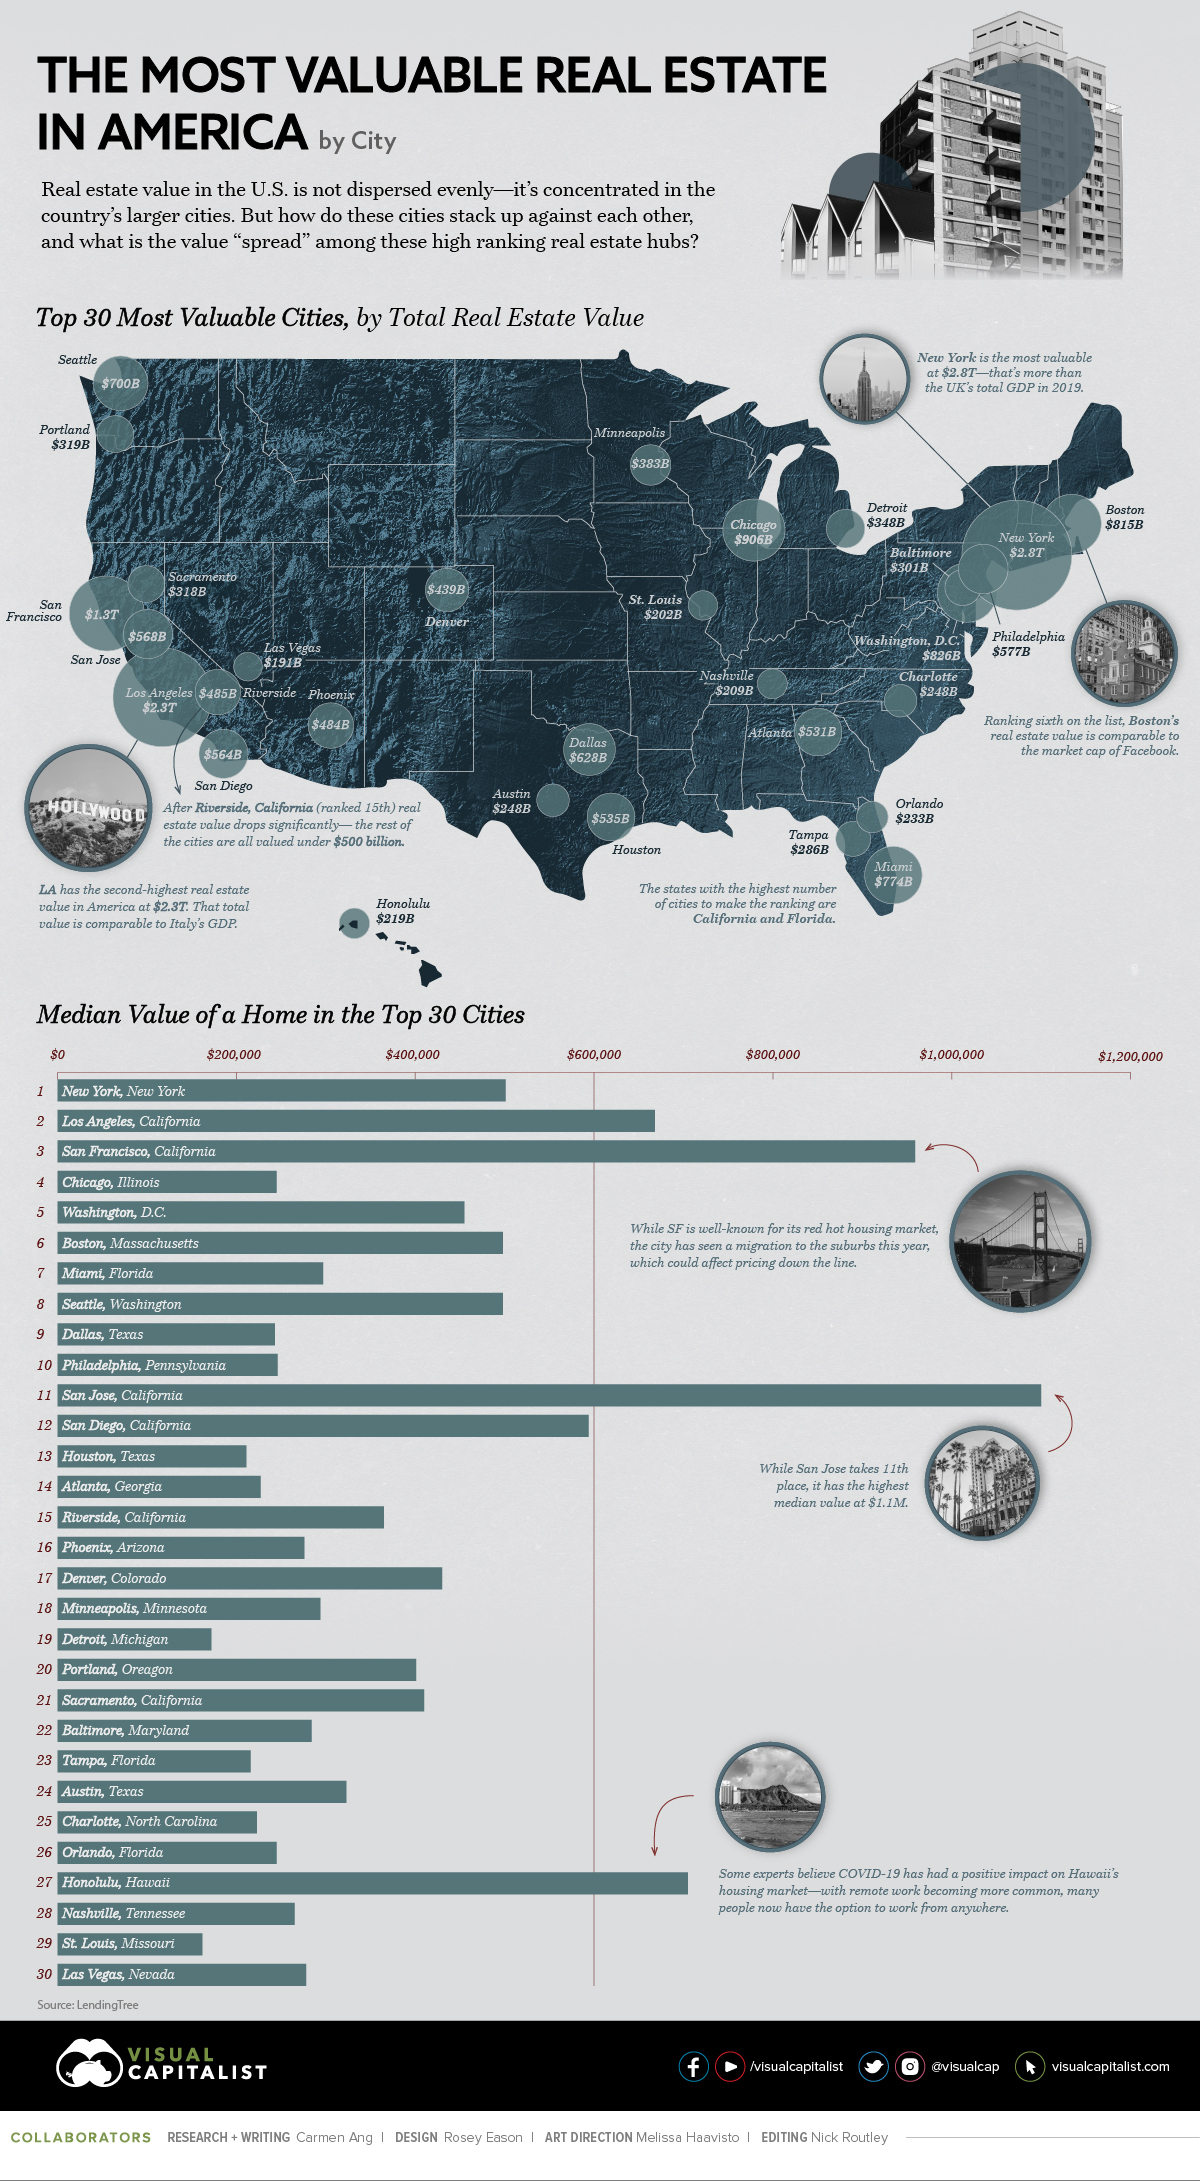
Using the latest data from LendingTree, this graphic ranks the top 30 most valuable real estate cities in America. We’ll also evaluate the top cities based on median value of homes, and how COVID-19 has impacted the market.
The Most Valuable Real Estate Cities
Out of the $32.6 trillion of total real estate value included in LendingTree’s database, the top 30 cities account for almost 57%:
| Rank | City | State | Total Value (in billions) |
|---|---|---|---|
| 1 | New York | New York | $2,838 |
| 2 | Los Angeles | California | $2,289 |
| 3 | San Francisco | California | $1,320 |
| 4 | Chicago | Illinois | $906 |
| 5 | Washington, D.C. | -- | $826 |
| 6 | Boston | Massachusetts | $815 |
| 7 | Miami | Florida | $774 |
| 8 | Seattle | Washington | $700 |
| 9 | Dallas | Texas | $628 |
| 10 | Philadelphia | Pennsylvania | $577 |
| 11 | San Jose, Calif. | California | $568 |
| 12 | San Diego | California | $564 |
| 13 | Houston | Texas | $535 |
| 14 | Atlanta | Georgia | $531 |
| 15 | Riverside, Calif. | California | $485 |
| 16 | Phoenix | Arizona | $484 |
| 17 | Denver | Colorado | $439 |
| 18 | Minneapolis | Minnesota | $383 |
| 19 | Detroit | Michigan | $348 |
| 20 | Portland, Ore. | Oregon | $319 |
| 21 | Sacramento, Calif. | California | $318 |
| 22 | Baltimore | Maryland | $301 |
| 23 | Tampa, Fla. | Florida | $286 |
| 24 | Austin, Texas | Texas | $248 |
| 25 | Charlotte, N.C | North Carolina | $248 |
| 26 | Orlando, Fla. | Florida | $233 |
| 27 | Honolulu | Hawaii | $219 |
| 28 | Nashville, Tenn. | Tennessee | $209 |
| 29 | St. Louis | Missouri | $202 |
| 30 | Las Vegas | Nevada | $191 |
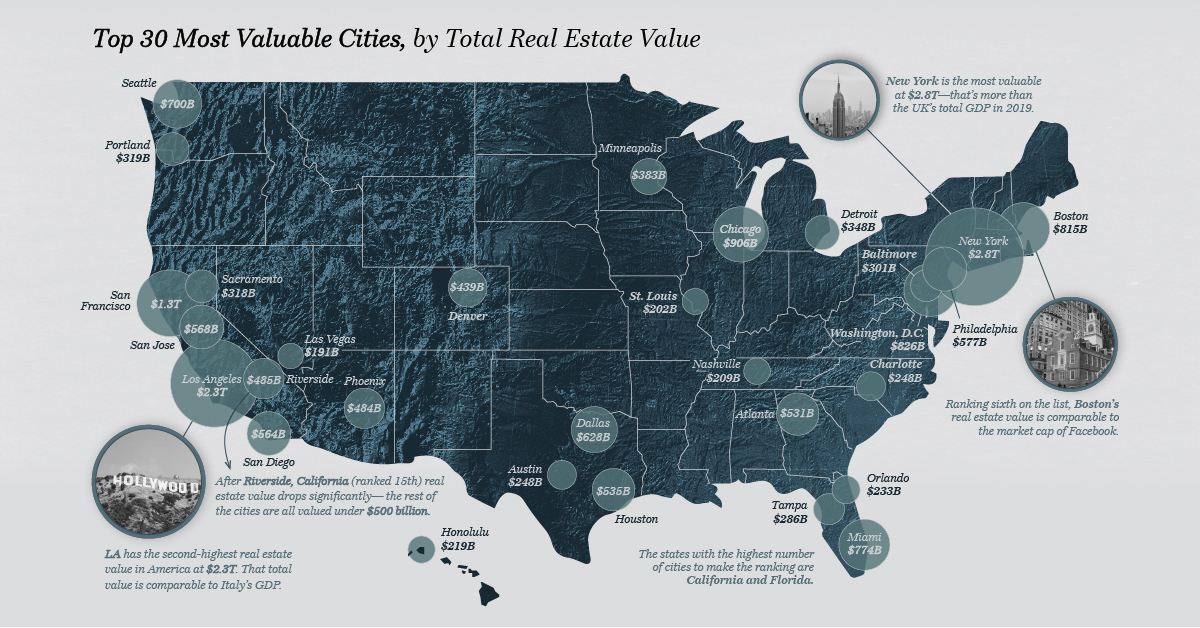
New York has the highest real estate value in the country at $2.8 trillion—that’s around the size of the UK’s GDP in 2019. Close behind is Los Angeles at $2.3 trillion, while San Francisco ranks third at $1.3 trillion.
This may not come as a surprise, considering the popularity of these areas. New York and Los Angeles have the two highest city populations in the U.S., and San Francisco is the second most densely populated city in America (after New York). Historically, these areas have been notorious for their red-hot real estate markets, limited housing supply, and high costs of living.
However, while these cities take the top three spots when it comes to total real estate value, the ranking looks a bit different when comparing the median value of each city.
Most Valuable Cities, by Median Home Value
When it comes to median home value, San Jose claims the top spot at $1.1 million, while San Francisco places second at $959K:
| Rank | City | State | Median Value of a Home |
|---|---|---|---|
| 1 | San Jose | California | $1,100,000 |
| 2 | San Francisco | California | $959,000 |
| 3 | Honolulu | Hawaii | $705,000 |
| 4 | Los Angeles | California | $668,000 |
| 5 | San Diego | California | $594,000 |
| 6 | Oxnard | California | $586,000 |
| 7 | New York | New York | $501,000 |
| 8 | Boston | Massachusetts | $498,000 |
| 9 | Seattle | Washington | $498,000 |
| 10 | Washington, D.C. | -- | $455,000 |
| 11 | Denver | Colorado | $430,000 |
| 12 | Sacramento | California | $410,000 |
| 13 | Bridgeport | Connecticut | $410,000 |
| 14 | Portland | Oregon | $401,000 |
| 15 | Riverside | California | $365,000 |
| 16 | Naples | Florida | $329,000 |
| 17 | Austin | Texas | $323,000 |
| 18 | Salt Lake City | Utah | $312,000 |
| 19 | Providence | Rhode Island | $300,000 |
| 20 | Miami | Florida | $297,000 |
| 21 | Minneapolis | Minnesota | $294,000 |
| 22 | Baltimore | Maryland | $284,000 |
| 23 | Las Vegas | Nevada | $278,000 |
| 24 | Phoenix | Arizona | $276,000 |
| 25 | Raleigh | North Carolina | $271,000 |
| 26 | Nashville | Tennessee | $265,000 |
| 27 | Philadelphia | Pennsylvania | $246,000 |
| 28 | Chicago | Illinois | $245,000 |
| 29 | Orlando | Florida | $245,000 |
| 30 | North Port | Florida | $244,000 |
The Bay Area leads the pack in terms of median value, but San Francisco and San Jose aren’t the only Californian cities to make the list. In fact, half of the top 10 cities are in the Golden State.
Suburban Shuffle
It’s important to note that these numbers are from January 2020, before the global pandemic triggered numerous societal and economic changes, including an accelerated migration to the suburbs from key urban centers like New York and San Francisco.
This mass exodus has negatively impacted sales activity. In fall 2020, or example, home sales in New York dropped by 50% compared to last year.
In contrast, places like Honolulu have seen significant growth in home sales—in September 2020, single-family home sales rose by 12.7% compared to last year. Some experts believe COVID has been a key factor driving this growth, as more people are able to work from anywhere, thanks to remote work.


Markets
Mapped: Europe’s GDP Per Capita, by Country
Which European economies are richest on a GDP per capita basis? This map shows the results for 44 countries across the continent.


Mapped: Europe’s GDP Per Capita, by Country (2024)
This was originally posted on our Voronoi app. Download the app for free on iOS or Android and discover incredible data-driven charts from a variety of trusted sources.
Europe is home to some of the largest and most sophisticated economies in the world. But how do countries in the region compare with each other on a per capita productivity basis?
In this map, we show Europe’s GDP per capita levels across 44 nations in current U.S. dollars. Data for this visualization and article is sourced from the International Monetary Fund (IMF) via their DataMapper tool, updated April 2024.
Europe’s Richest and Poorest Nations, By GDP Per Capita
Luxembourg, Ireland, and Switzerland, lead the list of Europe’s richest nations by GDP per capita, all above $100,000.
| Rank | Country | GDP Per Capita (2024) |
|---|---|---|
| 1 | 🇱🇺 Luxembourg | $131,380 |
| 2 | 🇮🇪 Ireland | $106,060 |
| 3 | 🇨🇭 Switzerland | $105,670 |
| 4 | 🇳🇴 Norway | $94,660 |
| 5 | 🇮🇸 Iceland | $84,590 |
| 6 | 🇩🇰 Denmark | $68,900 |
| 7 | 🇳🇱 Netherlands | $63,750 |
| 8 | 🇸🇲 San Marino | $59,410 |
| 9 | 🇦🇹 Austria | $59,230 |
| 10 | 🇸🇪 Sweden | $58,530 |
| 11 | 🇧🇪 Belgium | $55,540 |
| 12 | 🇫🇮 Finland | $55,130 |
| 13 | 🇩🇪 Germany | $54,290 |
| 14 | 🇬🇧 UK | $51,070 |
| 15 | 🇫🇷 France | $47,360 |
| 16 | 🇦🇩 Andorra | $44,900 |
| 17 | 🇲🇹 Malta | $41,740 |
| 18 | 🇮🇹 Italy | $39,580 |
| 19 | 🇨🇾 Cyprus | $37,150 |
| 20 | 🇪🇸 Spain | $34,050 |
| 21 | 🇸🇮 Slovenia | $34,030 |
| 22 | 🇪🇪 Estonia | $31,850 |
| 23 | 🇨🇿 Czech Republic | $29,800 |
| 24 | 🇵🇹 Portugal | $28,970 |
| 25 | 🇱🇹 Lithuania | $28,410 |
| 26 | 🇸🇰 Slovakia | $25,930 |
| 27 | 🇱🇻 Latvia | $24,190 |
| 28 | 🇬🇷 Greece | $23,970 |
| 29 | 🇭🇺 Hungary | $23,320 |
| 30 | 🇵🇱 Poland | $23,010 |
| 31 | 🇭🇷 Croatia | $22,970 |
| 32 | 🇷🇴 Romania | $19,530 |
| 33 | 🇧🇬 Bulgaria | $16,940 |
| 34 | 🇷🇺 Russia | $14,390 |
| 35 | 🇹🇷 Türkiye | $12,760 |
| 36 | 🇲🇪 Montenegro | $12,650 |
| 37 | 🇷🇸 Serbia | $12,380 |
| 38 | 🇦🇱 Albania | $8,920 |
| 39 | 🇧🇦 Bosnia & Herzegovina | $8,420 |
| 40 | 🇲🇰 North Macedonia | $7,690 |
| 41 | 🇧🇾 Belarus | $7,560 |
| 42 | 🇲🇩 Moldova | $7,490 |
| 43 | 🇽🇰 Kosovo | $6,390 |
| 44 | 🇺🇦 Ukraine | $5,660 |
| N/A | 🇪🇺 EU Average | $44,200 |
Note: Figures are rounded.
Three Nordic countries (Norway, Iceland, Denmark) also place highly, between $70,000-90,000. Other Nordic peers, Sweden and Finland rank just outside the top 10, between $55,000-60,000.
Meanwhile, Europe’s biggest economies in absolute terms, Germany, UK, and France, rank closer to the middle of the top 20, with GDP per capitas around $50,000.
Finally, at the end of the scale, Eastern Europe as a whole tends to have much lower per capita GDPs. In that group, Ukraine ranks last, at $5,660.
A Closer Look at Ukraine
For a broader comparison, Ukraine’s per capita GDP is similar to Iran ($5,310), El Salvador ($5,540), and Guatemala ($5,680).
According to experts, Ukraine’s economy has historically underperformed to expectations. After the fall of the Berlin Wall, the economy contracted for five straight years. Its transition to a Western, liberalized economic structure was overshadowed by widespread corruption, a limited taxpool, and few revenue sources.
Politically, its transformation from authoritarian regime to civil democracy has proved difficult, especially when it comes to institution building.
Finally, after the 2022 invasion of the country, Ukraine’s GDP contracted by 30% in a single year—the largest loss since independence. Large scale emigration—to the tune of six million refugees—is also playing a role.
Despite these challenges, the country’s economic growth has somewhat stabilized while fighting continues.

-

 Markets6 days ago
Visualized: Interest Rate Forecasts for Advanced Economies
-

 Markets2 weeks ago
Economic Growth Forecasts for G7 and BRICS Countries in 2024
-

 Wealth2 weeks ago
Charted: Which City Has the Most Billionaires in 2024?
-

 Technology2 weeks ago
All of the Grants Given by the U.S. CHIPS Act
-

 Green2 weeks ago
The Carbon Footprint of Major Travel Methods
-

 United States1 week ago
Visualizing the Most Common Pets in the U.S.
-

 Culture1 week ago
The World’s Top Media Franchises by All-Time Revenue
-

 voronoi1 week ago
Best Visualizations of April on the Voronoi App