Markets
Ranked: The Most Valuable Nation Brands in 2020
The Most Valuable Nation Brands in 2020
In today’s heavily interconnected world, a country’s reputation can have a big impact on its overall economic prosperity.
In fact, a country’s reputation—its brand—is arguably one of its most important assets. A strong nation brand has the power to boost tourism, attract and retain talent, and potentially bring in foreign investment.
This graphic uses data from Brand Finance’s Nation Brands 2020 report, which attempts to quantify the reputations of different countries around the world. We’ll also dive into the top 10 nation brands, and how their brand value has changed over time.
How is Nation Brand Value Quantified?
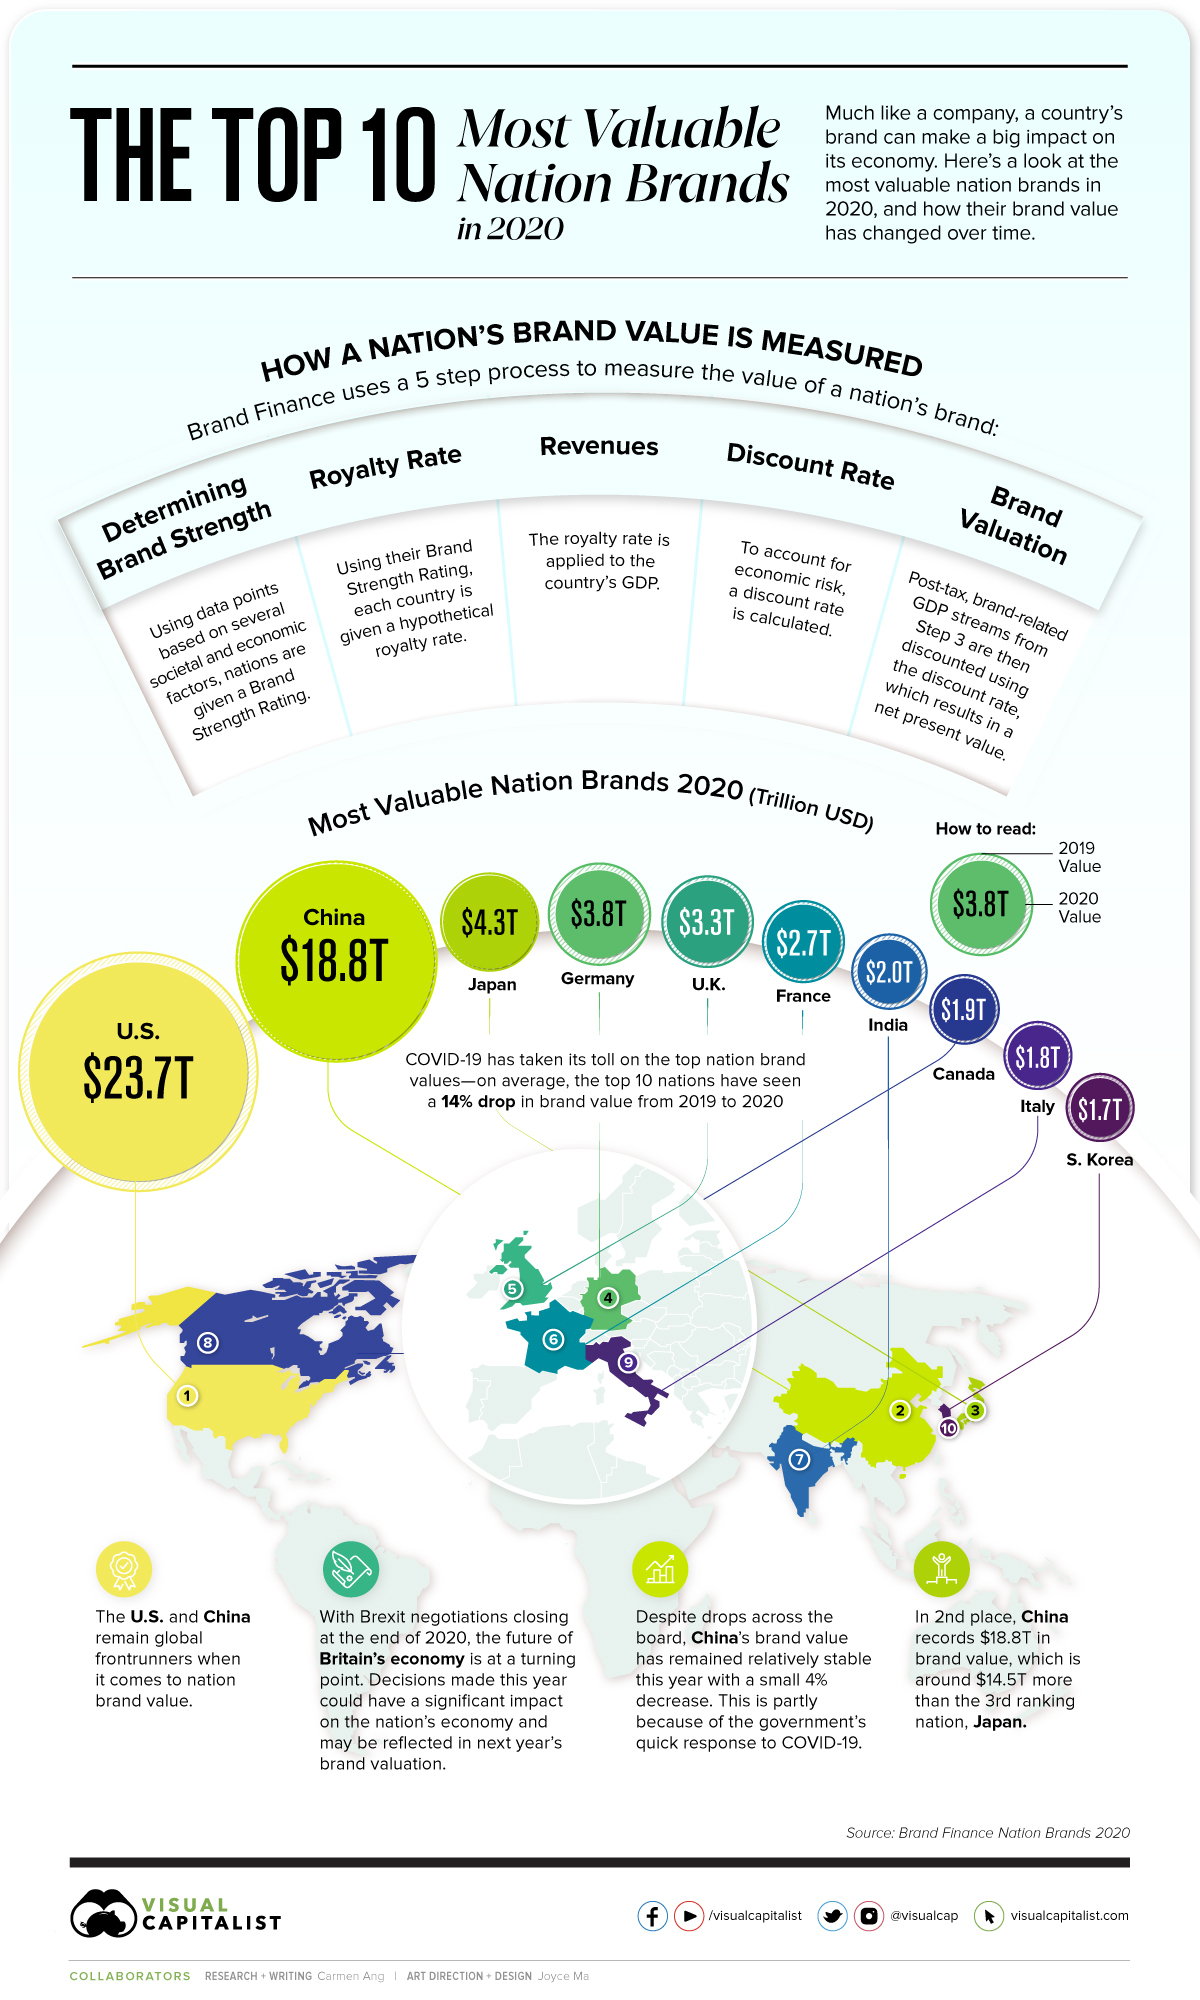
While the report provides a full explanation of its methodology, here’s a quick summary of how the scoring system works.
First, Brand Finance calculates a country’s Brand Strength Index (BSI) score using three pillars:
- Goods & Services
Openness to tourism, market size, and trade rules - Society
Quality of life, corruption, and cultural image - Investment
Talent retention, use of technology, R&D, taxation, and regulation
From there, the BSI score is used to calculate a hypothetical royalty rate, and applied to a country’s GDP. Then, a discount rate is factored in to account for economic risk. Finally, numbers are crunched to provide the “Brand Value” of a country.
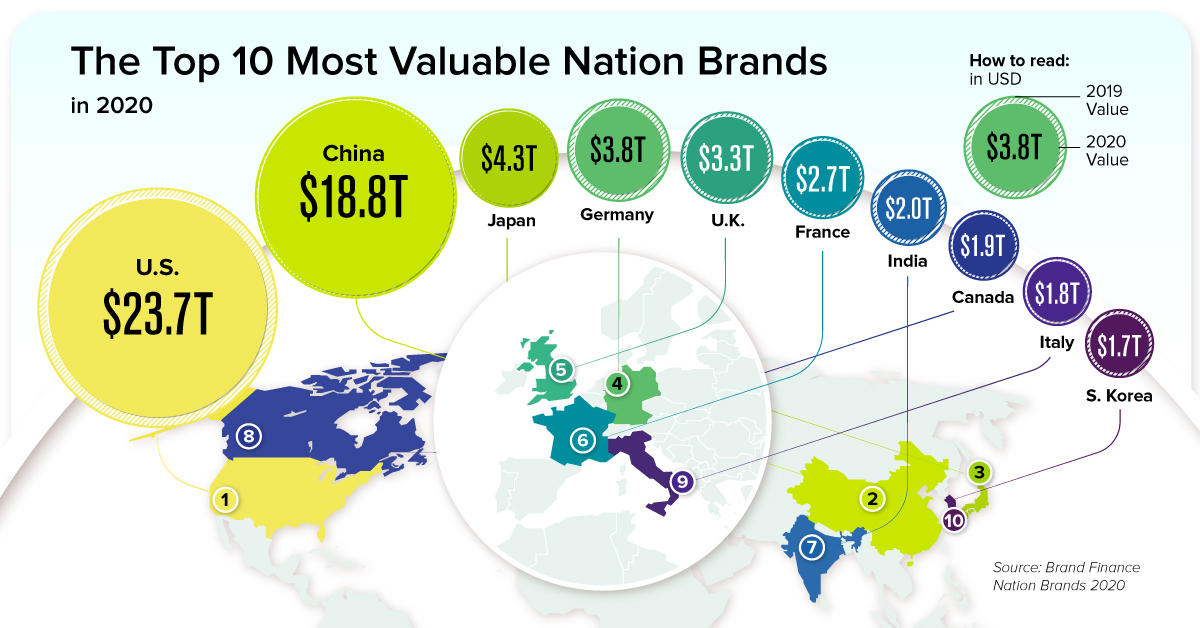
The Top 10 Most Valuable Nation Brands
In this year’s report, Brand Finance highlights the impact COVID-19 has had on nation brand values—in 2020, the top 10 nation brands have seen a 14% drop in brand value, on average.
Here are the most valuable nation brands of 2020, and their change in value since last year:
| Rank | Country | 2020 Value (USD, $T) | Change since 2019 |
|---|---|---|---|
| 1 | 🇺🇸 United States | $23.7 | -14.5% |
| 2 | 🇨🇳 China | $18.8 | -3.7% |
| 3 | 🇯🇵 Japan | $4.3 | -6.0% |
| 4 | 🇩🇪 Germany | $3.8 | -21.5% |
| 5 | 🇬🇧 United Kingdom | $3.3 | -13.9% |
| 6 | 🇫🇷 France | $2.7 | -12.8% |
| 7 | 🇮🇳 India | $2.0 | -20.8% |
| 8 | 🇨🇦 Canada | $1.9 | -13.0% |
| 9 | 🇮🇹 Italy | $1.8 | -15.8% |
| 10 | 🇰🇷 South Korea | $1.7 | -20.6% |
Despite a 14.5% decrease in value, the U.S. managed to maintain its top position with a nation brand value of $23.7 trillion.
Like many other countries, 2020 has been a tough year for America. From recording the most COVID-19 cases and deaths to dealing with a controversial presidential election, the economic powerhouse faced a tremendous amount of international scrutiny this year.
Despite all this, the United States remains one of the most successful and dominant economies worldwide—the only close competitor is China, with a nation brand value of $18.8 trillion.
Over the Years: China’s Steady Climb
While China still ranks below the U.S. in total brand value, its percentage decrease from last year was far lower than the other nations on the list. China stayed relatively stable with a modest 4% drop, about 10 percentage points less than the global average.
China’s stability this year is nothing new. In fact, the country has been steadily closing the brand value gap between itself and the U.S. since 2015:
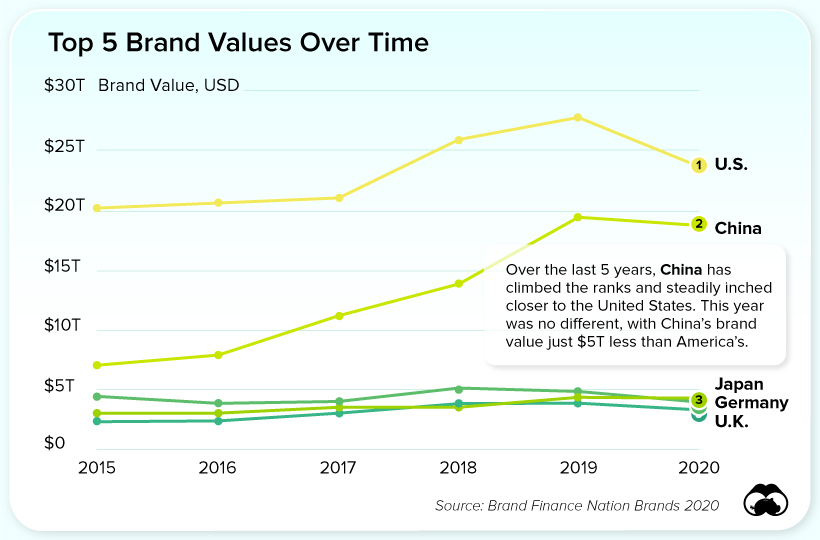
This year marks the smallest gap yet, with just a $4.9 trillion brand value difference between the U.S. and China. This is significantly lower than in previous years—for instance, in 2015 the U.S. had a $13.1 trillion lead over China.
Will America make a comeback in 2021 under a new administration, or will the gap between it and China close even further?


Markets
U.S. Debt Interest Payments Reach $1 Trillion
U.S. debt interest payments have surged past the $1 trillion dollar mark, amid high interest rates and an ever-expanding debt burden.


U.S. Debt Interest Payments Reach $1 Trillion
This was originally posted on our Voronoi app. Download the app for free on iOS or Android and discover incredible data-driven charts from a variety of trusted sources.
The cost of paying for America’s national debt crossed the $1 trillion dollar mark in 2023, driven by high interest rates and a record $34 trillion mountain of debt.
Over the last decade, U.S. debt interest payments have more than doubled amid vast government spending during the pandemic crisis. As debt payments continue to soar, the Congressional Budget Office (CBO) reported that debt servicing costs surpassed defense spending for the first time ever this year.
This graphic shows the sharp rise in U.S. debt payments, based on data from the Federal Reserve.
A $1 Trillion Interest Bill, and Growing
Below, we show how U.S. debt interest payments have risen at a faster pace than at another time in modern history:
| Date | Interest Payments | U.S. National Debt |
|---|---|---|
| 2023 | $1.0T | $34.0T |
| 2022 | $830B | $31.4T |
| 2021 | $612B | $29.6T |
| 2020 | $518B | $27.7T |
| 2019 | $564B | $23.2T |
| 2018 | $571B | $22.0T |
| 2017 | $493B | $20.5T |
| 2016 | $460B | $20.0T |
| 2015 | $435B | $18.9T |
| 2014 | $442B | $18.1T |
| 2013 | $425B | $17.2T |
| 2012 | $417B | $16.4T |
| 2011 | $433B | $15.2T |
| 2010 | $400B | $14.0T |
| 2009 | $354B | $12.3T |
| 2008 | $380B | $10.7T |
| 2007 | $414B | $9.2T |
| 2006 | $387B | $8.7T |
| 2005 | $355B | $8.2T |
| 2004 | $318B | $7.6T |
| 2003 | $294B | $7.0T |
| 2002 | $298B | $6.4T |
| 2001 | $318B | $5.9T |
| 2000 | $353B | $5.7T |
| 1999 | $353B | $5.8T |
| 1998 | $360B | $5.6T |
| 1997 | $368B | $5.5T |
| 1996 | $362B | $5.3T |
| 1995 | $357B | $5.0T |
| 1994 | $334B | $4.8T |
| 1993 | $311B | $4.5T |
| 1992 | $306B | $4.2T |
| 1991 | $308B | $3.8T |
| 1990 | $298B | $3.4T |
| 1989 | $275B | $3.0T |
| 1988 | $254B | $2.7T |
| 1987 | $240B | $2.4T |
| 1986 | $225B | $2.2T |
| 1985 | $219B | $1.9T |
| 1984 | $205B | $1.7T |
| 1983 | $176B | $1.4T |
| 1982 | $157B | $1.2T |
| 1981 | $142B | $1.0T |
| 1980 | $113B | $930.2B |
| 1979 | $96B | $845.1B |
| 1978 | $84B | $789.2B |
| 1977 | $69B | $718.9B |
| 1976 | $61B | $653.5B |
| 1975 | $55B | $576.6B |
| 1974 | $50B | $492.7B |
| 1973 | $45B | $469.1B |
| 1972 | $39B | $448.5B |
| 1971 | $36B | $424.1B |
| 1970 | $35B | $389.2B |
| 1969 | $30B | $368.2B |
| 1968 | $25B | $358.0B |
| 1967 | $23B | $344.7B |
| 1966 | $21B | $329.3B |
Interest payments represent seasonally adjusted annual rate at the end of Q4.
At current rates, the U.S. national debt is growing by a remarkable $1 trillion about every 100 days, equal to roughly $3.6 trillion per year.
As the national debt has ballooned, debt payments even exceeded Medicaid outlays in 2023—one of the government’s largest expenditures. On average, the U.S. spent more than $2 billion per day on interest costs last year. Going further, the U.S. government is projected to spend a historic $12.4 trillion on interest payments over the next decade, averaging about $37,100 per American.
Exacerbating matters is that the U.S. is running a steep deficit, which stood at $1.1 trillion for the first six months of fiscal 2024. This has accelerated due to the 43% increase in debt servicing costs along with a $31 billion dollar increase in defense spending from a year earlier. Additionally, a $30 billion increase in funding for the Federal Deposit Insurance Corporation in light of the regional banking crisis last year was a major contributor to the deficit increase.
Overall, the CBO forecasts that roughly 75% of the federal deficit’s increase will be due to interest costs by 2034.

-

 Green2 weeks ago
Ranked: Top Countries by Total Forest Loss Since 2001
-

 Travel1 week ago
Ranked: The World’s Top Flight Routes, by Revenue
-

 Technology1 week ago
Ranked: Semiconductor Companies by Industry Revenue Share
-

 Money2 weeks ago
Which States Have the Highest Minimum Wage in America?
-

 Real Estate2 weeks ago
Ranked: The Most Valuable Housing Markets in America
-

 Markets2 weeks ago
Charted: Big Four Market Share by S&P 500 Audits
-

 AI2 weeks ago
The Stock Performance of U.S. Chipmakers So Far in 2024
-

 Automotive2 weeks ago
Almost Every EV Stock is Down After Q1 2024