Markets
Ranked: The World’s Most Valuable Bank Brands (2019-2023)


The World’s Most Valuable Bank Brands (2019-2023)
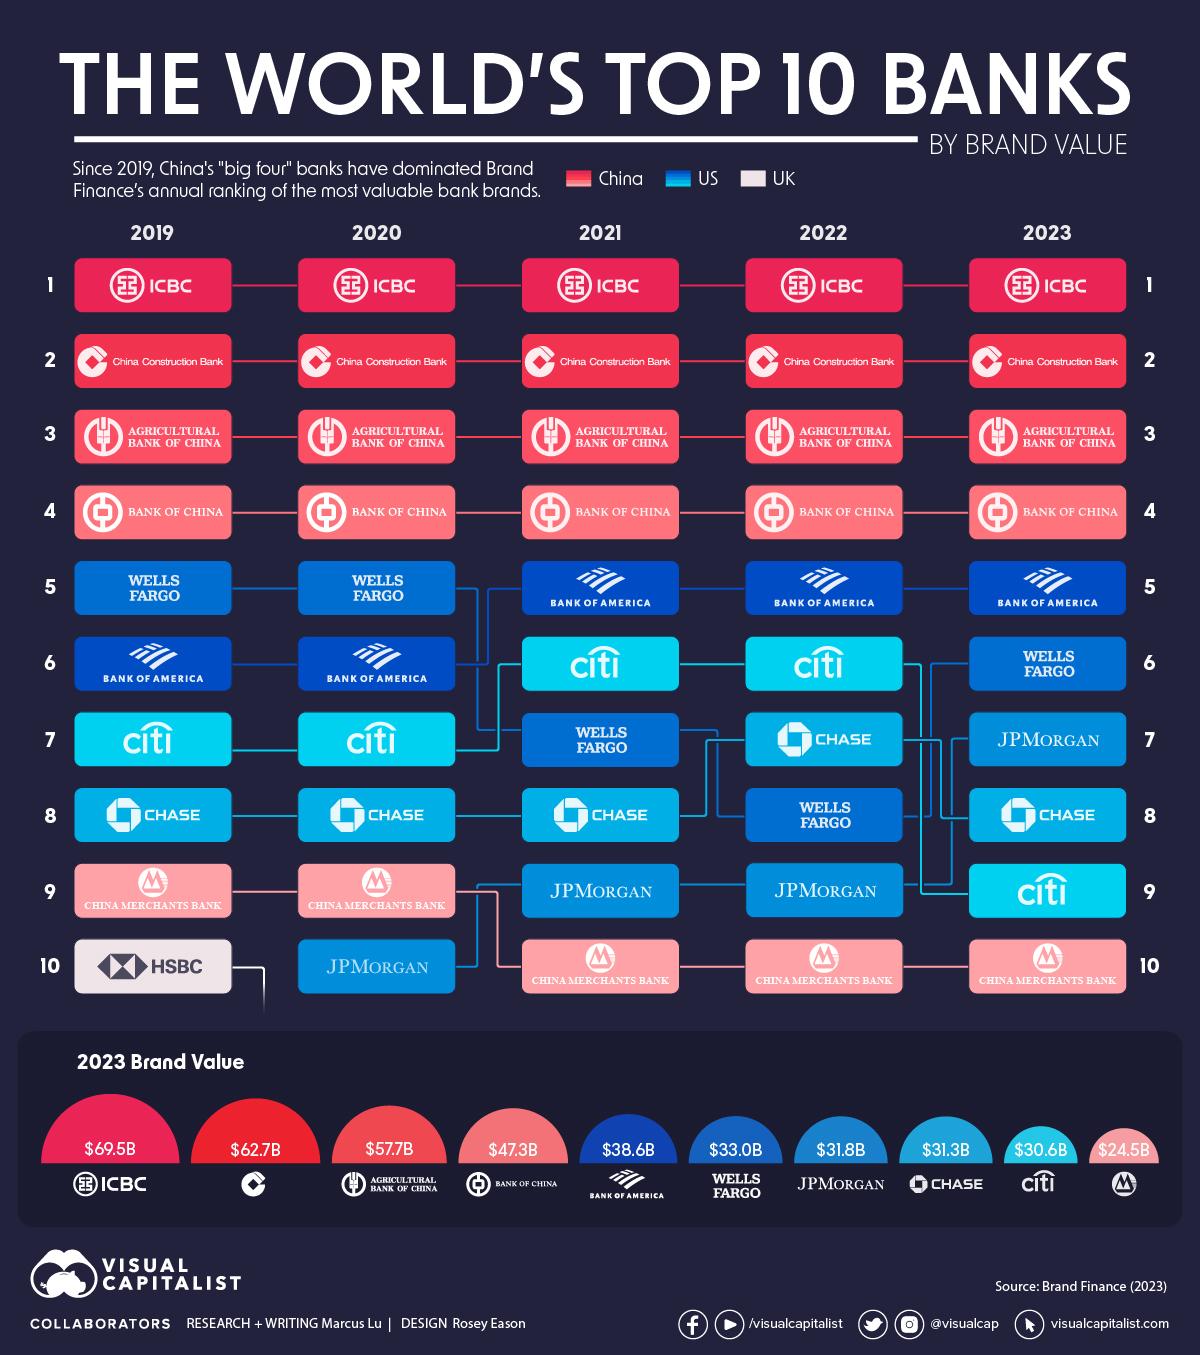
Since 2019, Chinese banks have held the top four spots on Brand Finance’s Banking 500—an annual ranking of the most valuable bank brands.
Brand value in this context is a measure of the “value of the trade mark and associated marketing IP within the branded business”. In other words, it measures the value of intangible marketing assets, and not the overall worth of the business itself.
In this infographic, we’ve visualized the Banking 500’s top 10 brands since 2019 to show you how the ranking has evolved (or stayed the same).
Top Bank Brands of 2023
The 10 most valuable bank brands of 2023 are evenly split between China and the United States. In terms of combined brand value, China leads with $262 billion to America’s $165 billion.
| Rank | Bank | Brand Value (USD billions) |
|---|---|---|
| 1 | 🇨🇳 ICBC | $69.5 |
| 2 | 🇨🇳 China Construction Bank | $62.7 |
| 3 | 🇨🇳 Agricultural Bank of China | $57.7 |
| 4 | 🇨🇳 Bank of China | $47.3 |
| 5 | 🇺🇸 Bank of America | $38.6 |
| 6 | 🇺🇸 Wells Fargo | $33.0 |
| 7 | 🇺🇸 JP Morgan | $31.8 |
| 8 | 🇺🇸 Chase | $31.3 |
| 9 | 🇺🇸 Citi | $30.6 |
| 10 | 🇨🇳 China Merchants Bank | $24.5 |
Chinese banks have a massive market to serve, which helps to lift the perceived value of their brands. For example, Industrial and Commercial Bank of China (ICBC) serves over 500 million individuals as well as several million business clients.
It’s worth noting that ICBC is the world’s largest bank in terms of assets under management ($5.5 trillion as of Dec 2021), and in terms of annual revenues ($143 billion as of Dec 2022). The bank was founded just 39 years ago in 1984.
After ICBC, the next three spots are occupied by the rest of China’s “big four” banks, all of which are state-owned.
The fifth to ninth spots on this ranking are occupied by an assortment of America’s largest banks. Despite a string of controversies in recent years, Wells Fargo rose from eighth in 2022 to sixth in 2023. This goes to show that large corporations can often recover from a scandal in a relatively short period of time (e.g. Volkswagen’s Dieselgate).
Coming in tenth is China Merchants Bank, which is China’s first “joint-stock commercial bank wholly owned by corporate legal entities”.
Top Asset Management Brands
Brand Finance’s 2023 ranking also includes a separate category for asset managers.
| Rank | Asset Manager | Brand Value (USD billions) |
|---|---|---|
| 1 | 🇨🇦 Brookfield | $9.0 |
| 2 | 🇺🇸 Fidelity | $8.4 |
| 3 | 🇺🇸 BlackRock | $6.6 |
| 4 | 🇺🇸 Blackstone | $4.9 |
| 5 | 🇨🇳 Cinda International Holdings Limited | $3.2 |
| 6 | 🇺🇸 Vanguard | $2.9 |
| 7 | 🇺🇸 Union Investment | $2.3 |
| 8 | 🇺🇸 Franklin Templeton Investments | $2.1 |
| 9 | 🇺🇸 Ameriprise Financial | $2.0 |
| 10 | 🇺🇸 Invesco | $1.5 |
Given America’s leadership in financial markets, it’s no surprise to see eight out of the 10 firms listed here as being based in the United States. The number one spot, however, is held by Canada’s Brookfield. The Canadian alternative asset manager is building a strong brand through its investments in renewable energy and other high-value infrastructure.


Markets
U.S. Debt Interest Payments Reach $1 Trillion
U.S. debt interest payments have surged past the $1 trillion dollar mark, amid high interest rates and an ever-expanding debt burden.


U.S. Debt Interest Payments Reach $1 Trillion
This was originally posted on our Voronoi app. Download the app for free on iOS or Android and discover incredible data-driven charts from a variety of trusted sources.
The cost of paying for America’s national debt crossed the $1 trillion dollar mark in 2023, driven by high interest rates and a record $34 trillion mountain of debt.
Over the last decade, U.S. debt interest payments have more than doubled amid vast government spending during the pandemic crisis. As debt payments continue to soar, the Congressional Budget Office (CBO) reported that debt servicing costs surpassed defense spending for the first time ever this year.
This graphic shows the sharp rise in U.S. debt payments, based on data from the Federal Reserve.
A $1 Trillion Interest Bill, and Growing
Below, we show how U.S. debt interest payments have risen at a faster pace than at another time in modern history:
| Date | Interest Payments | U.S. National Debt |
|---|---|---|
| 2023 | $1.0T | $34.0T |
| 2022 | $830B | $31.4T |
| 2021 | $612B | $29.6T |
| 2020 | $518B | $27.7T |
| 2019 | $564B | $23.2T |
| 2018 | $571B | $22.0T |
| 2017 | $493B | $20.5T |
| 2016 | $460B | $20.0T |
| 2015 | $435B | $18.9T |
| 2014 | $442B | $18.1T |
| 2013 | $425B | $17.2T |
| 2012 | $417B | $16.4T |
| 2011 | $433B | $15.2T |
| 2010 | $400B | $14.0T |
| 2009 | $354B | $12.3T |
| 2008 | $380B | $10.7T |
| 2007 | $414B | $9.2T |
| 2006 | $387B | $8.7T |
| 2005 | $355B | $8.2T |
| 2004 | $318B | $7.6T |
| 2003 | $294B | $7.0T |
| 2002 | $298B | $6.4T |
| 2001 | $318B | $5.9T |
| 2000 | $353B | $5.7T |
| 1999 | $353B | $5.8T |
| 1998 | $360B | $5.6T |
| 1997 | $368B | $5.5T |
| 1996 | $362B | $5.3T |
| 1995 | $357B | $5.0T |
| 1994 | $334B | $4.8T |
| 1993 | $311B | $4.5T |
| 1992 | $306B | $4.2T |
| 1991 | $308B | $3.8T |
| 1990 | $298B | $3.4T |
| 1989 | $275B | $3.0T |
| 1988 | $254B | $2.7T |
| 1987 | $240B | $2.4T |
| 1986 | $225B | $2.2T |
| 1985 | $219B | $1.9T |
| 1984 | $205B | $1.7T |
| 1983 | $176B | $1.4T |
| 1982 | $157B | $1.2T |
| 1981 | $142B | $1.0T |
| 1980 | $113B | $930.2B |
| 1979 | $96B | $845.1B |
| 1978 | $84B | $789.2B |
| 1977 | $69B | $718.9B |
| 1976 | $61B | $653.5B |
| 1975 | $55B | $576.6B |
| 1974 | $50B | $492.7B |
| 1973 | $45B | $469.1B |
| 1972 | $39B | $448.5B |
| 1971 | $36B | $424.1B |
| 1970 | $35B | $389.2B |
| 1969 | $30B | $368.2B |
| 1968 | $25B | $358.0B |
| 1967 | $23B | $344.7B |
| 1966 | $21B | $329.3B |
Interest payments represent seasonally adjusted annual rate at the end of Q4.
At current rates, the U.S. national debt is growing by a remarkable $1 trillion about every 100 days, equal to roughly $3.6 trillion per year.
As the national debt has ballooned, debt payments even exceeded Medicaid outlays in 2023—one of the government’s largest expenditures. On average, the U.S. spent more than $2 billion per day on interest costs last year. Going further, the U.S. government is projected to spend a historic $12.4 trillion on interest payments over the next decade, averaging about $37,100 per American.
Exacerbating matters is that the U.S. is running a steep deficit, which stood at $1.1 trillion for the first six months of fiscal 2024. This has accelerated due to the 43% increase in debt servicing costs along with a $31 billion dollar increase in defense spending from a year earlier. Additionally, a $30 billion increase in funding for the Federal Deposit Insurance Corporation in light of the regional banking crisis last year was a major contributor to the deficit increase.
Overall, the CBO forecasts that roughly 75% of the federal deficit’s increase will be due to interest costs by 2034.

-

 Green1 week ago
Ranked: The Countries With the Most Air Pollution in 2023
-

 Automotive2 weeks ago
Almost Every EV Stock is Down After Q1 2024
-

 AI2 weeks ago
The Stock Performance of U.S. Chipmakers So Far in 2024
-

 Markets2 weeks ago
Charted: Big Four Market Share by S&P 500 Audits
-

 Real Estate2 weeks ago
Ranked: The Most Valuable Housing Markets in America
-

 Money2 weeks ago
Which States Have the Highest Minimum Wage in America?
-

 AI2 weeks ago
Ranked: Semiconductor Companies by Industry Revenue Share
-

 Travel2 weeks ago
Ranked: The World’s Top Flight Routes, by Revenue