Markets
Visualizing the Most Populous Countries in the World
Visualizing the Most Populous Countries in the World
India’s population is projected to surpass China’s as soon as 2022.
While this is consequential on a global economic level, it also leaves other population trends overlooked. For instance, Nigeria is projected to have more people than the U.S., the world’s third-largest country by population, by the year 2050.
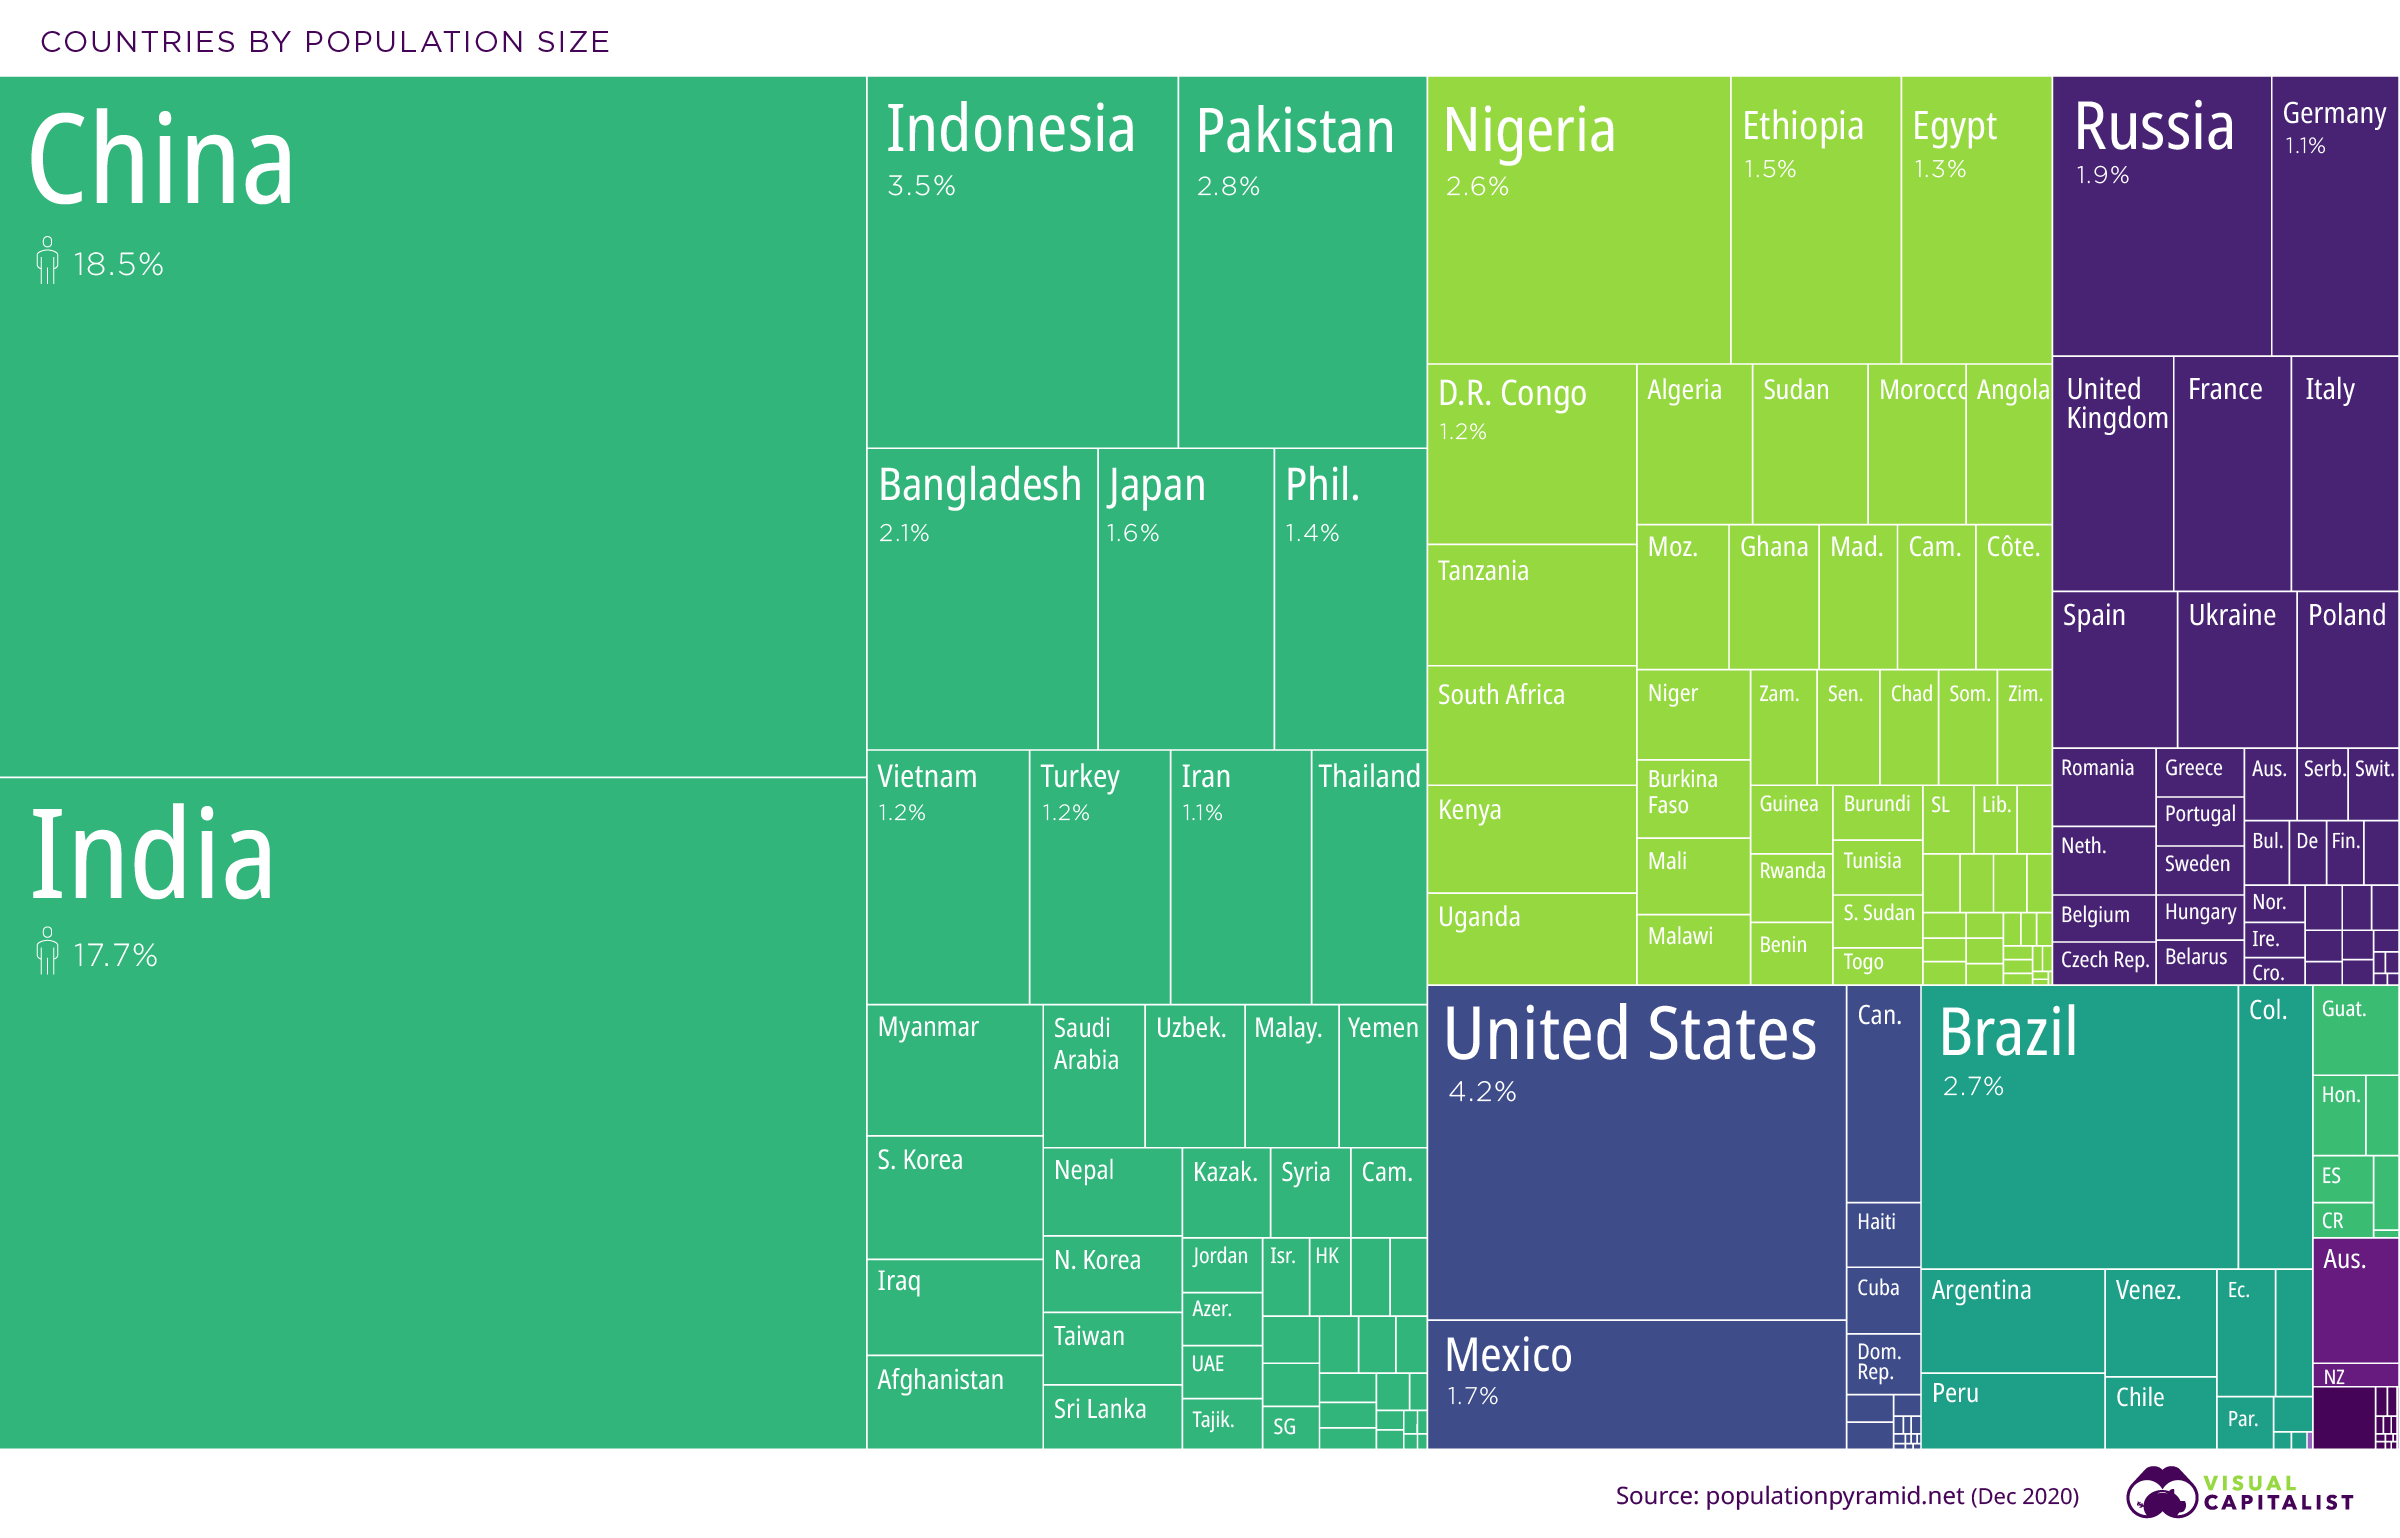
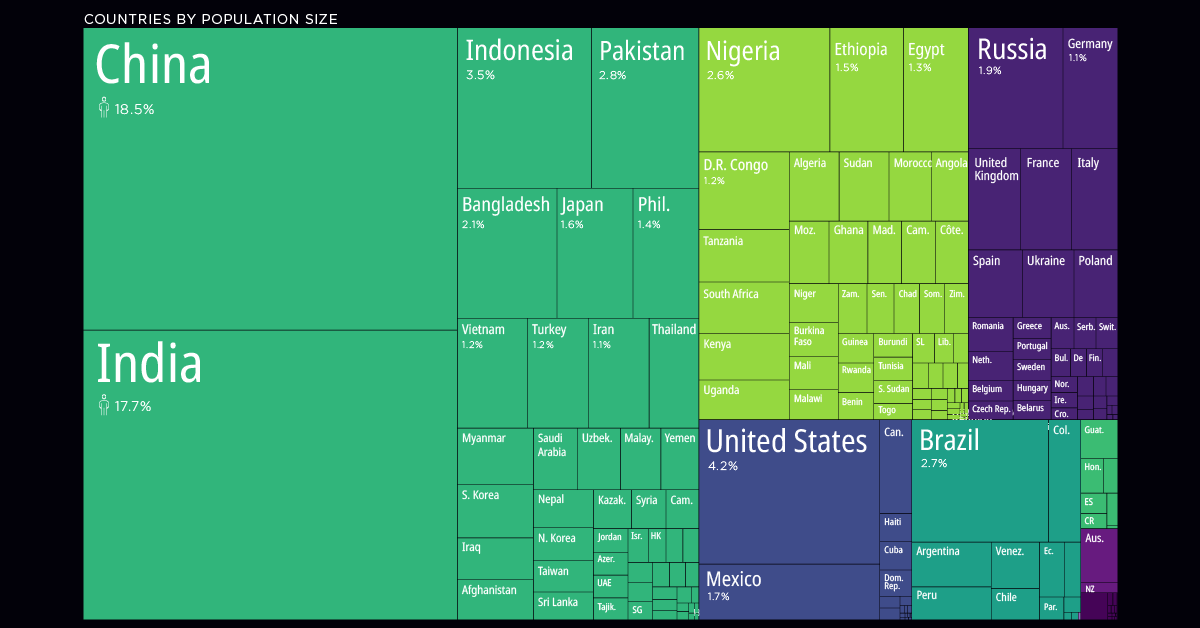
This treemap visualization, adapted from PopulationPyramid.net, is an overview of the global population in 2020, showing us the world’s most populous countries.
The 50 Most Populous Countries
China, with a population of 1.44 billion, is the most populous country worldwide.
In 2019, over 60% of its population resided in urban centers, a trend that has seen the portion of city dwellers double over the last 25 years. For context, 83% of the U.S. population lives in cities, while just 35% of India’s population dwells in urban areas.
Together, China and India’s populations make up over 36% of the global total.
| Country | Population (2020) | |
|---|---|---|
| 1 | 🇨🇳 China | 1,439,323,774 |
| 2 | 🇮🇳 India | 1,380,004,385 |
| 3 | 🇺🇸 U.S. | 331,002,647 |
| 4 | 🇮🇩 Indonesia | 273,523,621 |
| 5 | 🇵🇰 Pakistan | 220,892,331 |
| 6 | 🇧🇷 Brazil | 212,559,409 |
| 7 | 🇳🇬 Nigeria | 206,139,587 |
| 8 | 🇧🇩 Bangladesh | 164,689,383 |
| 9 | 🇷🇺 Russian Federation | 145,934,460 |
| 10 | 🇲🇽 Mexico | 128,932,753 |
| 11 | 🇯🇵 Japan | 126,476,458 |
| 12 | 🇪🇹 Ethiopia | 114,963,583 |
| 13 | 🇵🇭 Philippines | 109,581,085 |
| 14 | 🇪🇬 Egypt | 102,334,403 |
| 15 | 🇻🇳 Vietnam | 97,338,583 |
| 16 | 🇨🇩 D.R. Congo | 89,561,404 |
| 17 | 🇹🇷 Turkey | 84,339,067 |
| 18 | 🇮🇷 Iran | 83,992,953 |
| 19 | 🇩🇪 Germany | 83,783,945 |
| 20 | 🇹🇭 Thailand | 69,799,978 |
| 21 | 🇬🇧 United Kingdom | 67,886,004 |
| 22 | 🇫🇷 France | 65,273,512 |
| 23 | 🇮🇹 Italy | 60,461,828 |
| 24 | 🇹🇿 Tanzania | 59,734,213 |
| 25 | 🇿🇦 South Africa | 59,308,690 |
| 26 | 🇲🇲 Myanmar | 54,409,794 |
| 27 | 🇰🇪Kenya | 53,771,300 |
| 28 | 🇰🇷 Republic of Korea | 51,269,183 |
| 29 | 🇨🇴 Colombia | 50,882,884 |
| 30 | 🇪🇸 Spain | 46,754,783 |
| 31 | 🇺🇬 Uganda | 45,741,000 |
| 32 | 🇦🇷 Argentina | 45,195,777 |
| 33 | 🇩🇿 Algeria | 43,851,043 |
| 34 | 🇸🇩 Sudan | 43,849,269 |
| 35 | 🇺🇦 Ukraine | 43,733,759 |
| 36 | 🇮🇶 Iraq | 40,222,503 |
| 37 | 🇦🇫 Afghanistan | 38,928,341 |
| 38 | 🇵🇱 Poland | 37,846,605 |
| 39 | 🇨🇦 Canada | 37,742,157 |
| 40 | 🇲🇦 Morocco | 36,910,558 |
| 41 | 🇸🇦 Saudi Arabia | 34,813,867 |
| 42 | 🇺🇿 Uzbekistan | 33,469,199 |
| 43 | 🇵🇪 Peru | 32,971,846 |
| 44 | 🇦🇴 Angola | 32,866,268 |
| 45 | 🇲🇾 Malaysia | 32,365,998 |
| 46 | 🇲🇿 Mozambique | 31,255,435 |
| 47 | 🇬🇭 Ghana | 31,072,945 |
| 48 | 🇾🇪 Yemen | 29,825,968 |
| 49 | 🇳🇵 Nepal | 29,136,808 |
| 50 | 🇻🇪 Venezuela | 28,435,943 |
Extending over 17,000 islands, Indonesia comes fourth among the world’s most populous countries, standing at 273.5 million people.
Pakistan comes in fifth, with 220.8 million. Karachi, located on the southeastern coast of Pakistan, is home to over 16 million people alone. It is Pakistan’s most populous city, and the seventh-largest city in the world.
Nigeria also makes it onto the list. In just three decades, the country’s population is projected to climb from 206 million to 400 million—growing at a percentage clip that is more than double that of India.
The 50 Least Populous Countries
Combined, the 50 least-populous countries make up under 0.4% of the total world population. By contrast, the top 50 account for 87% of the total.
Unsurprisingly, the world’s low population nations are situated on small islands, often tropical and reliant on tourism.
| Country | Population* | |
|---|---|---|
| 1 | 🇻🇦 Vatican City | 799 |
| 2 | 🇹🇰 Tokelau | 1,340 |
| 3 | 🇳🇺 Niue | 1,615 |
| 4 | 🇫🇰 Falkland Islands | 3,377 |
| 5 | 🇲🇸 Montserrat | 4,989 |
| 6 | 🇵🇲 Saint Pierre and Miquelon | 5,822 |
| 7 | 🇸🇭 Saint Helena | 6,059 |
| 8 | 🇳🇷 Nauru | 10,756 |
| 9 | 🇼🇫 Wallis and Futuna | 11,432 |
| 10 | 🇹🇻 Tuvalu | 11,646 |
| 11 | 🇦🇮 Anguilla | 14,869 |
| 12 | 🇨🇰 Cook Islands | 17,548 |
| 13 | 🇵🇼 Palau | 18,008 |
| 14 | 🇧🇶 Caribbean Netherlands | 25,979 |
| 15 | 🇻🇬 British Virgin Islands | 30,030 |
| 16 | 🇬🇮 Gibraltar | 33,701 |
| 17 | 🇸🇲 San Marino | 33,860 |
| 18 | 🇱🇮 Liechtenstein | 38,019 |
| 19 | 🇹🇨 Turks and Caicos Islands | 38,191 |
| 20 | 🇲🇨 Monaco | 38,964 |
| 21 | 🇸🇽 Sint Maarten | 42,388 |
| 22 | 🇫🇴 Faroe Islands | 48,678 |
| 23 | 🇰🇳 Saint Kitts and Nevis | 52,823 |
| 24 | 🇦🇸 American Samoa | 55,312 |
| 25 | 🇲🇵 Northern Mariana Islands | 56,188 |
| 26 | 🇬🇱 Greenland | 56,672 |
| 27 | 🇲🇭 Marshall Islands | 58,791 |
| 28 | 🇧🇲 Bermuda | 62,506 |
| 29 | 🇰🇾 Cayman Islands | 64,948 |
| 30 | 🇩🇲 Dominica | 71,808 |
| 31 | 🇦🇩 Andorra | 77,142 |
| 32 | 🇮🇲 Isle of Man | 84,584 |
| 33 | 🇦🇬 Antigua and Barbuda | 97,118 |
| 34 | 🇸🇨 Seychelles | 97,739 |
| 35 | 🇻🇮 United States Virgin Islands | 104,578 |
| 36 | 🇦🇼 Aruba | 106,314 |
| 37 | 🇻🇨 Saint Vincent and the Grenadines | 110,589 |
| 38 | 🇹🇴 Tonga | 110,940 |
| 39 | 🇬🇩 Grenada | 112,003 |
| 40 | 🇫🇲 Micronesia (Fed. States of) | 113,815 |
| 41 | 🇰🇮 Kiribati | 117,606 |
| 42 | 🇨🇼 Curaçao | 163,424 |
| 43 | 🇬🇺 Guam | 167,294 |
| 44 | Channel Islands | 172,259 |
| 45 | 🇱🇨 Saint Lucia | 182,790 |
| 46 | 🇼🇸 Samoa | 197,097 |
| 47 | 🇸🇹 São Tomé and Príncipe | 215,056 |
| 48 | Mayotte | 266,150 |
| 49 | 🇵🇫 French Polynesia | 279,287 |
| 50 | 🇬🇫 French Guiana | 282,731 |
*Source: United Nations, as of July 1, 2019. Includes territories.
With a total of 799 residents in 2019, Vatican City is the least populated country. Following close behind is the territory of Tokelau, a cluster of islands situated between New Zealand and Hawaii.
The Caribbean island nation of Antigua and Barbuda is also among the smallest populations in the world, with just 97,118 inhabitants. While it may be small in terms of total inhabitants, its population density is another story—with over 222 people per square kilometer. That is roughly 50% higher than China, but about half the population density of India.
Meanwhile, the 33 pacific islands of Kiribati also make the top 50 list of the least populous countries worldwide. With a population of 117,606, Kiribati was a testing site for atomic bombs by the British and Americans during the 1960s. The island reached independence in 1979, after being under crown colonial rule since 1916.
Regional Median Ages
How about the median ages across these populations?
By far, the African region has the lowest median age at 19.8 years old, partially driven by a high birth rate of 4.7 children per woman. In contrast, the global average falls around 2.5 children.
By 2050, Africa’s population will effectively double from 1.3 billion to 2.5 billion.
| Region | Annual Rate of Natural Population Increase | Median Age (2020) |
|---|---|---|
| Africa | 2.5% | 19.8 years |
| Asia | 0.9% | 32.1 years |
| Central America | 1.2% | 28.3 years |
| Europe | -0.1% | 42.7 years |
| Latin America & Caribbean | 0.9% | 30.9 years |
| Northern America | 0.3% | 38.6 years |
| Oceania | 0.9% | 33.5 years |
| South America | 0.9% | 32.0 years |
| World | 1.0% | 30.9 years |
Source: Our World in Data
On the other hand, Europe is the oldest, at 42.7 years for this demographic metric.
With a median age of 47.9, Italy has the second-oldest population in the world, topped only by Japan. Meanwhile, Germany (46.6), Portugal (46.2), and Spain (45.5) fall next in line. If current trends continue, by 2050, half of Europe’s population will be non-working and over the age of 65.
That said, it should be noted that this trend is not exclusive to Europe. In 30 years, 1.5 billion people globally will be over the age of 65, amounting to 16% of the global population.


Markets
The European Stock Market: Attractive Valuations Offer Opportunities
On average, the European stock market has valuations that are nearly 50% lower than U.S. valuations. But how can you access the market?


European Stock Market: Attractive Valuations Offer Opportunities
Europe is known for some established brands, from L’Oréal to Louis Vuitton. However, the European stock market offers additional opportunities that may be lesser known.
The above infographic, sponsored by STOXX, outlines why investors may want to consider European stocks.
Attractive Valuations
Compared to most North American and Asian markets, European stocks offer lower or comparable valuations.
| Index | Price-to-Earnings Ratio | Price-to-Book Ratio |
|---|---|---|
| EURO STOXX 50 | 14.9 | 2.2 |
| STOXX Europe 600 | 14.4 | 2 |
| U.S. | 25.9 | 4.7 |
| Canada | 16.1 | 1.8 |
| Japan | 15.4 | 1.6 |
| Asia Pacific ex. China | 17.1 | 1.8 |
Data as of February 29, 2024. See graphic for full index names. Ratios based on trailing 12 month financials. The price to earnings ratio excludes companies with negative earnings.
On average, European valuations are nearly 50% lower than U.S. valuations, potentially offering an affordable entry point for investors.
Research also shows that lower price ratios have historically led to higher long-term returns.
Market Movements Not Closely Connected
Over the last decade, the European stock market had low-to-moderate correlation with North American and Asian equities.
The below chart shows correlations from February 2014 to February 2024. A value closer to zero indicates low correlation, while a value of one would indicate that two regions are moving in perfect unison.
| EURO STOXX 50 | STOXX EUROPE 600 | U.S. | Canada | Japan | Asia Pacific ex. China |
|
|---|---|---|---|---|---|---|
| EURO STOXX 50 | 1.00 | 0.97 | 0.55 | 0.67 | 0.24 | 0.43 |
| STOXX EUROPE 600 | 1.00 | 0.56 | 0.71 | 0.28 | 0.48 | |
| U.S. | 1.00 | 0.73 | 0.12 | 0.25 | ||
| Canada | 1.00 | 0.22 | 0.40 | |||
| Japan | 1.00 | 0.88 | ||||
| Asia Pacific ex. China | 1.00 |
Data is based on daily USD returns.
European equities had relatively independent market movements from North American and Asian markets. One contributing factor could be the differing sector weights in each market. For instance, technology makes up a quarter of the U.S. market, but health care and industrials dominate the broader European market.
Ultimately, European equities can enhance portfolio diversification and have the potential to mitigate risk for investors.
Tracking the Market
For investors interested in European equities, STOXX offers a variety of flagship indices:
| Index | Description | Market Cap |
|---|---|---|
| STOXX Europe 600 | Pan-regional, broad market | €10.5T |
| STOXX Developed Europe | Pan-regional, broad-market | €9.9T |
| STOXX Europe 600 ESG-X | Pan-regional, broad market, sustainability focus | €9.7T |
| STOXX Europe 50 | Pan-regional, blue-chip | €5.1T |
| EURO STOXX 50 | Eurozone, blue-chip | €3.5T |
Data is as of February 29, 2024. Market cap is free float, which represents the shares that are readily available for public trading on stock exchanges.
The EURO STOXX 50 tracks the Eurozone’s biggest and most traded companies. It also underlies one of the world’s largest ranges of ETFs and mutual funds. As of November 2023, there were €27.3 billion in ETFs and €23.5B in mutual fund assets under management tracking the index.
“For the past 25 years, the EURO STOXX 50 has served as an accurate, reliable and tradable representation of the Eurozone equity market.”
— Axel Lomholt, General Manager at STOXX
Partnering with STOXX to Track the European Stock Market
Are you interested in European equities? STOXX can be a valuable partner:
- Comprehensive, liquid and investable ecosystem
- European heritage, global reach
- Highly sophisticated customization capabilities
- Open architecture approach to using data
- Close partnerships with clients
- Part of ISS STOXX and Deutsche Börse Group
With a full suite of indices, STOXX can help you benchmark against the European stock market.
Learn how STOXX’s European indices offer liquid and effective market access.

-

 Economy1 day ago
Economic Growth Forecasts for G7 and BRICS Countries in 2024
The IMF has released its economic growth forecasts for 2024. How do the G7 and BRICS countries compare?
-

 Markets1 week ago
U.S. Debt Interest Payments Reach $1 Trillion
U.S. debt interest payments have surged past the $1 trillion dollar mark, amid high interest rates and an ever-expanding debt burden.
-

 United States1 week ago
Ranked: The Largest U.S. Corporations by Number of Employees
We visualized the top U.S. companies by employees, revealing the massive scale of retailers like Walmart, Target, and Home Depot.
-

 Markets2 weeks ago
The Top 10 States by Real GDP Growth in 2023
This graphic shows the states with the highest real GDP growth rate in 2023, largely propelled by the oil and gas boom.
-

 Markets2 weeks ago
Ranked: The World’s Top Flight Routes, by Revenue
In this graphic, we show the highest earning flight routes globally as air travel continued to rebound in 2023.
-

 Markets2 weeks ago
Ranked: The Most Valuable Housing Markets in America
The U.S. residential real estate market is worth a staggering $47.5 trillion. Here are the most valuable housing markets in the country.


-

 Mining1 week ago
Gold vs. S&P 500: Which Has Grown More Over Five Years?
-
Markets2 weeks ago
Ranked: The Most Valuable Housing Markets in America
-

 Money2 weeks ago
Which States Have the Highest Minimum Wage in America?
-

 AI2 weeks ago
Ranked: Semiconductor Companies by Industry Revenue Share
-
Markets2 weeks ago
Ranked: The World’s Top Flight Routes, by Revenue
-

 Demographics2 weeks ago
Population Projections: The World’s 6 Largest Countries in 2075
-
Markets2 weeks ago
The Top 10 States by Real GDP Growth in 2023
-

 Demographics2 weeks ago
The Smallest Gender Wage Gaps in OECD Countries