Markets
Commercial Mortgage Delinquencies Near Record Levels
 Can I share this graphic?
 When do I need a license?
 Interested in this piece?
Commercial Mortgage Delinquencies Near Record Levels
Delinquency rates across commercial properties have shot up faster than at any other time.
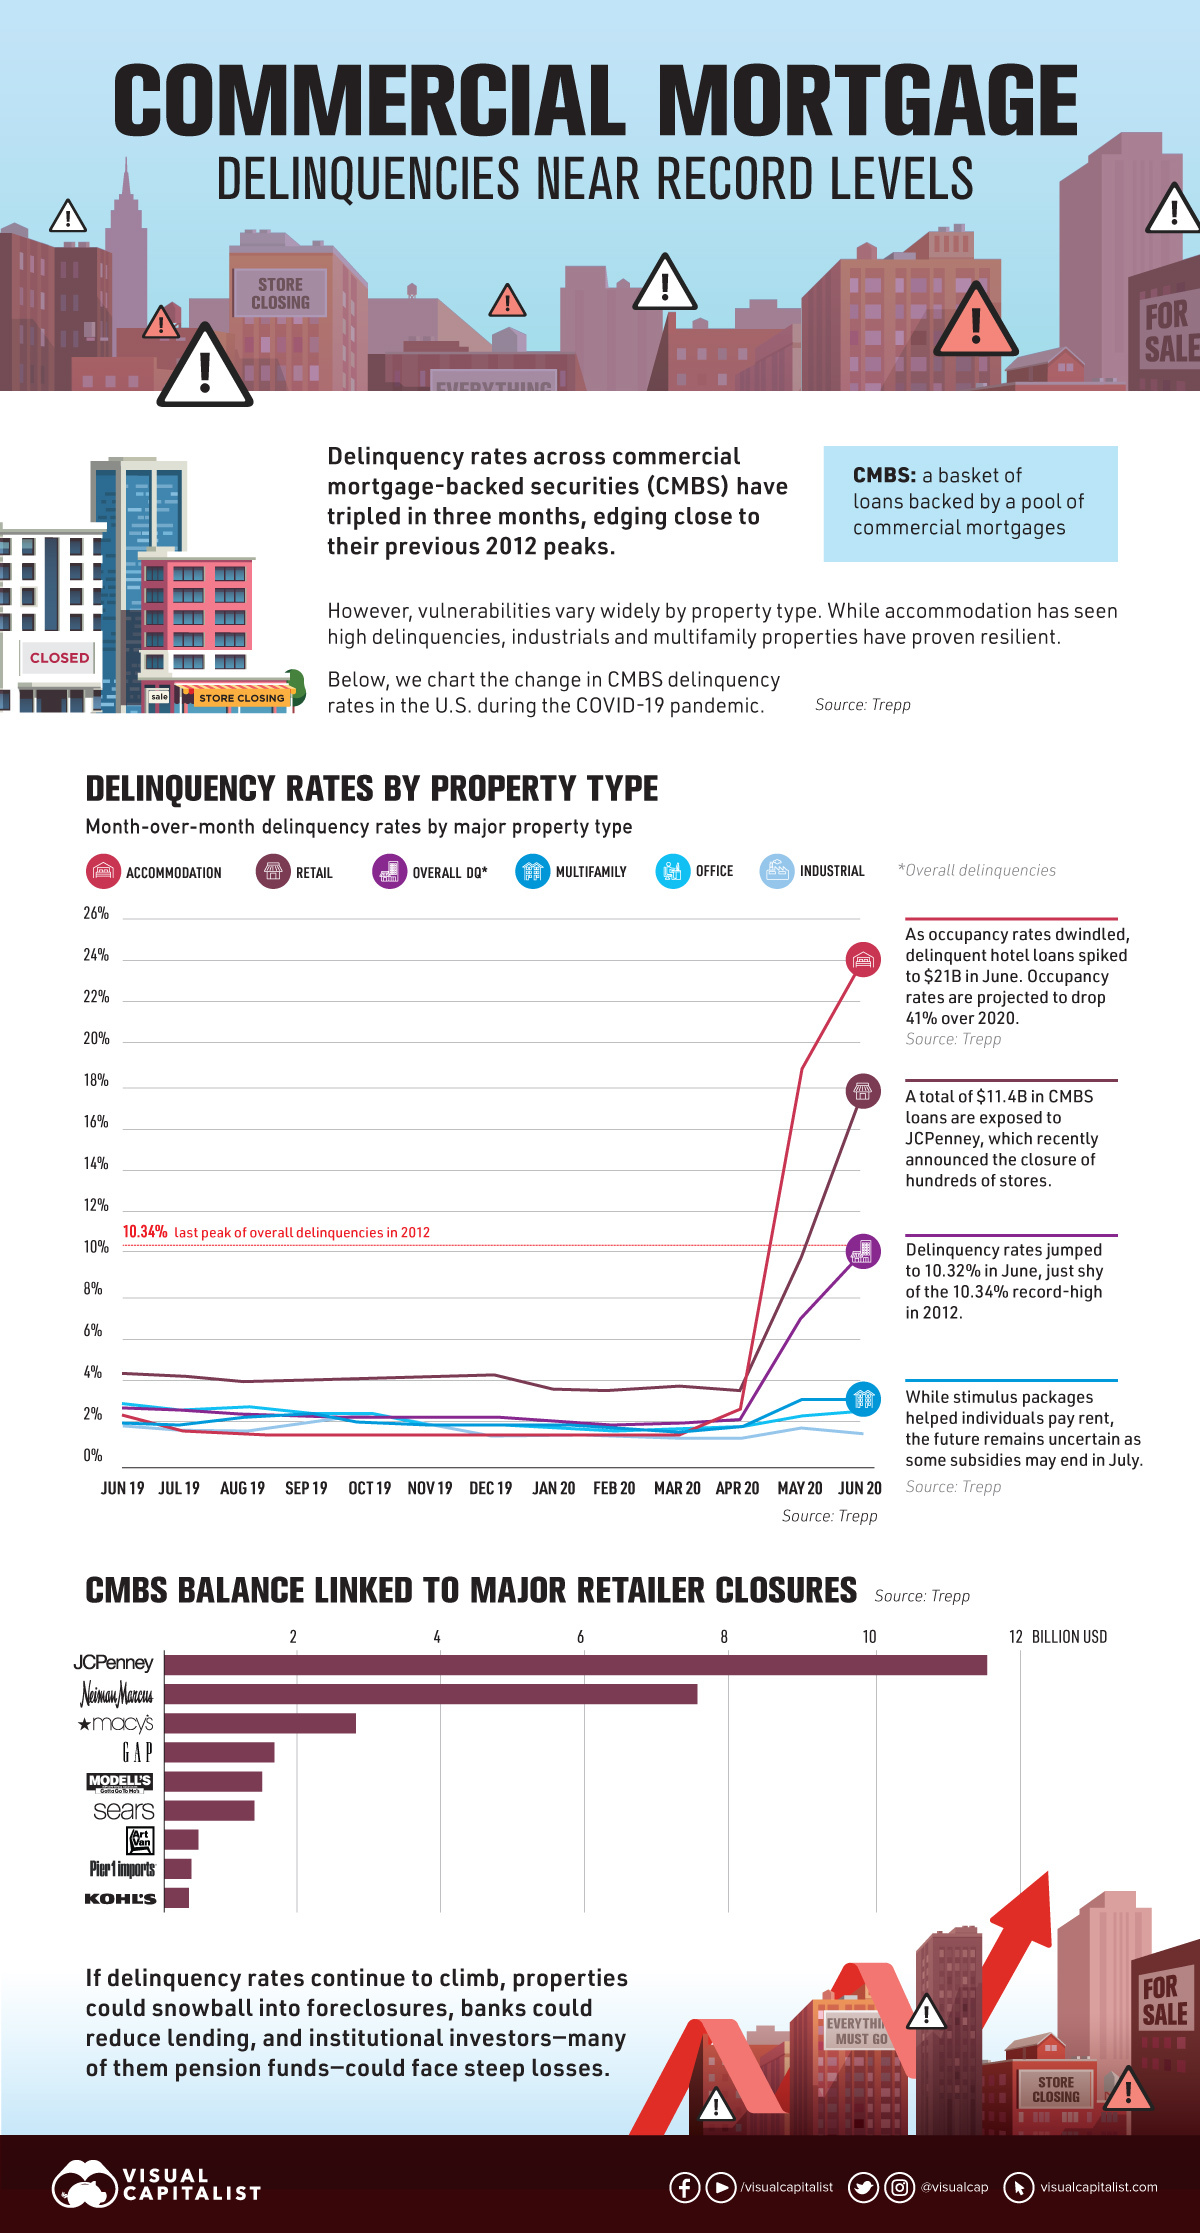
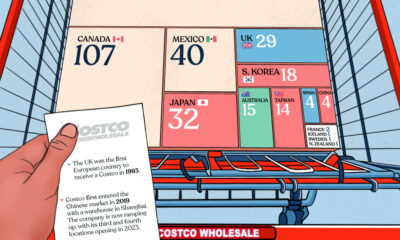
As thousands of restaurants, hotels, and local businesses in the U.S. struggle to stay open, delinquency rates across commercial mortgage-backed securities (CMBS)—fixed income investments backed by a pool of commercial mortgages— have tripled in three months to 10.32%.
In just a few months, delinquency rates have already effectively reached their 2012 peaks. To put this in perspective, consider that it took well over two years for mortgage delinquency rates to reach the same historic levels in the aftermath of the housing crisis of 2009.
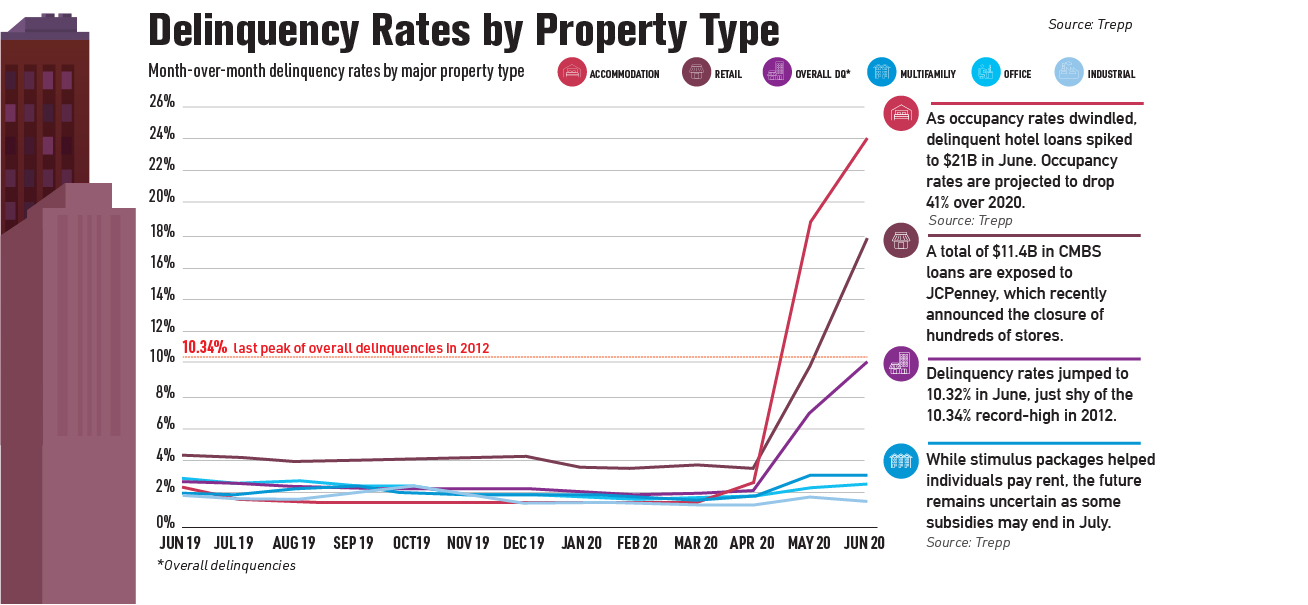
The above chart draws data from Trepp and illustrates the recent shocks to the CMBS market, broken down by property type.
Storm Rumblings
While there is optimism in some areas of the market, accommodation mortgages have witnessed delinquency rates soar over 24%.
Amid strict containment efforts in April, average revenues per room plummeted all the way to $16 per night—an 84% drop.
| Property Type | January 2020 | June 2020 |
|---|---|---|
| Accommodation | 1.5% | 24.3% |
| Retail | 3.8% | 18.1% |
| Multifamily | 2.0% | 3.3% |
| Office | 1.9% | 2.7% |
| Industrial | 1.6% | 1.6% |
| Overall | 2.1% | 10.3% |
Similarly, retail properties have been rattled. Almost one-fifth are in delinquencies. From January-June 2020, at least 15 major retailers have filed for bankruptcy and over $20 billion in CMBS loans have exposure to flailing chains such as JCPenney, Neiman Marcus, and Macy’s.
On the other hand, industrial property types have remained stable, hovering close to their January levels. This is likely attributable in part to the fact that the rise in e-commerce sales have helped support warehouse operations.
For multifamily and office buildings, Washington’s stimulus packages have helped renters to continue making payments thus far. Still, as the government considers ending stimulus packages in the near future, a lack of relief funding could spell trouble.
Weighing the Impact on U.S. Cities
How do delinquency rates vary across the top metropolitan areas in America?
Below, we can see that the delinquent balance and delinquency rates vary widely by city. Note that this data is for private-labeled CMBS, which are issued by investment banks and private entities rather than government agencies.
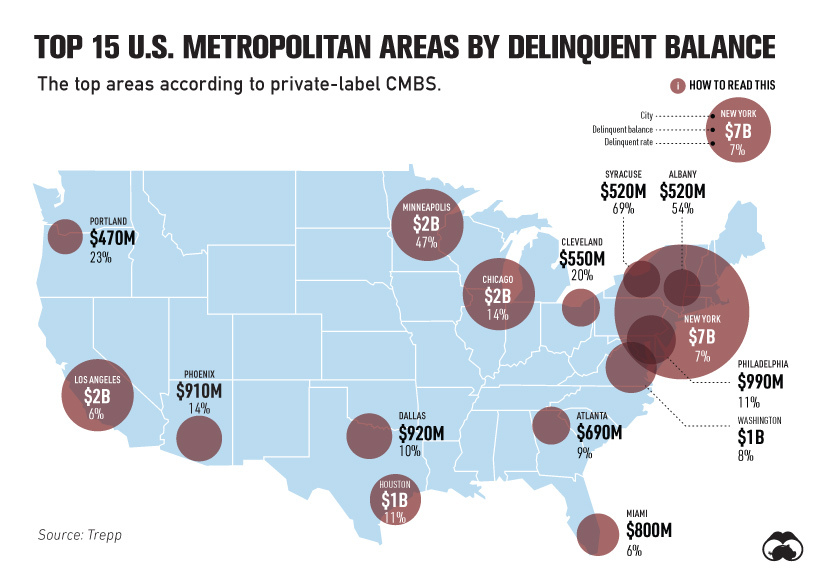
Despite the New York city metropolitan area having a delinquent balance of $7 billion, its delinquency rates fall on the lower end of the spectrum, at 7%. New York alone accounts for 18% of the total balance of private-label CMBS.
By comparison, the Syracuse metropolitan area has an eye-opening delinquency rate of 69%. Syracuse is home to the shopping complex, Destiny USA, which is facing tenant uncertainties due to COVID-19. The six-story mall attracts 26 million visitors annually.
Like the overall market, delinquencies are being driven by accommodation and retail properties across many of these U.S. metropolitan areas.
What Comes Next
What happens when delinquency rates get too high?
Often, when borrowers do not make payment after a reasonable amount of time, they enter into default. While time ranges can vary, defaults typically take place after at least 60 days of nonpayment. Between May and June, defaults in the CMBS market surged 792% to $5.5 billion.
As effects reverberate, properties could eventually fall into foreclosure. At the same time, institutional investors who own these types of securities, which include pensions, could begin seeing steep losses.
That said, the Federal Reserve has set up mechanisms to purchase CMBS loans with the highest credit quality. This is designed to inject liquidity into the mortgage market, while also financing small and mid-sized properties that house small businesses. In turn, this can enable the employment of millions of Americans.
Of course, it remains to be seen whether the mortgage market will face a sustained downturn akin to the financial crisis, or if the temporary decline will soon subside.


Markets
U.S. Debt Interest Payments Reach $1 Trillion
U.S. debt interest payments have surged past the $1 trillion dollar mark, amid high interest rates and an ever-expanding debt burden.


U.S. Debt Interest Payments Reach $1 Trillion
This was originally posted on our Voronoi app. Download the app for free on iOS or Android and discover incredible data-driven charts from a variety of trusted sources.
The cost of paying for America’s national debt crossed the $1 trillion dollar mark in 2023, driven by high interest rates and a record $34 trillion mountain of debt.
Over the last decade, U.S. debt interest payments have more than doubled amid vast government spending during the pandemic crisis. As debt payments continue to soar, the Congressional Budget Office (CBO) reported that debt servicing costs surpassed defense spending for the first time ever this year.
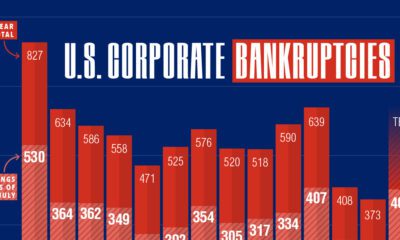
This graphic shows the sharp rise in U.S. debt payments, based on data from the Federal Reserve.
A $1 Trillion Interest Bill, and Growing
Below, we show how U.S. debt interest payments have risen at a faster pace than at another time in modern history:
| Date | Interest Payments | U.S. National Debt |
|---|---|---|
| 2023 | $1.0T | $34.0T |
| 2022 | $830B | $31.4T |
| 2021 | $612B | $29.6T |
| 2020 | $518B | $27.7T |
| 2019 | $564B | $23.2T |
| 2018 | $571B | $22.0T |
| 2017 | $493B | $20.5T |
| 2016 | $460B | $20.0T |
| 2015 | $435B | $18.9T |
| 2014 | $442B | $18.1T |
| 2013 | $425B | $17.2T |
| 2012 | $417B | $16.4T |
| 2011 | $433B | $15.2T |
| 2010 | $400B | $14.0T |
| 2009 | $354B | $12.3T |
| 2008 | $380B | $10.7T |
| 2007 | $414B | $9.2T |
| 2006 | $387B | $8.7T |
| 2005 | $355B | $8.2T |
| 2004 | $318B | $7.6T |
| 2003 | $294B | $7.0T |
| 2002 | $298B | $6.4T |
| 2001 | $318B | $5.9T |
| 2000 | $353B | $5.7T |
| 1999 | $353B | $5.8T |
| 1998 | $360B | $5.6T |
| 1997 | $368B | $5.5T |
| 1996 | $362B | $5.3T |
| 1995 | $357B | $5.0T |
| 1994 | $334B | $4.8T |
| 1993 | $311B | $4.5T |
| 1992 | $306B | $4.2T |
| 1991 | $308B | $3.8T |
| 1990 | $298B | $3.4T |
| 1989 | $275B | $3.0T |
| 1988 | $254B | $2.7T |
| 1987 | $240B | $2.4T |
| 1986 | $225B | $2.2T |
| 1985 | $219B | $1.9T |
| 1984 | $205B | $1.7T |
| 1983 | $176B | $1.4T |
| 1982 | $157B | $1.2T |
| 1981 | $142B | $1.0T |
| 1980 | $113B | $930.2B |
| 1979 | $96B | $845.1B |
| 1978 | $84B | $789.2B |
| 1977 | $69B | $718.9B |
| 1976 | $61B | $653.5B |
| 1975 | $55B | $576.6B |
| 1974 | $50B | $492.7B |
| 1973 | $45B | $469.1B |
| 1972 | $39B | $448.5B |
| 1971 | $36B | $424.1B |
| 1970 | $35B | $389.2B |
| 1969 | $30B | $368.2B |
| 1968 | $25B | $358.0B |
| 1967 | $23B | $344.7B |
| 1966 | $21B | $329.3B |
Interest payments represent seasonally adjusted annual rate at the end of Q4.
At current rates, the U.S. national debt is growing by a remarkable $1 trillion about every 100 days, equal to roughly $3.6 trillion per year.
As the national debt has ballooned, debt payments even exceeded Medicaid outlays in 2023—one of the government’s largest expenditures. On average, the U.S. spent more than $2 billion per day on interest costs last year. Going further, the U.S. government is projected to spend a historic $12.4 trillion on interest payments over the next decade, averaging about $37,100 per American.
Exacerbating matters is that the U.S. is running a steep deficit, which stood at $1.1 trillion for the first six months of fiscal 2024. This has accelerated due to the 43% increase in debt servicing costs along with a $31 billion dollar increase in defense spending from a year earlier. Additionally, a $30 billion increase in funding for the Federal Deposit Insurance Corporation in light of the regional banking crisis last year was a major contributor to the deficit increase.
Overall, the CBO forecasts that roughly 75% of the federal deficit’s increase will be due to interest costs by 2034.

-

 Real Estate2 weeks ago
Visualizing America’s Shortage of Affordable Homes
-

 Technology1 week ago
Ranked: Semiconductor Companies by Industry Revenue Share
-

 Money1 week ago
Which States Have the Highest Minimum Wage in America?
-

 Real Estate1 week ago
Ranked: The Most Valuable Housing Markets in America
-

 Business2 weeks ago
Charted: Big Four Market Share by S&P 500 Audits
-

 AI2 weeks ago
The Stock Performance of U.S. Chipmakers So Far in 2024
-

 Misc2 weeks ago
Almost Every EV Stock is Down After Q1 2024
-

 Money2 weeks ago
Where Does One U.S. Tax Dollar Go?