Technology
Visualizing How Much Countries Spend on R&D
Visualizing How Much Countries Spend on R&D
Innovation can be a major competitive advantage for any developed economy.
However, achieving a sustainable rate of innovation isn’t necessarily a straightforward exercise. The reality is that innovation is a complex and difficult outcome to measure, and there are many different variables that factor into it at a national level.
Research and development (R&D) expenditure is certainly one of these factors – and while it doesn’t always directly correlate with innovation outcomes, it does represent time, capital, and effort being put into researching and designing the products of the future.
Measuring R&D Spend
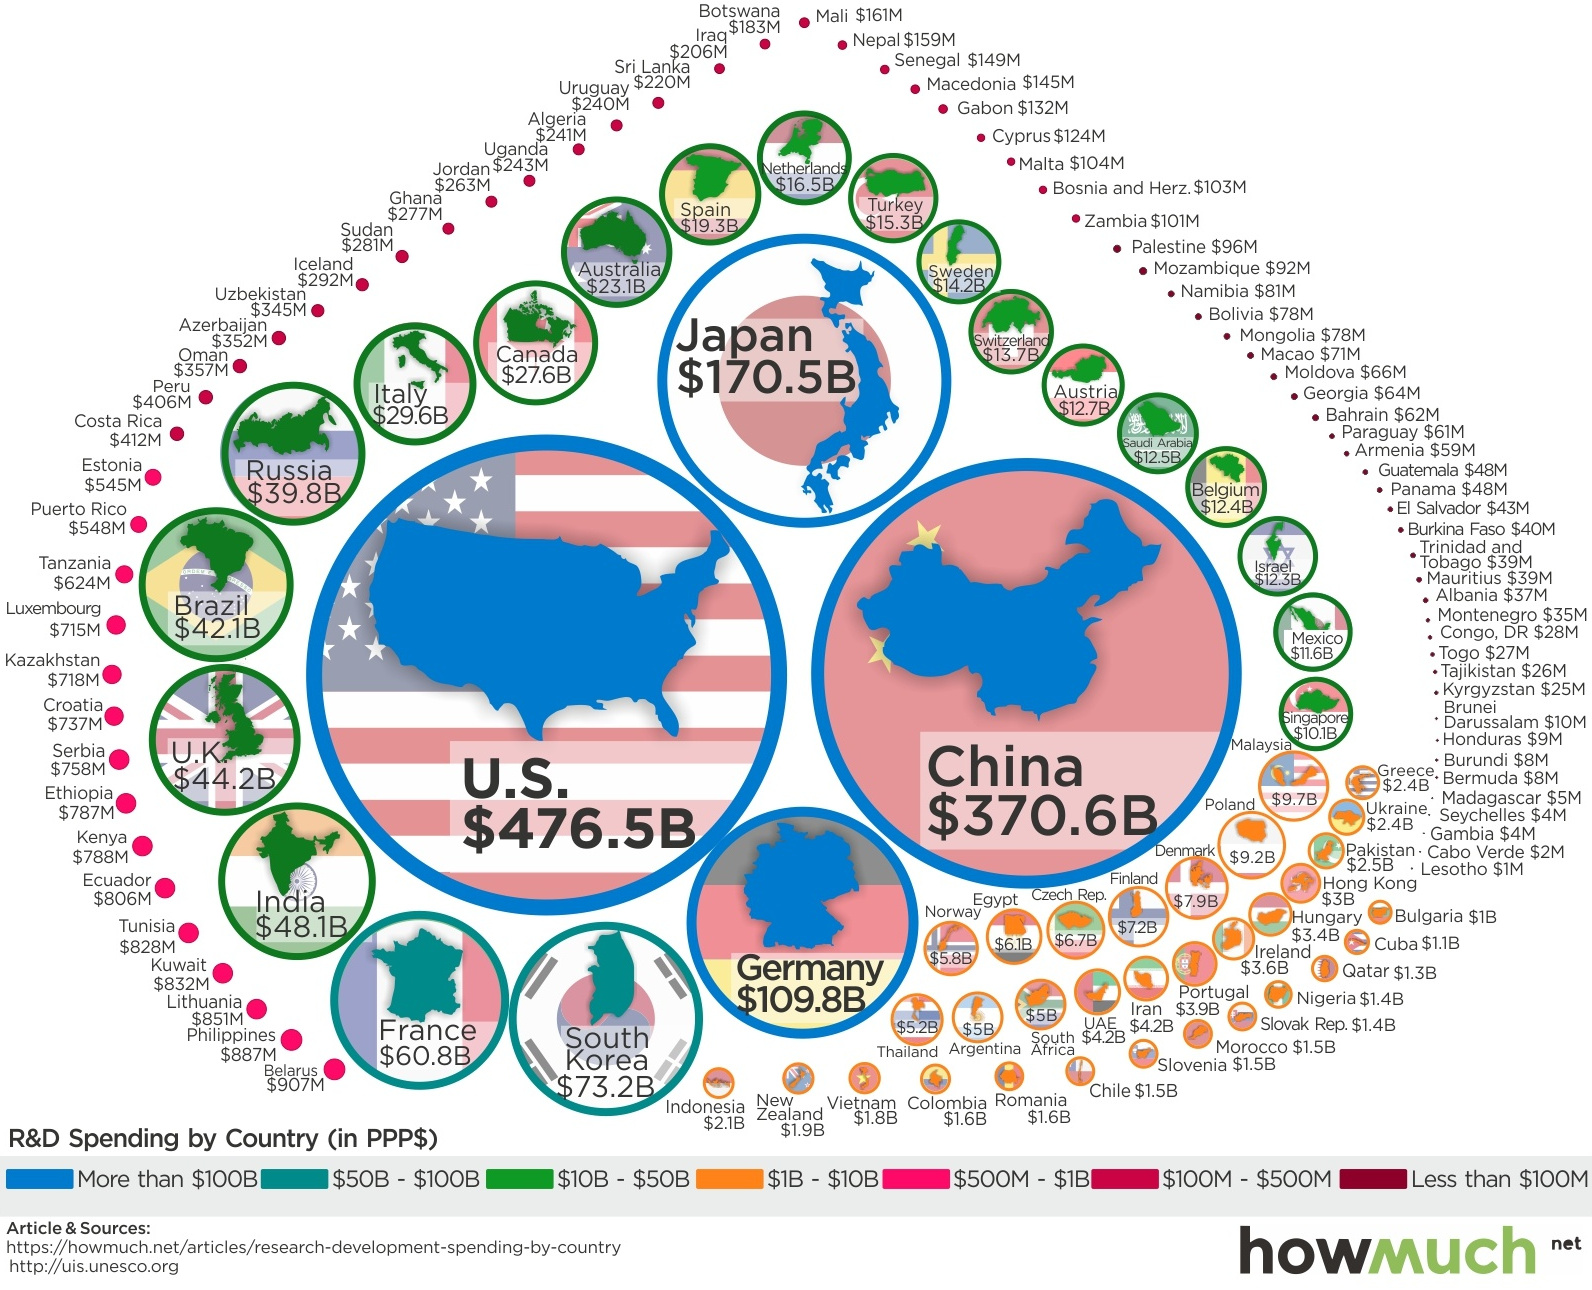
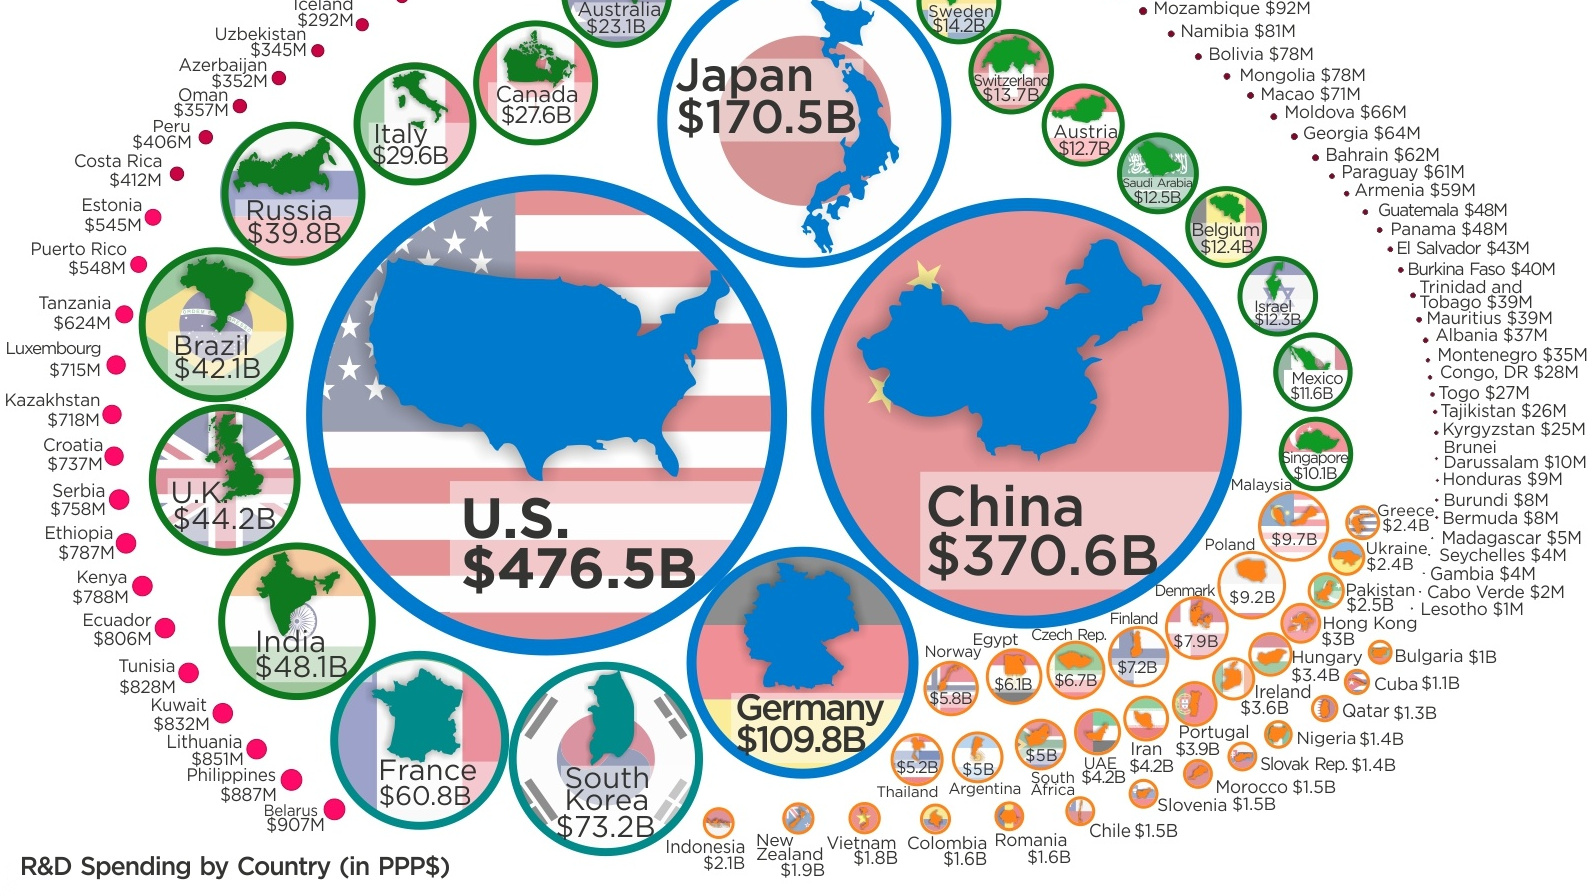
Today’s infographic comes to us from HowMuch.net, and it compares R&D numbers for nearly every country in the world. It uses data from the UNESCO Institute for Statistics adjusted for purchasing-power parity (PPP).
As you can see, R&D expenditures are heavily concentrated at the top of the food chain:
| Rank | Country | R&D Spending (PPP) | Global share (%) |
|---|---|---|---|
| #1 | United States | $476.5 billion | 26.4% |
| #2 | China | $370.6 billion | 20.6% |
| #3 | Japan | $170.5 billion | 9.5% |
| #4 | Germany | $109.8 billion | 6.1% |
| #5 | South Korea | $73.2 billion | 4.1% |
| #6 | France | $60.8 billion | 3.4% |
| #7 | India | $48.1 billion | 2.7% |
| #8 | United Kingdom | $44.2 billion | 2.5% |
| #9 | Brazil | $42.1 billion | 2.3% |
| #10 | Russia | $39.8 billion | 2.2% |
| #11 | Italy | $29.6 billion | 1.6% |
| #12 | Canada | $27.6 billion | 1.5% |
| #13 | Australia | $23.1 billion | 1.3% |
| #14 | Spain | $19.3 billion | 1.1% |
| #15 | Netherlands | $16.5 billion | 0.9% |
| All other countries | $249.8 billion | 13.9% |
Put together the numbers for the U.S. ($476.5 billion) and China ($370.6 billion), and it amounts to 47.0% of total global R&D expenditures. Add in Japan and Germany, and the total goes to 62.5%.
At same time, the countries left off the above list don’t even combine for 15% of the world’s total R&D expenditures.
As a Percentage of GDP
Measuring R&D in absolute terms shows where most of the world’s research happens, but it fails to capture the countries that are spending more in relative terms.
Which countries allocate the highest percentage of their economy to research and development?
| Rank | Country | R&D (as a % of GDP) |
|---|---|---|
| #1 | South Korea | 4.3% |
| #2 | Israel | 4.2% |
| #3 | Japan | 3.4% |
| #4 | Switzerland | 3.2% |
| #5 | Finland | 3.2% |
| #6 | Austria | 3.1% |
| #7 | Sweden | 3.1% |
| #8 | Denmark | 2.9% |
| #9 | Germany | 2.9% |
| #10 | United States | 2.7% |
As you can see, countries like South Korea and Japan allocate the highest portion of their economies to R&D, which is part of the reason they rank so highly on the list in absolute terms as well.
Meanwhile, there are some smaller economies – namely Israel (4.2%) – that spend a far higher portion than normal on research.


Technology
Ranked: Semiconductor Companies by Industry Revenue Share
Nvidia is coming for Intel’s crown. Samsung is losing ground. AI is transforming the space. We break down revenue for semiconductor companies.


Semiconductor Companies by Industry Revenue Share
This was originally posted on our Voronoi app. Download the app for free on Apple or Android and discover incredible data-driven charts from a variety of trusted sources.
Did you know that some computer chips are now retailing for the price of a new BMW?
As computers invade nearly every sphere of life, so too have the chips that power them, raising the revenues of the businesses dedicated to designing them.
But how did various chipmakers measure against each other last year?
We rank the biggest semiconductor companies by their percentage share of the industry’s revenues in 2023, using data from Omdia research.
Which Chip Company Made the Most Money in 2023?
Market leader and industry-defining veteran Intel still holds the crown for the most revenue in the sector, crossing $50 billion in 2023, or 10% of the broader industry’s topline.
All is not well at Intel, however, with the company’s stock price down over 20% year-to-date after it revealed billion-dollar losses in its foundry business.
| Rank | Company | 2023 Revenue | % of Industry Revenue |
|---|---|---|---|
| 1 | Intel | $51B | 9.4% |
| 2 | NVIDIA | $49B | 9.0% |
| 3 | Samsung Electronics | $44B | 8.1% |
| 4 | Qualcomm | $31B | 5.7% |
| 5 | Broadcom | $28B | 5.2% |
| 6 | SK Hynix | $24B | 4.4% |
| 7 | AMD | $22B | 4.1% |
| 8 | Apple | $19B | 3.4% |
| 9 | Infineon Tech | $17B | 3.2% |
| 10 | STMicroelectronics | $17B | 3.2% |
| 11 | Texas Instruments | $17B | 3.1% |
| 12 | Micron Technology | $16B | 2.9% |
| 13 | MediaTek | $14B | 2.6% |
| 14 | NXP | $13B | 2.4% |
| 15 | Analog Devices | $12B | 2.2% |
| 16 | Renesas Electronics Corporation | $11B | 1.9% |
| 17 | Sony Semiconductor Solutions Corporation | $10B | 1.9% |
| 18 | Microchip Technology | $8B | 1.5% |
| 19 | Onsemi | $8B | 1.4% |
| 20 | KIOXIA Corporation | $7B | 1.3% |
| N/A | Others | $126B | 23.2% |
| N/A | Total | $545B | 100% |
Note: Figures are rounded. Totals and percentages may not sum to 100.
Meanwhile, Nvidia is very close to overtaking Intel, after declaring $49 billion of topline revenue for 2023. This is more than double its 2022 revenue ($21 billion), increasing its share of industry revenues to 9%.
Nvidia’s meteoric rise has gotten a huge thumbs-up from investors. It became a trillion dollar stock last year, and broke the single-day gain record for market capitalization this year.
Other chipmakers haven’t been as successful. Out of the top 20 semiconductor companies by revenue, 12 did not match their 2022 revenues, including big names like Intel, Samsung, and AMD.
The Many Different Types of Chipmakers
All of these companies may belong to the same industry, but they don’t focus on the same niche.
According to Investopedia, there are four major types of chips, depending on their functionality: microprocessors, memory chips, standard chips, and complex systems on a chip.
Nvidia’s core business was once GPUs for computers (graphics processing units), but in recent years this has drastically shifted towards microprocessors for analytics and AI.
These specialized chips seem to be where the majority of growth is occurring within the sector. For example, companies that are largely in the memory segment—Samsung, SK Hynix, and Micron Technology—saw peak revenues in the mid-2010s.

-

 Real Estate2 weeks ago
Visualizing America’s Shortage of Affordable Homes
-

 Technology1 week ago
Ranked: Semiconductor Companies by Industry Revenue Share
-

 Money1 week ago
Which States Have the Highest Minimum Wage in America?
-

 Real Estate1 week ago
Ranked: The Most Valuable Housing Markets in America
-

 Business2 weeks ago
Charted: Big Four Market Share by S&P 500 Audits
-

 AI2 weeks ago
The Stock Performance of U.S. Chipmakers So Far in 2024
-

 Misc2 weeks ago
Almost Every EV Stock is Down After Q1 2024
-

 Money2 weeks ago
Where Does One U.S. Tax Dollar Go?