United States
Charted: U.S. Median House Prices vs. Income
![]() See this visualization first on the Voronoi app.
See this visualization first on the Voronoi app.
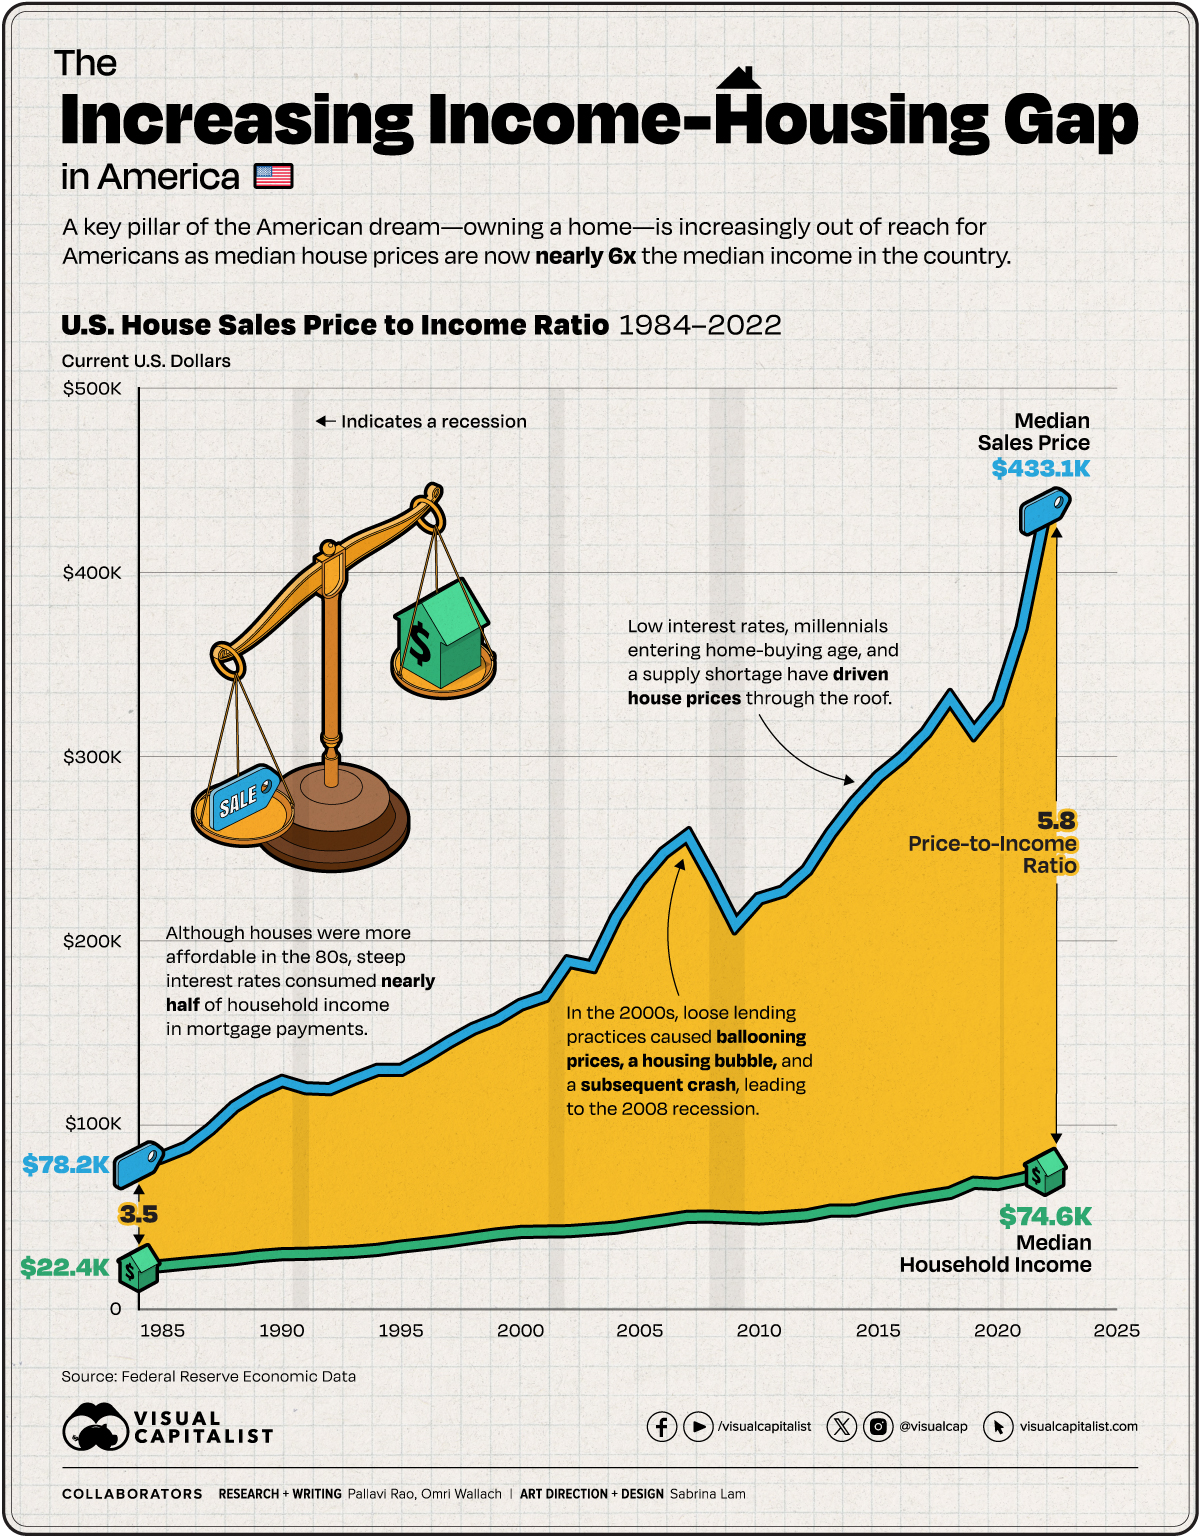
Houses in America Now Cost Six Times the Median Income
This was originally posted on our Voronoi app. Download the app for free on iOS or Android and discover incredible data-driven charts from a variety of trusted sources.
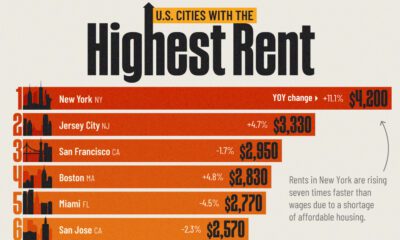
As of 2023, an American household hoping to buy a median-priced home, needs to make at least $100,000 a year. In some cities, they need to make nearly 3–4x that amount.
The median household income in the country is currently well below that $100,000 threshold. To look at the trends between median incomes and median house prices through the years, we charted their movement using the following datasets data from the Federal Reserve:
- Median household income (1984–2022).
- Median Sales Price of Houses Sold (1963–2023).
Importantly this graphic does not make allowances for actual household disposable income, nor how monthly mortgage payments change depending on the interest rates at the time. Finally, both datasets are in current U.S. dollars, meaning they are not adjusted for inflation.
Timeline: Median House Prices vs. Income in America
In 1984, the median annual income for an American household stood at $22,420, and the median house sales price for the first quarter of the year came in at $78,200. The house sales price-to-income ratio stood at 3.49.
By pure arithmetic, this is the most affordable houses have been in the U.S. since the Federal Reserve began tracking this data, as seen in the table below.
A hidden caveat of course, was inflation: running rampant towards the end of the 70s and the start of the 80s. While it fell significantly in the next five years, in 1984 the 30-year fixed rate was close to 14%, meaning a significant chunk of household income went to interest payments.
| Date | Median House Sales Price | Median Household Income | Price-to-Income Ratio |
|---|---|---|---|
| 1984-01-01 | $78,200 | $22,420 | 3.49 |
| 1985-01-01 | $82,800 | $23,620 | 3.51 |
| 1986-01-01 | $88,000 | $24,900 | 3.53 |
| 1987-01-01 | $97,900 | $26,060 | 3.76 |
| 1988-01-01 | $110,000 | $27,230 | 4.04 |
| 1989-01-01 | $118,000 | $28,910 | 4.08 |
| 1990-01-01 | $123,900 | $29,940 | 4.14 |
| 1991-01-01 | $120,000 | $30,130 | 3.98 |
| 1992-01-01 | $119,500 | $30,640 | 3.90 |
| 1993-01-01 | $125,000 | $31,240 | 4.00 |
| 1994-01-01 | $130,000 | $32,260 | 4.03 |
| 1995-01-01 | $130,000 | $34,080 | 3.81 |
| 1996-01-01 | $137,000 | $35,490 | 3.86 |
| 1997-01-01 | $145,000 | $37,010 | 3.92 |
| 1998-01-01 | $152,200 | $38,890 | 3.91 |
| 1999-01-01 | $157,400 | $40,700 | 3.87 |
| 2000-01-01 | $165,300 | $41,990 | 3.94 |
| 2001-01-01 | $169,800 | $42,230 | 4.02 |
| 2002-01-01 | $188,700 | $42,410 | 4.45 |
| 2003-01-01 | $186,000 | $43,320 | 4.29 |
| 2004-01-01 | $212,700 | $44,330 | 4.80 |
| 2005-01-01 | $232,500 | $46,330 | 5.02 |
| 2006-01-01 | $247,700 | $48,200 | 5.14 |
| 2007-01-01 | $257,400 | $50,230 | 5.12 |
| 2008-01-01 | $233,900 | $50,300 | 4.65 |
| 2009-01-01 | $208,400 | $49,780 | 4.19 |
| 2010-01-01 | $222,900 | $49,280 | 4.52 |
| 2011-01-01 | $226,900 | $50,050 | 4.53 |
| 2012-01-01 | $238,400 | $51,020 | 4.67 |
| 2013-01-01 | $258,400 | $53,590 | 4.82 |
| 2014-01-01 | $275,200 | $53,660 | 5.13 |
| 2015-01-01 | $289,200 | $56,520 | 5.12 |
| 2016-01-01 | $299,800 | $59,040 | 5.08 |
| 2017-01-01 | $313,100 | $61,140 | 5.12 |
| 2018-01-01 | $331,800 | $63,180 | 5.25 |
| 2019-01-01 | $313,000 | $68,700 | 4.56 |
| 2020-01-01 | $329,000 | $68,010 | 4.84 |
| 2021-01-01 | $369,800 | $70,780 | 5.22 |
| 2022-01-01 | $433,100 | $74,580 | 5.81 |
Note: The median house sale price listed in this table and in the chart is from the first quarter of each year. As a result the ratio can vary between quarters of each year.
The mid-2000s witnessed an explosive surge in home prices, eventually culminating in a housing bubble and subsequent crash—an influential factor in the 2008 recession. Subprime mortgages played a pivotal role in this scenario, as they were issued to buyers with poor credit and then bundled into seemingly more attractive securities for financial institutions. However, these loans eventually faltered as economic circumstances changed.
In response to the recession and to stimulate economic demand, the Federal Reserve reduced interest rates, consequently lowering mortgage rates.
While this measure aimed to make homeownership more accessible, it also contributed to a significant increase in housing prices in the following years. Additionally, a new generation entering the home-buying market heightened demand. Simultaneously, a scarcity of new construction and a surge in investors and corporations converting housing units into rental properties led to a shortage in supply, exerting upward pressure on prices.
As a result, median house prices are now nearly 6x the median household income in America.
How Does Unaffordable Housing Affect the U.S. Economy?
When housing costs exceed a significant portion of household income, families are forced to cut back on other essential expenditures, dampening consumer spending. Given how expanding housing supply helped drive U.S. economic growth in the 20th century, the current constraints in the country are especially ironic.
Unaffordable housing also stifles mobility, as individuals may be reluctant to relocate for better job opportunities due to housing constraints. On the flip side, many cities are seeing severe labor shortages as many lower-wage workers simply cannot afford to live in the city. Both phenomena affect market efficiency and productivity growth.


Maps
Mapped: Median Income by State in 2024
This graphic shows median income by state in 2024, adjusted for cost of living. Can you guess where it’s the highest?
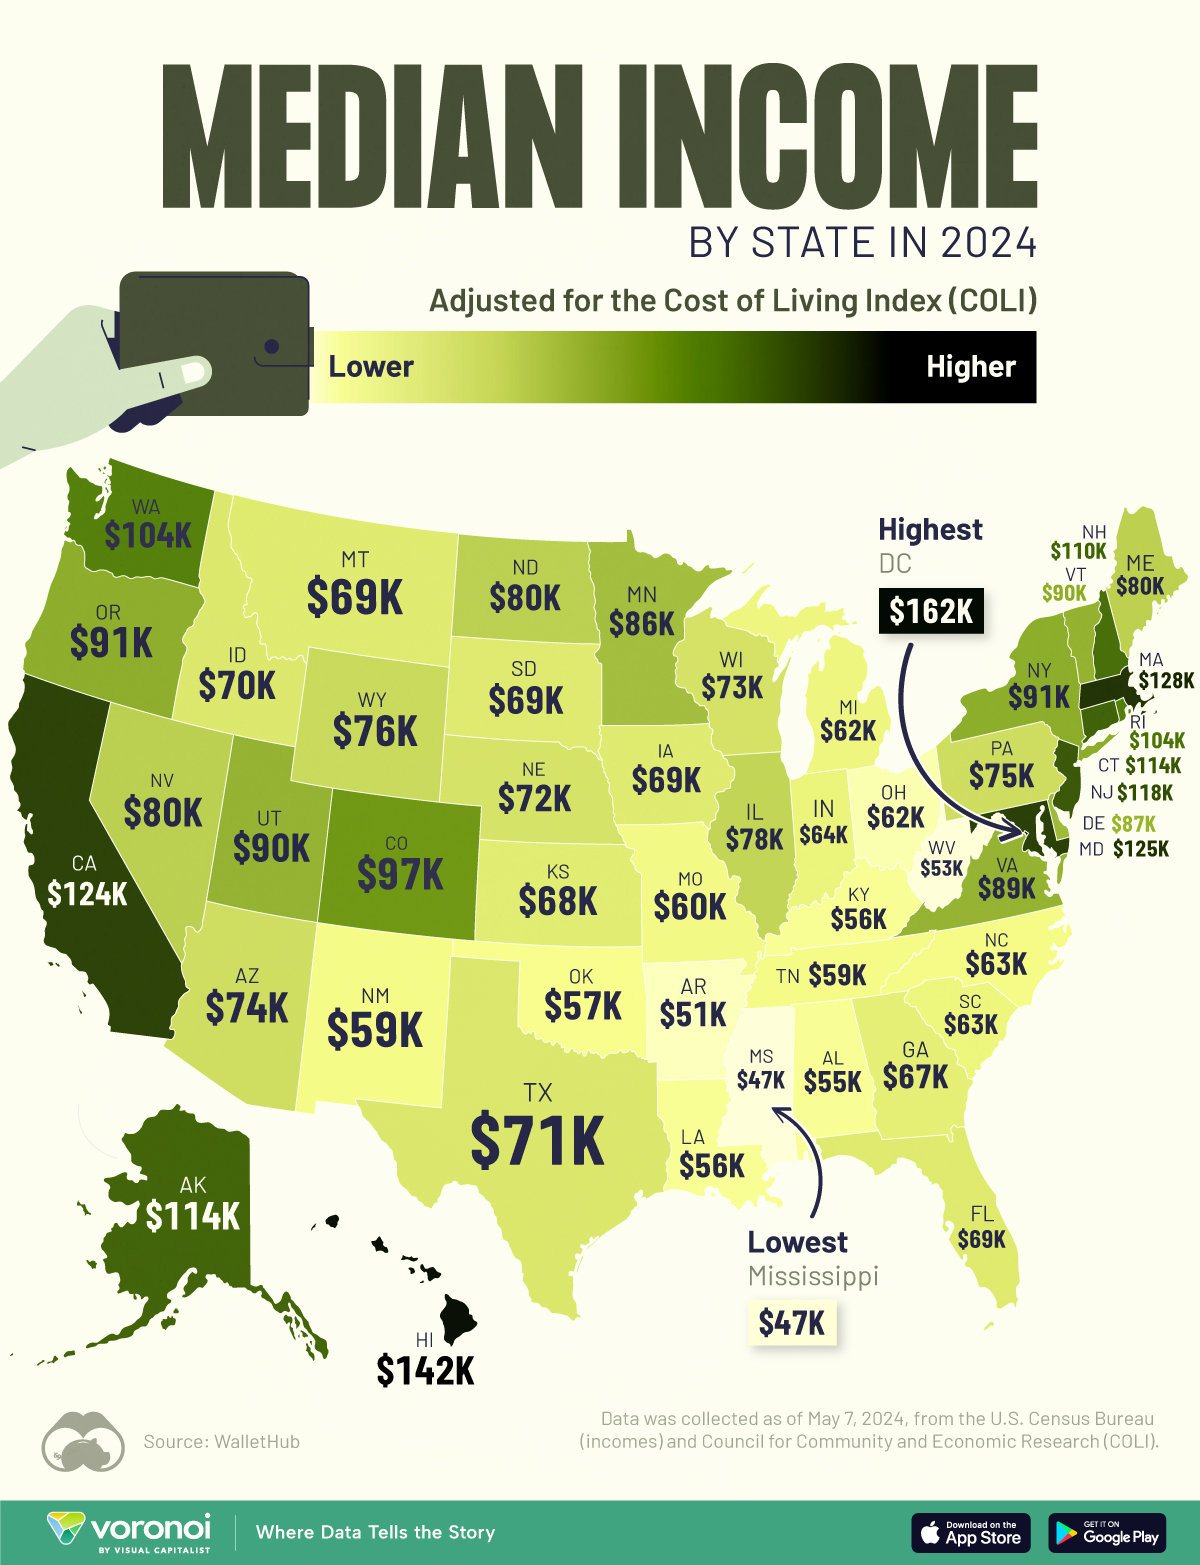
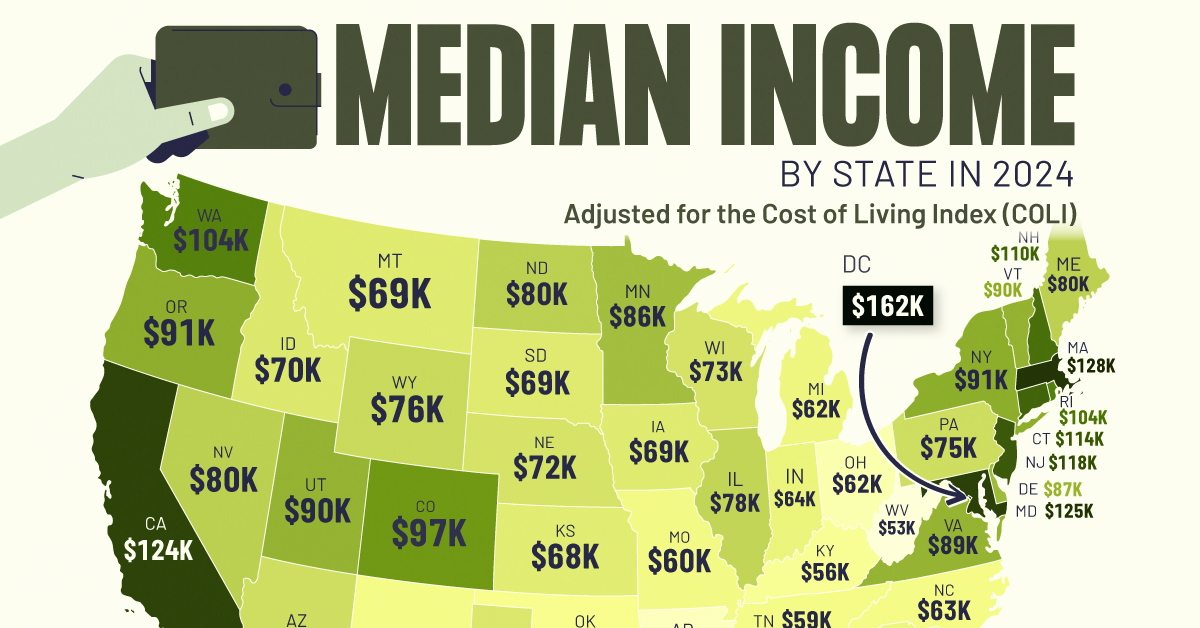
Median Income by State in 2024, Adjusted for Cost of Living
This was originally posted on our Voronoi app. Download the app for free on iOS or Android and discover incredible data-driven charts from a variety of trusted sources.
To gain insight into the U.S. economy, we’ve visualized the median income by state, as of May 2024. These figures come from WalletHub, which sourced income data from the U.S. Census Bureau and adjusted it for cost of living according to the Cost of Living Index (COLI).
Data and Key Takeaways
All of the numbers we used to create this graphic are listed in the table below.
| Rank | State | Median Annual Income (adjusted for cost of living) |
|---|---|---|
| 1 | DC | $162,265 |
| 2 | Hawaii | $141,832 |
| 3 | Massachusetts | $127,760 |
| 4 | Maryland | $124,693 |
| 5 | California | $123,988 |
| 6 | New Jersey | $117,847 |
| 7 | Connecticut | $114,156 |
| 8 | Alaska | $113,934 |
| 9 | New Hampshire | $110,205 |
| 10 | Rhode Island | $104,252 |
| 11 | Washington | $103,748 |
| 12 | Colorado | $97,301 |
| 13 | New York | $91,366 |
| 14 | Oregon | $91,100 |
| 15 | Utah | $89,786 |
| 16 | Vermont | $89,695 |
| 17 | Virginia | $89,393 |
| 18 | Delaware | $87,173 |
| 19 | Minnesota | $86,364 |
| 20 | Nevada | $80,366 |
| 21 | North Dakota | $79,874 |
| 22 | Maine | $79,800 |
| 23 | Illinois | $78,304 |
| 24 | Wyoming | $76,307 |
| 25 | Pennsylvania | $74,711 |
| 26 | Arizona | $74,375 |
| 27 | Wisconsin | $72,602 |
| 28 | Nebraska | $72,384 |
| 29 | Texas | $70,513 |
| 30 | Idaho | $70,041 |
| 31 | South Dakota | $69,266 |
| 32 | Iowa | $68,974 |
| 33 | Montana | $68,937 |
| 34 | Florida | $68,818 |
| 35 | Kansas | $68,489 |
| 36 | Georgia | $66,612 |
| 37 | Indiana | $64,170 |
| 38 | North Carolina | $63,025 |
| 39 | South Carolina | $62,909 |
| 40 | Michigan | $62,446 |
| 41 | Ohio | $61,904 |
| 42 | Missouri | $59,715 |
| 43 | Tennessee | $59,077 |
| 44 | New Mexico | $58,911 |
| 45 | Oklahoma | $57,215 |
| 46 | Louisiana | $56,282 |
| 47 | Kentucky | $55,629 |
| 48 | Alabama | $55,480 |
| 49 | West Virginia | $52,719 |
| 50 | Arkansas | $51,032 |
| 51 | Mississippi | $46,880 |
The Cost of Living Index, published by the Council for Community and Economic Research (C2ER), was established in 1968, and allows for consistent place-to-place cost comparisons.
The index considers six categories of spending: groceries, housing, utilities, transportation, health care, and miscellaneous.
After adjusting for COLI, the top three states by median income are the District of Columbia (DC) (technically a district), Hawaii, and Massachusetts.
In DC, federal government agencies are the biggest employers. Many of them offer high-paying jobs that require higher education and specialized skills. DC, like Hawaii, also has a relatively higher cost of living, which may push up the average salary.
In the case of Massachusetts, the state is home to many of the world’s most prestigious universities and research institutions, as well as high-earning sectors like healthcare and tech.
See More U.S. Maps From Visual Capitalist
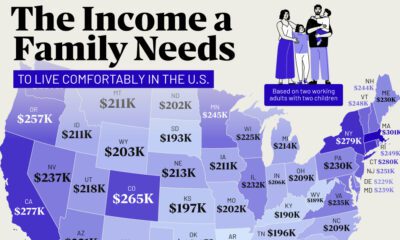
If you enjoyed this post, be sure to check out Mapped: The Income Needed to Live Comfortably in Every U.S. State

-

 Misc1 week ago
Where Unemployment Benefits are the Highest, in OECD Countries
-

 Money1 week ago
Ranked: The World’s Top 10 Billionaires in 2024
-

 Stocks1 week ago
All of the World’s Trillion-Dollar Companies in One Chart
-

 Markets1 week ago
The Growth of $100 Invested in Jim Simons’ Medallion Fund
-

 Stocks1 week ago
Charted: Four Decades of U.S. Tech IPOs
-

 Retail1 week ago
Ranked: The 20 Top Retailers Worldwide, by Revenue
-

 Sports1 week ago
Ranked: Which NBA Team Takes Home the Most Revenue?
-

 Markets1 week ago
Charted: Stock Buybacks by the Magnificent Seven