Energy
Measuring the Level of Competition for Valuable Minerals
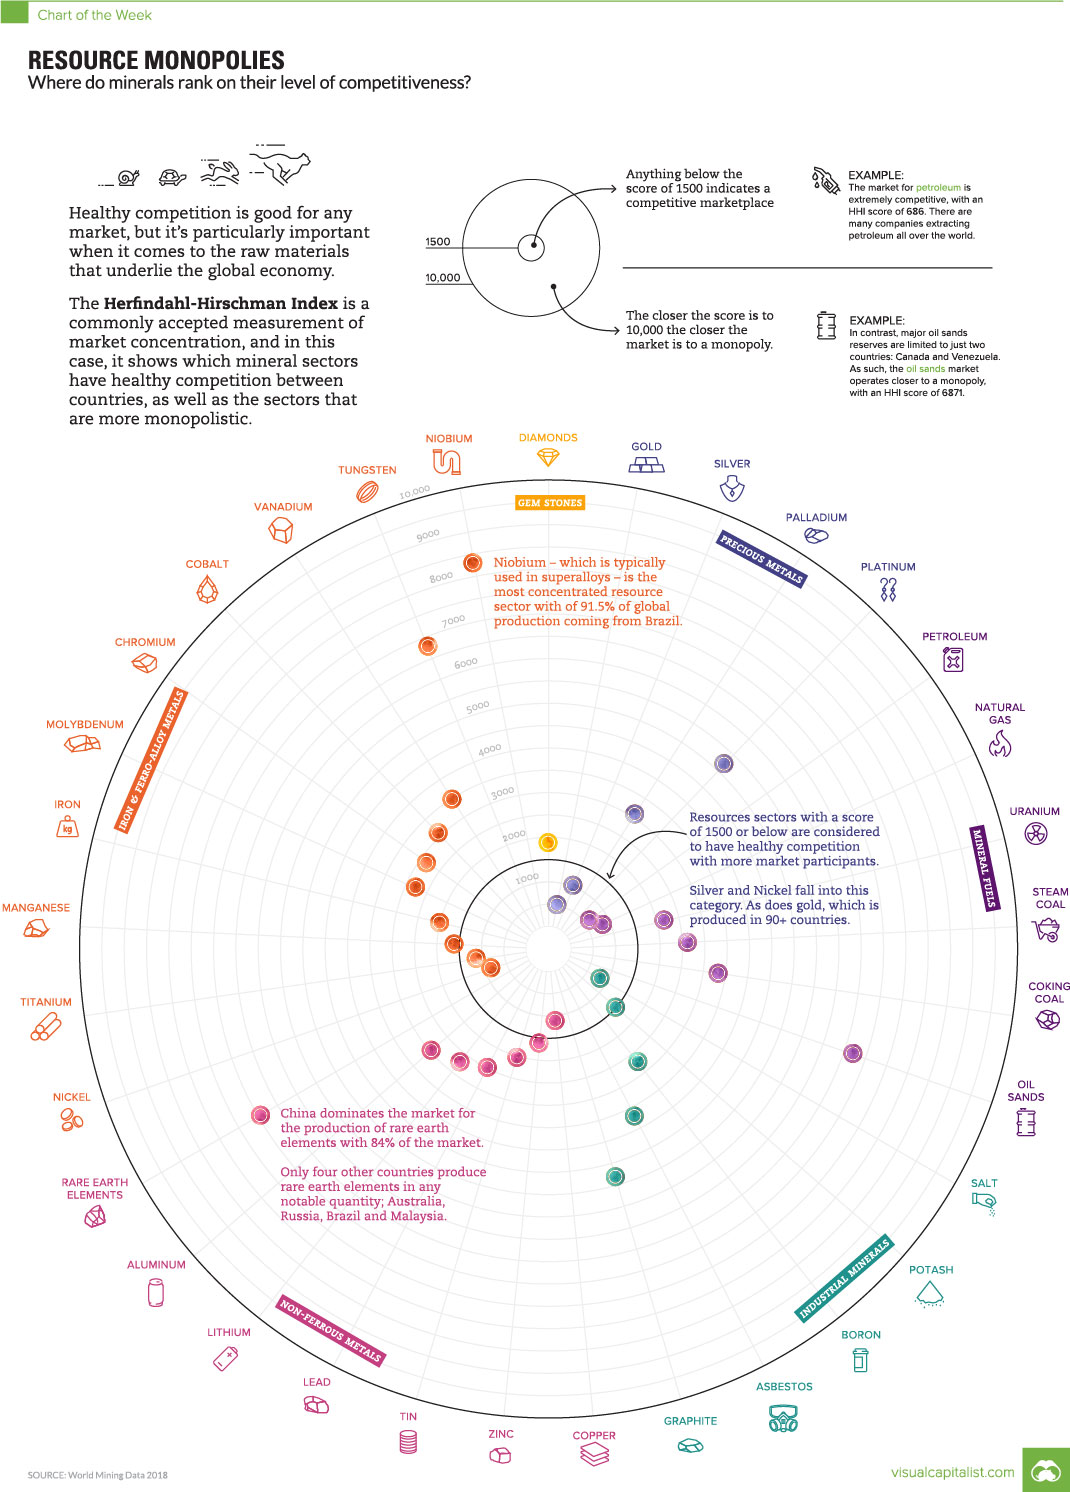
Measuring Competition for Valuable Minerals
The Chart of the Week is a weekly Visual Capitalist feature on Fridays.
Everybody loves a little competition.
It levels the playing field and ensures prices and products are kept affordable and available. But how do you measure and track the competitiveness of specific sectors?
The Herfindahl-Hirschman Index (HHI) is a commonly accepted measurement of market concentration, and in today’s case, we use it to show which mineral sectors have healthy competition between countries, as well as the sectors that are more monopolistic.
What is the Herfindahl-Hirschman Index?
The HHI is calculated by squaring the market share of each competitor and then summing up the resulting numbers. It can range from zero to 10,000.
The closer a market is to a monopoly, the higher the market’s concentration, and the lower its competition. If there were only one company in an industry, that company would have a 100% share of the market, and the HHI would equal 10,000, demonstrating a monopoly.
Conversely, if there were thousands of firms competing, the HHI would be near zero, indicating almost perfect competition.
- HHI below 1,500: a competitive marketplace
- HHI between 1,500 – 2,500: a moderately concentrated marketplace
- HHI of 2,500 or greater: a highly concentrated marketplace
Interestingly, the same technique is also used by the U.S. Department of Justice to look at market competition and potential anti-trust violators, as well.
Global Metal Production
Today’s chart uses data from the World Mining Congress to look at the competition for global minerals between countries. The HHI scores show the minerals most and least exposed to competition, while uncovering opportunities for countries looking to bolster their own mineral production.
Here are 33 minerals ranked, going from highest score (most monopolistic) to lowest (least monopolistic):
| Rank | Mineral | HHI Score | Type of Mineral |
|---|---|---|---|
| #1 | Niobium (Nb2O5) | 8,413 | Iron and Ferro-Alloy Metals |
| #2 | REE (Rare Earth Elements) | 7,219 | Non-Ferrous Metals |
| #3 | Oil Sands | 6,871 | Mineral Fuels |
| #4 | Tungsten (W) | 6,828 | Iron and Ferro-Alloy Metals |
| #5 | Platinum (Pt) | 5,383 | Precious Metals |
| #6 | Graphite | 4,990 | Industrial Minerals |
| #7 | Asbestos | 3,738 | Industrial Minerals |
| #8 | Vanadium (V) | 3,573 | Iron and Ferro-Alloy Metals |
| #9 | Coking Coal | 3,423 | Mineral Fuels |
| #10 | Cobalt (Co) | 3,184 | Iron and Ferro-Alloy Metals |
| #11 | Palladium (Pd) | 3,163 | Precious Metals |
| #12 | Aluminum (Al) | 3,078 | Non-Ferrous Metals |
| #13 | Chromium (Cr2O3) | 2,942 | Iron and Ferro-Alloy Metals |
| #14 | Molybdenum (Mo) | 2,812 | Iron and Ferro-Alloy Metals |
| #15 | Boron (B) | 2,749 | Industrial Minerals |
| #16 | Lithium (Li2O) | 2,749 | Non-Ferrous Metals |
| #17 | Steam Coal | 2,639 | Mineral Fuels |
| #18 | Lead (Pb) | 2,505 | Non-Ferrous Metals |
| #19 | Uranium (U308) | 2,233 | Mineral Fuels |
| #20 | Tin (Sn) | 2,036 | Non-Ferrous Metals |
| #21 | Iron (Fe) | 2,015 | Iron and Ferro-Alloy Metals |
| #22 | Diamond | 1,904 | Gemstones |
| #23 | Zinc (Zn) | 1,687 | Non-Ferrous Metals |
| #24 | Manganese (Mn) | 1,627 | Iron and Ferro-Alloy Metals |
| #25 | Potash | 1,565 | Industrial Minerals |
| #26 | Copper (Cu) | 1,136 | Non-Ferrous Metals |
| #27 | Titanium (TIO2) | 1,120 | Iron and Ferro-Alloy Metals |
| #28 | Silver (Ag) | 1,015 | Precious Metals |
| #29 | Salt (NaCl) | 982 | Industrial Minerals |
| #30 | Nickel (Ni) | 949 | Iron and Ferro-Alloy Metals |
| #31 | Natural Gas | 884 | Mineral Fuels |
| #32 | Petroleum | 686 | Mineral Fuels |
| #33 | Gold (Au) | 557 | Precious Metals |
The data here makes it clear that mineral production is not uniformly distributed throughout the world, giving some countries huge advantages while revealing potential supply problems down the road.
Renewables in the Spotlight
While commodities like gold and oil have robust levels of competition around the world, the renewable energy industry relies on more obscure raw materials to make solar, wind, and EVs work.
Rare earth elements (REE) rank #2 on the list with a HHI score of 7,219, while battery minerals such as graphite (#6), vanadium (#8), cobalt (#10), and lithium (#16) also appear high on the list as well.
According to a recent study, the production of rare earth elements is an area of particular concern. Used in everything from electric motors to wind turbines, rare earth demand will need to increase by twelve times by 2050 to reach emissions targets set by the Paris Agreement.
The only problem is that China currently controls 84% of global production, which increases the odds of bottlenecks and scarcity as demand rises. This ultimately creates an interesting scenario, where a sustainable future will be at the mercy of a few a producing nations.


Energy
The World’s Biggest Nuclear Energy Producers
China has grown its nuclear capacity over the last decade, now ranking second on the list of top nuclear energy producers.


The World’s Biggest Nuclear Energy Producers
This was originally posted on our Voronoi app. Download the app for free on Apple or Android and discover incredible data-driven charts from a variety of trusted sources.
Scientists in South Korea recently broke a record in a nuclear fusion experiment. For 48 seconds, they sustained a temperature seven times that of the sun’s core.
But generating commercially viable energy from nuclear fusion still remains more science fiction than reality. Meanwhile, its more reliable sibling, nuclear fission, has been powering our world for many decades.
In this graphic, we visualized the top producers of nuclear energy by their share of the global total, measured in terawatt hours (TWh). Data for this was sourced from the Nuclear Energy Institute, last updated in August 2022.
Which Country Generates the Most Nuclear Energy?
Nuclear energy production in the U.S. is more than twice the amount produced by China (ranked second) and France (ranked third) put together. In total, the U.S. accounts for nearly 30% of global nuclear energy output.
However, nuclear power only accounts for one-fifth of America’s electricity supply. This is in contrast to France, which generates 60% of its electricity from nuclear plants.
| Rank | Country | Nuclear Energy Produced (TWh) | % of Total |
|---|---|---|---|
| 1 | 🇺🇸 U.S. | 772 | 29% |
| 2 | 🇨🇳 China | 383 | 14% |
| 3 | 🇫🇷 France | 363 | 14% |
| 4 | 🇷🇺 Russia | 208 | 8% |
| 5 | 🇰🇷 South Korea | 150 | 6% |
| 6 | 🇨🇦 Canada | 87 | 3% |
| 7 | 🇺🇦 Ukraine | 81 | 3% |
| 8 | 🇩🇪 Germany | 65 | 2% |
| 9 | 🇯🇵 Japan | 61 | 2% |
| 10 | 🇪🇸 Spain | 54 | 2% |
| 11 | 🇸🇪 Sweden | 51 | 2% |
| 12 | 🇧🇪 Belgium | 48 | 2% |
| 13 | 🇬🇧 UK | 42 | 2% |
| 14 | 🇮🇳 India | 40 | 2% |
| 15 | 🇨🇿 Czech Republic | 29 | 1% |
| N/A | 🌐 Other | 219 | 8% |
| N/A | 🌍 Total | 2,653 | 100% |
Another highlight is how China has rapidly grown its nuclear energy capabilities in the last decade. Between 2016 and 2021, for example, it increased its share of global nuclear energy output from less than 10% to more than 14%, overtaking France for second place.
On the opposite end, the UK’s share has slipped to 2% over the same time period.
Meanwhile, Ukraine has heavily relied on nuclear energy to power its grid. In March 2022, it lost access to its key Zaporizhzhia Nuclear Power Station after Russian forces wrested control of the facility. With six 1,000 MW reactors, the plant is one of the largest in Europe. It is currently not producing any power, and has been the site of recent drone attacks.

-

 Mining2 weeks ago
Charted: The Value Gap Between the Gold Price and Gold Miners
-

 Real Estate1 week ago
Ranked: The Most Valuable Housing Markets in America
-

 Business1 week ago
Charted: Big Four Market Share by S&P 500 Audits
-

 AI1 week ago
The Stock Performance of U.S. Chipmakers So Far in 2024
-

 Misc1 week ago
Almost Every EV Stock is Down After Q1 2024
-

 Money2 weeks ago
Where Does One U.S. Tax Dollar Go?
-

 Green2 weeks ago
Ranked: Top Countries by Total Forest Loss Since 2001
-

 Real Estate2 weeks ago
Visualizing America’s Shortage of Affordable Homes