Technology
Charting the Massive Scale of the Digital Cloud
View the full-size version of this infographic.

Charting the Massive Scale of the Digital Cloud
View the high resolution of this infographic by clicking here.
Cloud computing continues to be on the rise, and for good reason. It’s transformed our digital experience in numerous ways, from how we store data to the way we share information online with others.
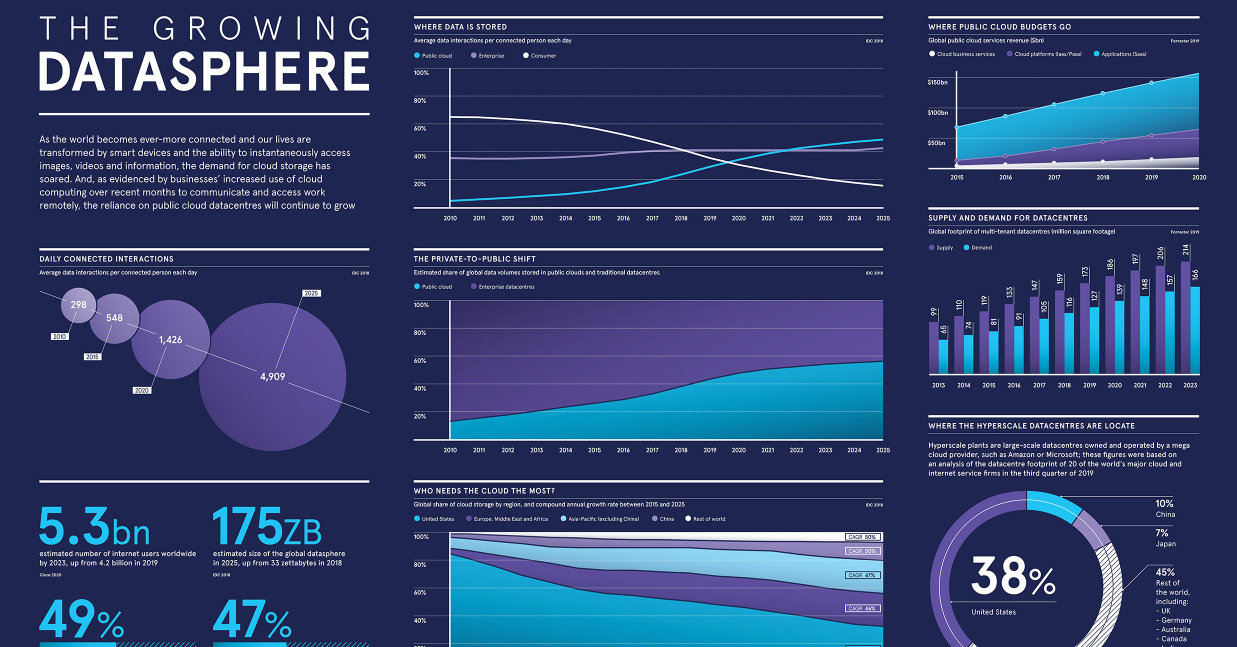
Growth in cloud services is showing no signs of slowing down, particularly in the data storage realm—by 2025, almost half of the world’s stored data will reside in public cloud environments. Yet, despite its increasing popularity among consumers and businesses alike, do people really understand what the cloud fully entails? Or better yet, what the cloud even is?
Today’s infographic from Raconteur provides an overview of the fast-changing cloud computing landscape, showcasing the industry’s growth and its evolution in scale. It also touches on what’s next for the cloud.
What is Cloud Computing?
Put simply, cloud computing is a network of remote servers that provides customers with a number of offerings, including data storage, processing power, and apps. It’s usually delivered on a pay-per-use basis.
Cloud computing can be broken down into three categories:
- Infrastructure-as-a-Service (IaaS): Virtual computing services that businesses can utilize over the internet. IaaS allows businesses to scale up resources when needed, and pay for what they use. Microsoft Azure and Amazon Web Services are both IaaS examples.
- Platform-as-a-Service (PaaS): Like IaaS, PaaS utilizes remote infrastructure, but it includes an extra layer by offering tools that developers use to build apps. Examples of PaaS in action include the Google App Engine or OpenShift.
- Software-as-a-Service (Saas): The delivery of apps through remote servers. This is the type of cloud computing most users are familiar with. Examples include Dropbox and Google Apps.
Cloud computing has its obstacles, such as security and privacy risks. Yet, the cloud continues to entice consumers by offering a new level of accessibility to their online experience.
This accessibility has also drastically changed the working world. The cloud allows users to access company servers from anywhere globally, and to share documents and information with colleagues quickly. Because of this, it’s become a key part of remote work.
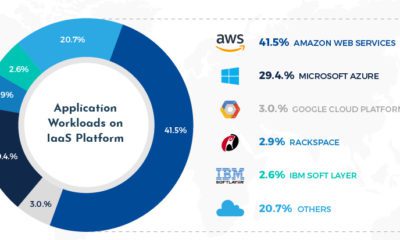
IaaS: The Backbone of the Cloud
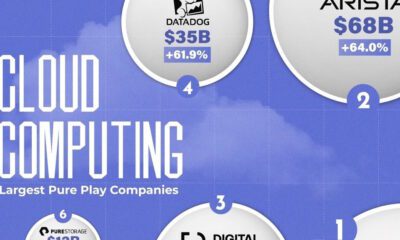
Cloud services are seeing significant growth, and the big tech companies are its backbone.
In fact, four major players combine to dominate almost 60% of the cloud’s infrastructure. Here’s a look at the cloud market breakdown in 2019, and annual growth compared to 2018:
| Service Provider | 2019 Market Share | Annual Growth |
|---|---|---|
| Amazon Web Services | 32.3% | +36.0% |
| Microsoft Azure | 16.9% | +63.9% |
| Google Cloud | 5.8% | +87.8% |
| Alibaba Cloud | 4.9% | +63.8% |
| Others | 40.1% | +23.3% |
It’s no surprise that U.S. companies dominate the cloud service market since the country currently has the largest share of global cloud storage worldwide. Yet, the concentration of cloud storage is predicted to even out in the next few years—by 2025, the U.S. portion of public cloud storage will drop from 51% to 31%, while China’s will increase from just 6% to 13%.
What’s Next for the Cloud?
The cloud has changed the way we use the internet. It has influenced the way we share information, our ability to work remotely, and how we store our data.
And these services are much needed, as our use of data and the internet continues to scale up. By 2025, an average internet user will have around 4,909 data interactions per day, an increase from 1,426 in the year 2020.
At the same time, the scale of global datasphere is expected to be five times bigger in 2025 than it was in 2018, growing from 33 zettabytes to 175 zettabytes. Each zettabyte, by the way, is equal to 1 trillion gigabytes.
With data taking an ever more important role in our lives, the cloud is becoming an indispensable part of business, technology, and society as a whole.


Technology
Visualizing AI Patents by Country
See which countries have been granted the most AI patents each year, from 2012 to 2022.


Visualizing AI Patents by Country
This was originally posted on our Voronoi app. Download the app for free on iOS or Android and discover incredible data-driven charts from a variety of trusted sources.
This infographic shows the number of AI-related patents granted each year from 2010 to 2022 (latest data available). These figures come from the Center for Security and Emerging Technology (CSET), accessed via Stanford University’s 2024 AI Index Report.
From this data, we can see that China first overtook the U.S. in 2013. Since then, the country has seen enormous growth in the number of AI patents granted each year.
| Year | China | EU and UK | U.S. | RoW | Global Total |
|---|---|---|---|---|---|
| 2010 | 307 | 137 | 984 | 571 | 1,999 |
| 2011 | 516 | 129 | 980 | 581 | 2,206 |
| 2012 | 926 | 112 | 950 | 660 | 2,648 |
| 2013 | 1,035 | 91 | 970 | 627 | 2,723 |
| 2014 | 1,278 | 97 | 1,078 | 667 | 3,120 |
| 2015 | 1,721 | 110 | 1,135 | 539 | 3,505 |
| 2016 | 1,621 | 128 | 1,298 | 714 | 3,761 |
| 2017 | 2,428 | 144 | 1,489 | 1,075 | 5,136 |
| 2018 | 4,741 | 155 | 1,674 | 1,574 | 8,144 |
| 2019 | 9,530 | 322 | 3,211 | 2,720 | 15,783 |
| 2020 | 13,071 | 406 | 5,441 | 4,455 | 23,373 |
| 2021 | 21,907 | 623 | 8,219 | 7,519 | 38,268 |
| 2022 | 35,315 | 1,173 | 12,077 | 13,699 | 62,264 |
In 2022, China was granted more patents than every other country combined.
While this suggests that the country is very active in researching the field of artificial intelligence, it doesn’t necessarily mean that China is the farthest in terms of capability.
Key Facts About AI Patents
According to CSET, AI patents relate to mathematical relationships and algorithms, which are considered abstract ideas under patent law. They can also have different meaning, depending on where they are filed.
In the U.S., AI patenting is concentrated amongst large companies including IBM, Microsoft, and Google. On the other hand, AI patenting in China is more distributed across government organizations, universities, and tech firms (e.g. Tencent).
In terms of focus area, China’s patents are typically related to computer vision, a field of AI that enables computers and systems to interpret visual data and inputs. Meanwhile America’s efforts are more evenly distributed across research fields.
Learn More About AI From Visual Capitalist
If you want to see more data visualizations on artificial intelligence, check out this graphic that shows which job departments will be impacted by AI the most.

-

 Mining1 week ago
Gold vs. S&P 500: Which Has Grown More Over Five Years?
-

 Markets2 weeks ago
Ranked: The Most Valuable Housing Markets in America
-

 Money2 weeks ago
Which States Have the Highest Minimum Wage in America?
-

 AI2 weeks ago
Ranked: Semiconductor Companies by Industry Revenue Share
-

 Markets2 weeks ago
Ranked: The World’s Top Flight Routes, by Revenue
-

 Countries2 weeks ago
Population Projections: The World’s 6 Largest Countries in 2075
-

 Markets2 weeks ago
The Top 10 States by Real GDP Growth in 2023
-

 Demographics2 weeks ago
The Smallest Gender Wage Gaps in OECD Countries