Technology
The Massive Impact of EVs on Commodities in One Chart
The Massive Impact of EVs on Commodities
How demand would change in a 100% EV world
The Chart of the Week is a weekly Visual Capitalist feature on Fridays.
What would happen if you flipped a switch, and suddenly every new car that came off assembly lines was electric?
It’s obviously a thought experiment, since right now EVs have close to just 1% market share worldwide. We’re still years away from EVs even hitting double-digit demand on a global basis, and the entire supply chain is built around the internal combustion engine, anyways.
At the same time, however, the scenario is interesting to consider. One recent projection, for example, put EVs at a 16% penetration by 2030 and then 51% by 2040. This could be conservative depending on the changing regulatory environment for manufacturers – after all, big markets like China, France, and the U.K. have recently announced that they plan on banning gas-powered vehicles in the near future.
The Thought Experiment
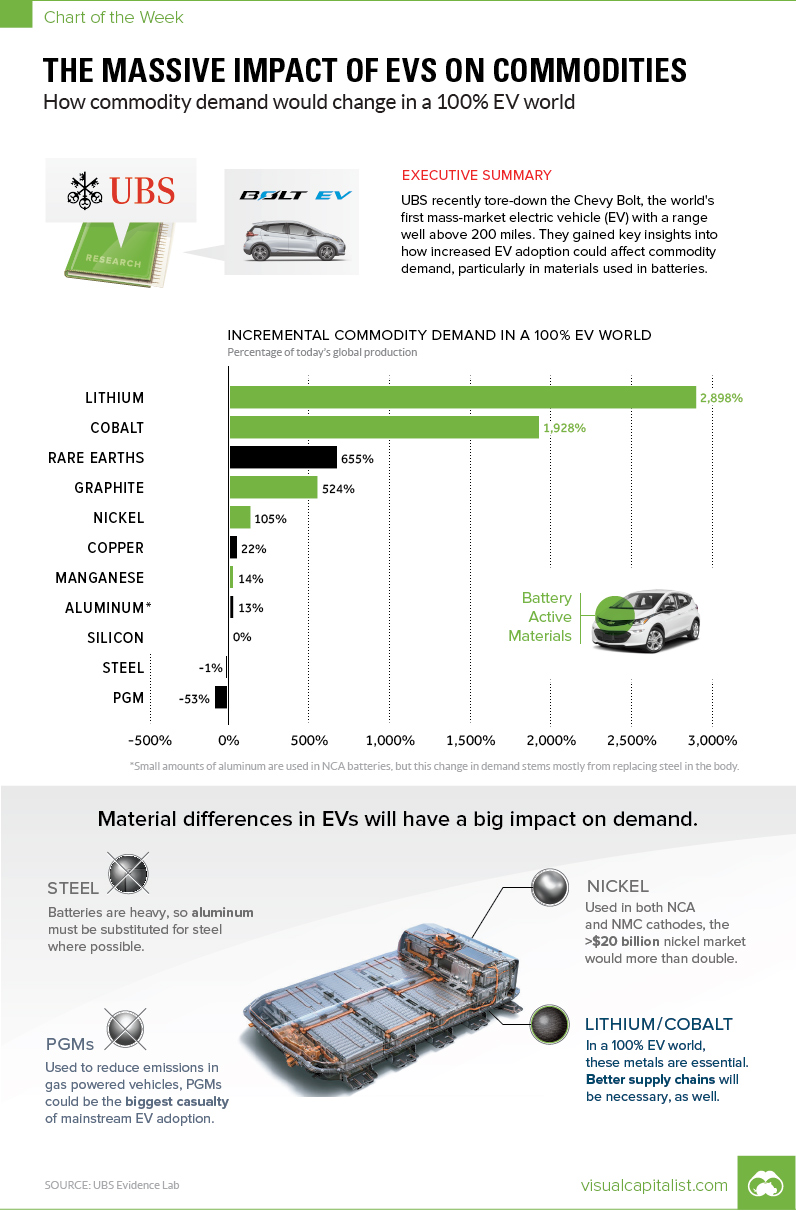
We discovered this “100% EV world” thought experiment in a UBS report that everyone should read. As a part of their UBS Evidence Lab initiative, they tore down a Chevy Bolt to see exactly what is inside, and then had 39 of the bank’s analysts weigh in on the results.
After breaking down the metals and other materials used in the vehicle, they noticed a considerable amount of variance from what gets used in a standard gas-powered car. It wasn’t just the battery pack that made a difference – it was also the body and the permanent-magnet synchronous motor that had big implications.
As a part of their analysis, they extrapolated the data for a potential scenario where 100% of the world’s auto demand came from Chevy Bolts, instead of the current auto mix.
The Implications
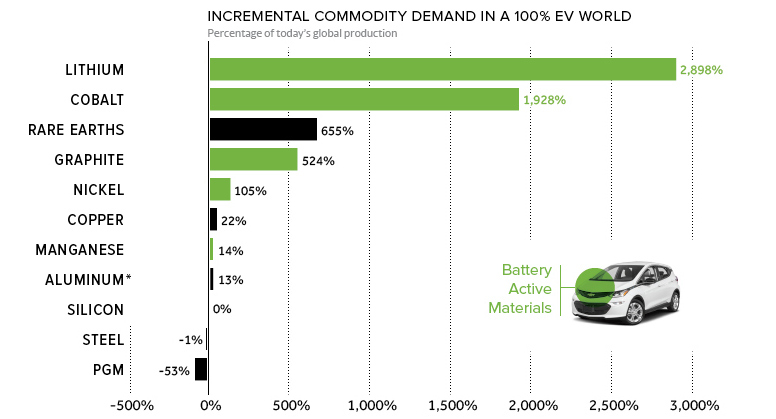
If global demand suddenly flipped in this fashion, here’s what would happen:
| Material | Demand increase | Notes |
|---|---|---|
| Lithium | 2,898% | Needed in all lithium-ion batteries |
| Cobalt | 1,928% | Used in the Bolt's NMC cathode |
| Rare Earths | 655% | Bolt uses neodymium in permanent magnet motor |
| Graphite | 524% | Used in the anode of lithium-ion batteries |
| Nickel | 105% | Used in the Bolt's NMC cathode |
| Copper | 22% | Used in permanent magnet motor and wiring |
| Manganese | 14% | Used in the Bolt's NMC cathode |
| Aluminum | 13% | Used to reduce weight of vehicle |
| Silicon | 0% | Bolt uses 6-10x more semiconductors |
| Steel | -1% | Uses 7% less steel, but fairly minimal impact on market |
| PGMs | -53% | Catalytic converters not needed in EVs |
Some caveats we think are worth noting:
The Bolt is not a Tesla
The Bolt uses an NMC cathode formulation (nickel, manganese, and cobalt in a 1:1:1 ratio), versus Tesla vehicles which use NCA cathodes (nickel, cobalt, and aluminum, in an estimated 16:3:1 ratio). Further, the Bolt uses an permanent-magnet synchronous motor, which is different from Tesla’s AC induction motor – the key difference there being rare earth usage.
Big Markets, small markets:
Lithium, cobalt, and graphite have tiny markets, and they will explode in size with any notable increase in EV demand. The nickel market, which is more than $20 billion per year, will also more than double in this scenario. It’s also worth noting that the Bolt uses low amounts of nickel in comparison to Tesla cathodes, which are 80% nickel.
Meanwhile, the 100% EV scenario barely impacts the steel market, which is monstrous to begin with. The same can be said for silicon, even though the Bolt uses 6-10x more semiconductors than a regular car. The market for PGMs like platinum and palladium, however, gets decimated in this hypothetical scenario – that’s because their use as catalysts in combustion engines are a primary source of demand.


Technology
Ranked: Semiconductor Companies by Industry Revenue Share
Nvidia is coming for Intel’s crown. Samsung is losing ground. AI is transforming the space. We break down revenue for semiconductor companies.


Semiconductor Companies by Industry Revenue Share
This was originally posted on our Voronoi app. Download the app for free on Apple or Android and discover incredible data-driven charts from a variety of trusted sources.
Did you know that some computer chips are now retailing for the price of a new BMW?
As computers invade nearly every sphere of life, so too have the chips that power them, raising the revenues of the businesses dedicated to designing them.
But how did various chipmakers measure against each other last year?
We rank the biggest semiconductor companies by their percentage share of the industry’s revenues in 2023, using data from Omdia research.
Which Chip Company Made the Most Money in 2023?
Market leader and industry-defining veteran Intel still holds the crown for the most revenue in the sector, crossing $50 billion in 2023, or 10% of the broader industry’s topline.
All is not well at Intel, however, with the company’s stock price down over 20% year-to-date after it revealed billion-dollar losses in its foundry business.
| Rank | Company | 2023 Revenue | % of Industry Revenue |
|---|---|---|---|
| 1 | Intel | $51B | 9.4% |
| 2 | NVIDIA | $49B | 9.0% |
| 3 | Samsung Electronics | $44B | 8.1% |
| 4 | Qualcomm | $31B | 5.7% |
| 5 | Broadcom | $28B | 5.2% |
| 6 | SK Hynix | $24B | 4.4% |
| 7 | AMD | $22B | 4.1% |
| 8 | Apple | $19B | 3.4% |
| 9 | Infineon Tech | $17B | 3.2% |
| 10 | STMicroelectronics | $17B | 3.2% |
| 11 | Texas Instruments | $17B | 3.1% |
| 12 | Micron Technology | $16B | 2.9% |
| 13 | MediaTek | $14B | 2.6% |
| 14 | NXP | $13B | 2.4% |
| 15 | Analog Devices | $12B | 2.2% |
| 16 | Renesas Electronics Corporation | $11B | 1.9% |
| 17 | Sony Semiconductor Solutions Corporation | $10B | 1.9% |
| 18 | Microchip Technology | $8B | 1.5% |
| 19 | Onsemi | $8B | 1.4% |
| 20 | KIOXIA Corporation | $7B | 1.3% |
| N/A | Others | $126B | 23.2% |
| N/A | Total | $545B | 100% |
Note: Figures are rounded. Totals and percentages may not sum to 100.
Meanwhile, Nvidia is very close to overtaking Intel, after declaring $49 billion of topline revenue for 2023. This is more than double its 2022 revenue ($21 billion), increasing its share of industry revenues to 9%.
Nvidia’s meteoric rise has gotten a huge thumbs-up from investors. It became a trillion dollar stock last year, and broke the single-day gain record for market capitalization this year.
Other chipmakers haven’t been as successful. Out of the top 20 semiconductor companies by revenue, 12 did not match their 2022 revenues, including big names like Intel, Samsung, and AMD.
The Many Different Types of Chipmakers
All of these companies may belong to the same industry, but they don’t focus on the same niche.
According to Investopedia, there are four major types of chips, depending on their functionality: microprocessors, memory chips, standard chips, and complex systems on a chip.
Nvidia’s core business was once GPUs for computers (graphics processing units), but in recent years this has drastically shifted towards microprocessors for analytics and AI.
These specialized chips seem to be where the majority of growth is occurring within the sector. For example, companies that are largely in the memory segment—Samsung, SK Hynix, and Micron Technology—saw peak revenues in the mid-2010s.

-

 Mining2 weeks ago
Charted: The Value Gap Between the Gold Price and Gold Miners
-

 Real Estate1 week ago
Ranked: The Most Valuable Housing Markets in America
-

 Business1 week ago
Charted: Big Four Market Share by S&P 500 Audits
-

 AI1 week ago
The Stock Performance of U.S. Chipmakers So Far in 2024
-

 Misc1 week ago
Almost Every EV Stock is Down After Q1 2024
-

 Money2 weeks ago
Where Does One U.S. Tax Dollar Go?
-

 Green2 weeks ago
Ranked: Top Countries by Total Forest Loss Since 2001
-

 Markets2 weeks ago
Visualizing America’s Shortage of Affordable Homes