Economy
Mapping The Biggest Companies By Market Cap in 60 Countries
View the full-size version of this infographic
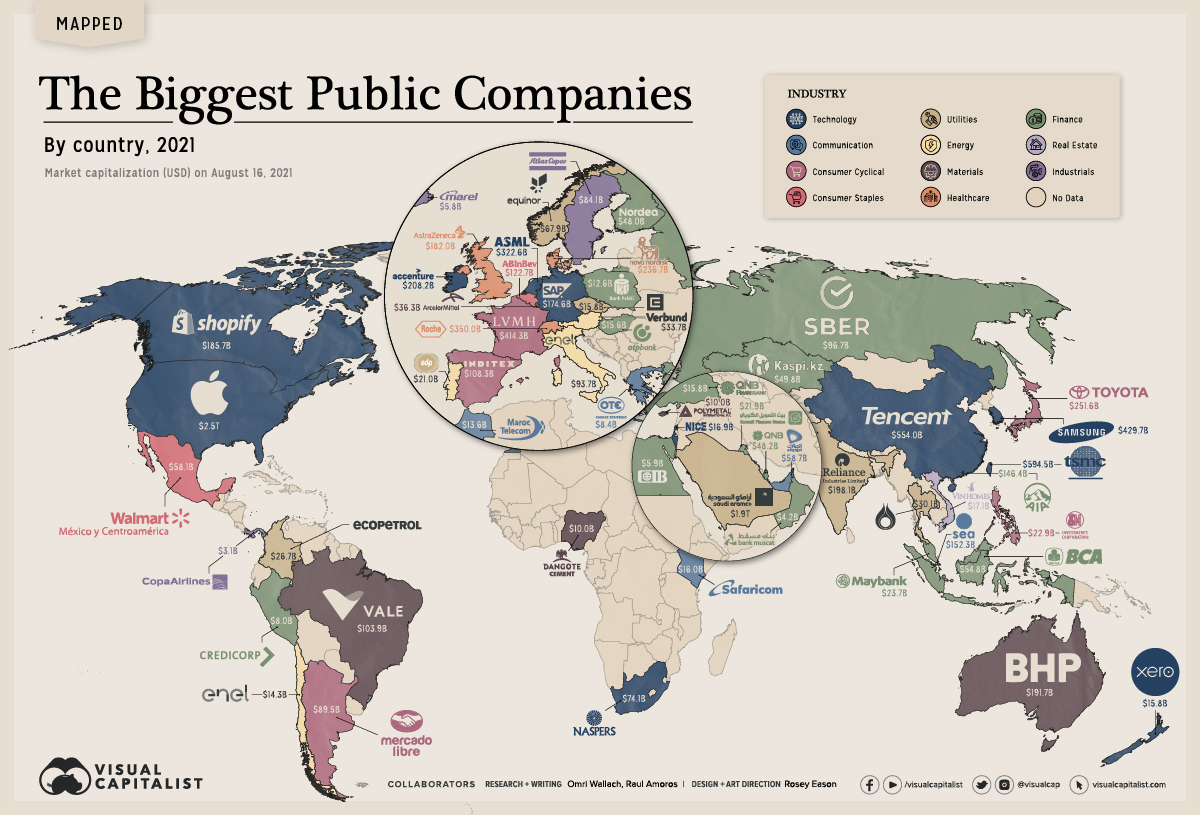


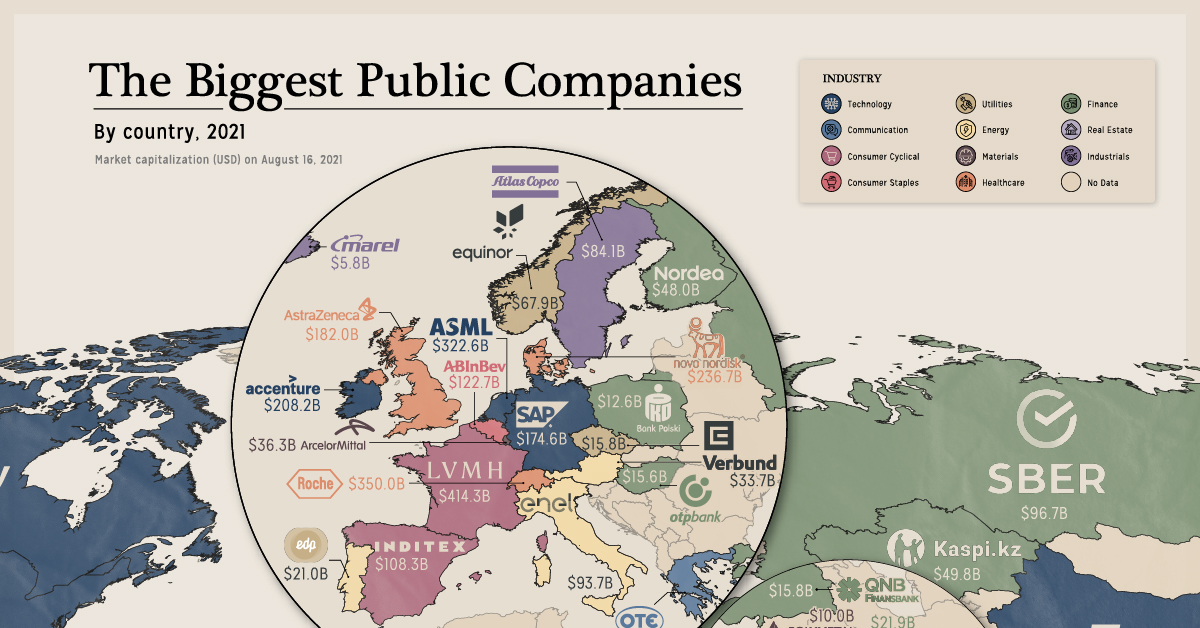
The Biggest Companies By Market Cap in 60 Countries
Tech giants are increasingly making up more of the Fortune 500, but the world’s biggest companies by market cap aren’t so cut and dry.
Despite accounting for the largest market caps worldwide—with trillion-dollar companies like Apple and contenders including Tencent and Samsung—tech wealth is largely concentrated in just a handful of countries.
So what are the biggest companies in each country? We mapped the largest company by market cap across 60 countries in August 2021 using market data from CompaniesMarketCap, TradingView, and MarketScreener.
What are the Largest Companies in the World?
The world has 60+ stock exchanges, and each one has a top company. We looked at the largest local company, since many of the world’s largest firms trade on multiple exchanges, and converted market cap to USD.
| Country | Company | Industry | Market Cap (August 2021) |
|---|---|---|---|
| USA | Apple | Technology | $2.5T |
| Saudi Arabia | Saudi Aramco | Energy | $1.9T |
| Taiwan | TSMC | Technology | $594.5B |
| China | Tencent | Technology | $554.0B |
| South Korea | Samsung | Technology | $429.7B |
| France | LVMH | Consumer Cyclical | $414.3B |
| Switzerland | Roche | Healthcare | $350.0B |
| Netherlands | ASML | Technology | $322.6B |
| Japan | Toyota | Consumer Cyclical | $251.6B |
| Denmark | Novo Nordisk | Healthcare | $236.7B |
| Ireland | Accenture | Technology | $208.2B |
| India | Reliance Industries | Energy | $198.1B |
| Australia | BHP Group | Materials | $191.7B |
| Canada | Shopify | Technology | $185.7B |
| UK | Astrazeneca | Healthcare | $182.0B |
| Germany | SAP | Technology | $174.6B |
| Singapore | SEA | Technology | $152.3B |
| Hong Kong | AIA | Financials | $146.4B |
| Belgium | Anheuser-Busch Inbev | Consumer Staples | $122.7B |
| Spain | Inditex | Consumer Cyclical | $108.3B |
| Brazil | VALE | Materials | $103.9B |
| Russia | Sberbank | Financials | $96.7B |
| Italy | Enel | Utilities | $93.7B |
| Argentina | MercadoLibre | Consumer Cyclical | $89.5B |
| Sweden | Atlas Copco | Industrials | $84.1B |
| South Africa | Naspers | Technology | $74.1B |
| Norway | Equinor | Energy | $67.9B |
| UAE | Etisalat | Communication | $58.7B |
| Mexico | Walmex | Consumer Staples | $58.1B |
| Indonesia | Bank Cental Asia | Financials | $54.8B |
| Kazakhstan | Kaspi.kz | Financials | $49.8B |
| Qatar | QNB | Financials | $48.2B |
| Finland | Nordea Bank | Financials | $48.0B |
| Luxembourg | ArcelorMittal | Materials | $36.3B |
| Austria | Verbund | Utilities | $33.7B |
| Thailand | PTT PCL | Energy | $30.1B |
| Colombia | Ecopetrol | Energy | $26.7B |
| Malaysia | Maybank | Financials | $23.7B |
| Philippines | SM Investments | Consumer Cyclical | $22.9B |
| Kuwait | Kuwait Finance House | Financials | $21.9B |
| Portugal | EDP Group | Utilities | $21.0B |
| Vietnam | Vinhomes | Real Estate | $17.1B |
| Israel | NICE | Technology | $16.9B |
| Kenya | Safaricom | Communication | $16.0B |
| Czech Republic | ÄŒEZ Group | Energy | $15.8B |
| New Zealand | Xero | Technology | $15.8B |
| Turkey | QNB Finansbank | Financials | $15.8B |
| Hungary | OTP Bank | Financials | $15.6B |
| Chile | Enel Americas | Utilities | $14.3B |
| Morocco | Maroc Telecom | Communication | $13.6B |
| Poland | PKO Bank Polski | Financials | $12.6B |
| Cyprus | Polymetal | Materials | $10.0B |
| Nigeria | Dangote Group | Materials | $10.0B |
| Bahrain | Ahli United Bank | Financials | $8.6B |
| Greece | OTE Group | Communication | $8.4B |
| Peru | Credicorp | Financials | $8.0B |
| Egypt | Commercial International Bank | Financials | $5.9B |
| Iceland | Marel | Industrials | $5.8B |
| Oman | Bank Muscat | Financials | $4.2B |
| Panama | Copa Holdings | Industrials | $3.1B |
Many are former monopolies or massive conglomerates that have grown in the public space, such as South Africa’s Naspers and India’s Reliance Industries.
Others are local subsidiaries of foreign corporations, including Mexico’s Walmex, Chile’s Enel and Turkey’s QNB Finansbank.
But even more noticeable is the economic discrepancy. Apple and Saudi Aramco are worth trillions of dollars, while the smallest companies we tracked—including Panama’s Copa Group and Oman’s Bank Muscat—are worth less than $5 billion.
Finance and Tech Dominate The Biggest Companies By Market Cap
Across the board, the largest companies were able to accumulate wealth and value.
Some are newer to the top thanks to recent success. Canada’s Shopify has become one of the world’s largest e-commerce providers, and the UK’s AstraZeneca developed one of the world’s COVID-19 vaccines.
But the reality is most companies here are old guards that grew on existing resources, or in the case of banks, accumulated wealth.
| Industry | Biggest Companies by Country |
|---|---|
| Financials | 16 |
| Technology | 12 |
| Energy | 6 |
| Materials | 5 |
| Communication | 4 |
| Consumer Cyclical | 4 |
| Utilities | 4 |
| Healthcare | 3 |
| Industrials | 3 |
| Consumer Staples | 2 |
| Real Estate | 1 |
Banks were the most commonly found at the top of each country’s stock market. Closely behind were oil and gas giants, mining companies, and former state-owned corporations that drove most of a country’s wealth generation.
But as more economies develop and catch up to Western economies (where tech is dominant), newer innovative companies will likely put up a fight for each country’s top company crown.


Copper
Brass Rods: The Secure Choice
This graphic shows why brass rods are the secure choice for precision-machined and forged parts.


Brass Rods: The Secure Choice
The unique combination of machinability and recyclability makes brass rods the secure choice for manufacturers seeking future-proof raw material solutions.
This infographic, from the Copper Development Association, shows three ways brass rods give manufacturers greater control and a license to grow in the competitive market for precision-machined and forged products.
Future-Proof Investments in New Machine Tools
A material’s machinability directly impacts machine throughput, which typically has the largest impact on machine shop profitability.
The high-speed machining capabilities of brass rods maximize machine tool performance, allowing manufacturers to run the material faster and longer without sacrificing tool life, chip formation, or surface quality.
The high machining efficiency of brass leads to reduced per-part costs, quicker return on investment (ROI) for new machine tools, and expanded production capacity for new projects.
Supply Security Through Closed Loop Recycling
Brass, like its parent element copper, can be infinitely recycled.
In 2022, brass- and wire-rod mills accounted for the majority of the 830,000 tonnes of copper recycled from scrap in the United States.
Given that scrap ratios for machined parts typically range from 60-70% by weight, producing mills benefit from a secure and steady supply of clean scrap returned directly from customers, which is recycled to create new brass rods.
The high residual value of brass scrap creates a strong recycling incentive. Scrap buy back programs give manufacturers greater control over raw material net costs as scrap value is often factored into supplier purchase agreements.
Next Generation Alloys for a Lead-Free Future
Increasingly stringent global regulations continue to pressure manufacturers to minimize the use of materials containing trace amounts of lead and other harmful impurities.
The latest generation of brass-rod alloys is engineered to meet the most demanding criteria for lead leaching in drinking water and other sensitive applications.
Seven brass-rod alloys passed rigorous testing to become the only ‘Acceptable Materials’ against lower lead leaching criteria recently adopted in the national U.S. drinking water quality standard, NSF 61.
Learn more about the advantages of brass rods solutions.

-

 Base Metals1 year ago
Ranked: The World’s Largest Copper Producers
Many new technologies critical to the energy transition rely on copper. Here are the world’s largest copper producers.
-

 Silver2 years ago
Mapped: Solar Power by Country in 2021
In 2020, solar power saw its largest-ever annual capacity expansion at 127 gigawatts. Here’s a snapshot of solar power capacity by country.
-

 Batteries5 years ago
Visualizing Copper’s Role in the Transition to Clean Energy
A clean energy transition is underway as wind, solar, and batteries take center stage. Here’s how copper plays the critical role in these technologies.
-

 Science5 years ago
Everything You Need to Know on VMS Deposits
Deep below the ocean’s waves, VMS deposits spew out massive amounts of minerals like copper, zinc, and gold, making them a key source of the metals…
-
 Copper5 years ago
How Much Copper is in an Electric Vehicle?
Have you ever wondered how much copper is in an electric vehicle? This infographic shows the metal’s properties as well as the quantity of copper used.
-
 Copper6 years ago
Copper: Driving the Green Energy Revolution
Renewable energy is set to fuel a new era of copper demand – here’s how much copper is used in green applications from EVs to photovoltaics.


-

 Real Estate2 weeks ago
Visualizing America’s Shortage of Affordable Homes
-

 Technology1 week ago
Ranked: Semiconductor Companies by Industry Revenue Share
-

 Money1 week ago
Which States Have the Highest Minimum Wage in America?
-

 Real Estate1 week ago
Ranked: The Most Valuable Housing Markets in America
-

 Business2 weeks ago
Charted: Big Four Market Share by S&P 500 Audits
-

 AI2 weeks ago
The Stock Performance of U.S. Chipmakers So Far in 2024
-

 Misc2 weeks ago
Almost Every EV Stock is Down After Q1 2024
-

 Money2 weeks ago
Where Does One U.S. Tax Dollar Go?