Markets
Mapped: The World’s Least Affordable Housing Markets in 2024
![]() See this visualization first on the Voronoi app.
See this visualization first on the Voronoi app.
The World’s Least Affordable Housing Markets in 2024
This was originally posted on our Voronoi app. Download the app for free on iOS or Android and discover incredible data-driven charts from a variety of trusted sources.
Many cities around the world have become very expensive to buy a home in, but which ones are the absolute most unattainable?
In this graphic, we highlight a number of housing markets that are deemed to be “impossibly unaffordable” in 2024, ranked by their median price-to-income ratio.
This data comes from the Demographia International Housing Affordability Report, which is produced by the Chapman University Center for Demographics and Policy.
Data and Key Takeaway
The median price-to-income ratio compares median house price to median household income within each market. A higher ratio (higher prices relative to incomes) means a city is less affordable.
See the following table for all of the data we used to create this graphic. Note that this analysis covers 94 markets across eight countries: Australia, Canada, China, Ireland, New Zealand, Singapore, the United Kingdom, and the United States.
| Rank | Metropolitan Market | Country | Median price-to-income ratio |
|---|---|---|---|
| 1 | Hong Kong (SAR) | 🇨🇳 China | 16.7 |
| 2 | Sydney | 🇦🇺 Australia | 13.8 |
| 3 | Vancouver | 🇨🇦 Canada | 12.3 |
| 4 | San Jose | 🇺🇸 U.S. | 11.9 |
| 5 | Los Angeles | 🇺🇸 U.S. | 10.9 |
| 6 | Honolulu | 🇺🇸 U.S. | 10.5 |
| 7 | Melbourne | 🇦🇺 Australia | 9.8 |
| 8 | San Francisco | 🇺🇸 U.S. | 9.7 |
| 9 | Adelaide | 🇦🇺 Australia | 9.7 |
| 10 | San Diego | 🇺🇸 U.S. | 9.5 |
| 11 | Toronto | 🇨🇦 Canada | 9.3 |
| 12 | Auckland | 🇳🇿 New Zealand | 8.2 |
According to the Demographia report, cities with a median price-to-income ratio of over 9.0 are considered “impossibly unaffordable”.
We can see that the top city in this ranking, Hong Kong, has a ratio of 16.7. This means that the median price of a home is 16.7 times greater than the median income.
Which Cities are More Affordable?
On the flipside, here are the top 12 most affordable cities that were analyzed in the Demographia report.
| Rank | Metropolitan Market | Country | Median price-to-income ratio |
|---|---|---|---|
| 1 | Pittsburgh | 🇺🇸 U.S. | 3.1 |
| 2 | Rochester | 🇺🇸 U.S. | 3.4 |
| 2 | St. Louis | 🇺🇸 U.S. | 3.4 |
| 4 | Cleveland | 🇺🇸 U.S. | 3.5 |
| 5 | Edmonton | 🇨🇦 Canada | 3.6 |
| 5 | Buffalo | 🇺🇸 U.S. | 3.6 |
| 5 | Detroit | 🇺🇸 U.S. | 3.6 |
| 5 | Oklahoma City | 🇺🇸 U.S. | 3.6 |
| 9 | Cincinnati | 🇺🇸 U.S. | 3.7 |
| 9 | Louisville | 🇺🇸 U.S. | 3.7 |
| 11 | Singapore | 🇸🇬 Singapore | 3.8 |
| 12 | Blackpool & Lancashire | 🇬🇧 U.K. | 3.9 |
Cities with a median price-to-income ratio of less than 3.0 are considered “affordable”, while those between 3.1 and 4.0 are considered “moderately unaffordable”.
See More Real Estate Content From Visual Capitalist
If you enjoyed this post, be sure to check out Ranked: The Most Valuable Housing Markets in America.
Markets
The Top 10 Highest Paid CEOs in America
As median S&P 500 executive compensation hits record levels, we show the highest paid CEOs in America in 2023.
The Top 10 Highest Paid CEOs in America
This was originally posted on our Voronoi app. Download the app for free on iOS or Android and discover incredible data-driven charts from a variety of trusted sources.
The median pay for S&P 500 CEOs soared to an all-time high of $15.7 million in 2023, as a strong stock market boosted executive compensation.
Some of the highest paid CEOs in America earned nine-figure pay packages, with the vast majority of CEO compensation tied to stock awards. Overall, executives in the index earned on average 196 times more than the median S&P 500 employee, up from 185 in 2022.
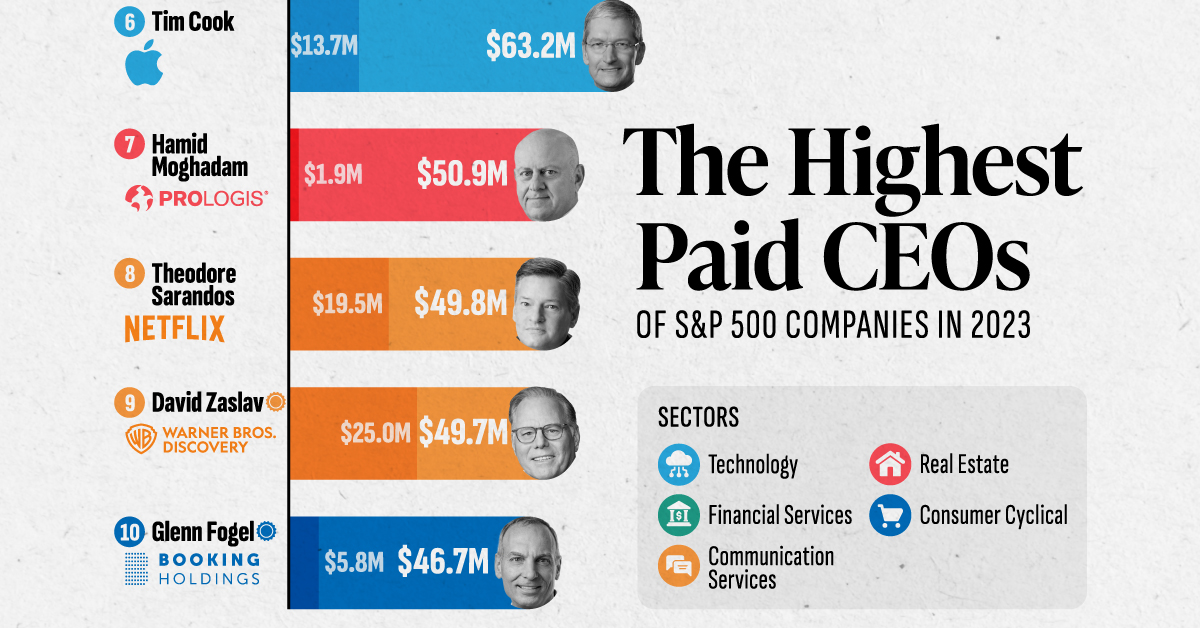
This graphic shows the top 10 highest paid CEOs of S&P 500 companies, based on analysis from The Wall Street Journal and MyLogIQ.
The Highest-Earning S&P 500 CEOs in 2023
Here are the S&P 500 chief executives who received the highest compensation packages last year:
| Rank | CEO | Company | Total Pay | Cash Pay | Sector |
|---|---|---|---|---|---|
| 1 | Hock Tan | Broadcom | $161.8M | $1.2M | Technology |
| 2 | Nikesh Arora | Palo Alto Networks | $151.4M | $2.3M | Technology |
| 3 | Stephen Schwarzman | Blackstone | $119.8M | $0.4M | Financial Services |
| 4 | Christopher Winfrey | Charter Communications | $89.1M | $5.2M | Communication Services |
| 5 | Will Lansing | Fair Isaac | $66.4M | $2.0M | Technology |
| 6 | Tim Cook | Apple | $63.2M | $13.7M | Technology |
| 7 | Hamid Moghadam | Prologis | $50.9M | $1.9M | Real Estate |
| 8 | Theodore Sarandos | Netflix | $49.8M | $19.5M | Communication Services |
| 9 | David Zaslav | Warner Bros. Discovery | $49.7M | $25.0M | Communication Services |
| 10 | Glenn Fogel | Booking Holdings | $46.7M | $5.8M | Consumer Cyclical |
Total pay includes equity awards and cash pay.
Hock Tan, CEO of chipmaker Broadcom, tops the list, with an annual compensation of $161.8 million in 2023.
Like Nvidia, the company has benefited from surging demand for AI technologies. Broadcom supplies the networking chips used in data centers for big tech companies, including Microsoft. Between 2022 and 2023, Tan’s salary doubled, earning 510 times the median pay of employees.
Ranking in third is Stephen Schwarzman, who runs the biggest private equity firm in the world, Blackstone. The executive’s $119.8 million pay package was bolstered by a 83% rise in its share price last year. The firm is the world’s largest owner of commercial property, with approximately 12,500 real estate assets overall.
Meanwhile, Apple CEO Tim Cook received $63.2 million in 2023—a sharp decline from the $99.4 million earned in the prior year. This rare pay cut was the result of shareholder pushback and requests from Cook himself.
Overall, four of the top 10 highest paid CEOs in America are in the tech sector, with each experiencing double-digit share price gains over 2023.
CEO Pay Has Doubled Over the Last Decade
Below, we show the increasing magnitude of executive earnings since 2013:
| Year | Median Total Compensation for CEOs of S&P 500 Companies |
|---|---|
| 2023 | $15.7M |
| 2022 | $14.5M |
| 2021 | $14.8M |
| 2020 | $13.2M |
| 2019 | $12.2M |
| 2018 | $11.7M |
| 2017 | $10.6M |
| 2016 | $10.0M |
| 2015 | $9.9M |
| 2014 | $9.0M |
| 2013 | $7.4M |
Total pay includes equity awards and cash pay.
As we can see, the median total compensation of S&P 500 CEOs jumped over 8% between 2022 and 2023.
Going further, this figure has grown by twofold over the last 10 years as the U.S. stock market surged during a period of low interest rates. Overall, CEO pay is rising faster than median employee pay and this gap between CEOs and workers has continued to widen over many years. For perspective, the median pay of S&P 500 employees stood at $81,476 in 2023.
Often, CEO compensation is linked to the company’s financial performance, which is measured through share price movements and dividend payouts. In addition, the rise in CEO pay can be largely driven by stock awards granted to CEOs.
A separate analysis from Equilar found that on average, 70% of S&P 500 CEO compensation stemmed from stock awards, averaging a striking $9.4 million in 2023.
-
 Maps2 weeks ago
Mapped: Highest and Lowest Doctor Density Around the World
-

 Energy1 week ago
Visualizing Saudi Aramco’s Massive Oil Reserves
-

 Markets1 week ago
GDP Per Capita, by G7 Country (2019-2029F)
-

 Sports1 week ago
A Look at Cristiano Ronaldo’s Euro Records
-

 Misc1 week ago
Chart: Which Countries Eat the Most Instant Noodles?
-

 Misc1 week ago
Ranked: The 10 Highest-Grossing Concert Tours of All Time
-

 Demographics1 week ago
Charted: Unauthorized Immigrants in the U.S., by Country of Origin
-

 Misc1 week ago
Ranked: The Top 10 U.S. Pizza Chains by Market Share


