Maps
Mapped: Highest and Lowest Doctor Density Around the World
![]() See this visualization first on the Voronoi app.
See this visualization first on the Voronoi app.

Mapped: Highest and Lowest Doctor Density Around the World
This was originally posted on our Voronoi app. Download the app for free on iOS or Android and discover incredible data-driven charts from a variety of trusted sources.
This graphic maps and ranks the countries with the highest and lowest doctor density (measured per 10,000 population), according to World Health Organization (WHO) estimates as of 2022.
Health worker density in general is an important metric tracked by the UN, as part of its sustainable development goals. A 2016 WHO study found that investing and expanding healthcare workforces improves economic growth.
Ranked: Doctors Per 10,000 Population
European countries, like Belgium, Georgia, and Austria, lead the ranks by the ratio of doctors to resident population. South American countries, represented by Uruguay and Argentina, also make the top 10.
| Rank | Country | Doctors per 10K People (2022) |
|---|---|---|
| 1 | 🇧🇪 Belgium | 63.9 |
| 2 | 🇬🇪 Georgia | 56.1 |
| 3 | 🇦🇹 Austria | 55.1 |
| 4 | 🇱🇹 Lithuania | 51.3 |
| 5 | 🇧🇬 Bulgaria | 49.0 |
| 6 | 🇺🇾 Uruguay | 46.3 |
| 7 | 🇮🇸 Iceland | 45.2 |
| 8 | 🇨🇻 Cabo Verde | 44.6 |
| 9 | 🇮🇹 Italy | 42.5 |
| 10 | 🇦🇷 Argentina | 40.8 |
| 11 | 🇵🇾 Paraguay | 38.8 |
| 12 | 🇸🇨 Seychelles | 38.2 |
| 13 | 🇮🇱 Israel | 37.1 |
| 14 | 🇳🇿 New Zealand | 35.7 |
| 15 | 🇨🇱 Chile | 31.7 |
| 16 | 🇬🇧 UK | 31.7 |
| 17 | 🇸🇦 Saudi Arabia | 30.8 |
| 18 | 🇧🇧 Barbados | 29.7 |
| 19 | 🇲🇪 Montenegro | 27.5 |
| 20 | 🇨🇷 Costa Rica | 26.4 |
| 21 | 🇨🇦 Canada | 25.0 |
| 22 | 🇩🇴 Dominican Republic | 22.3 |
| 23 | 🇴🇲 Oman | 20.6 |
| 24 | 🇵🇪 Peru | 16.2 |
| 25 | 🇸🇿 Eswatini | 15.9 |
| 26 | 🇸🇻 El Salvador | 15.5 |
| 27 | 🇲🇺 Mauritius | 12.0 |
| 28 | 🇮🇶 Iraq | 10.1 |
| 29 | 🇮🇩 Indonesia | 6.9 |
| 30 | 🇧🇹 Bhutan | 5.5 |
| 31 | 🇳🇦 Namibia | 5.4 |
| 32 | 🇬🇦 Gabon | 4.8 |
| 33 | 🇳🇬 Nigeria | 3.9 |
| 34 | 🇧🇼 Botswana | 3.8 |
| 35 | 🇿🇲 Zambia | 2.6 |
| 36 | 🇦🇴 Angola | 2.4 |
| 37 | 🇲🇷 Mauritania | 2.4 |
| 38 | 🇬🇼 Guinea-Bissau | 2.1 |
| 39 | 🇧🇯 Benin | 2.0 |
| 40 | 🇨🇩 DRC | 1.9 |
| 41 | 🇲🇱 Mali | 1.9 |
| 42 | 🇨🇮 Côte d'Ivoire | 1.8 |
| 43 | 🇱🇷 Liberia | 1.8 |
| 44 | 🇨🇬 Congo | 1.7 |
| 45 | 🇺🇬 Uganda | 1.7 |
| 46 | 🇿🇼 Zimbabwe | 1.7 |
| 47 | 🇧🇫 Burkina Faso | 1.5 |
| 48 | 🇱🇸 Lesotho | 1.5 |
| 49 | 🇬🇶 Equatorial Guinea | 1.4 |
| 50 | 🇬🇭 Ghana | 1.4 |
| 51 | 🇨🇲 Cameroon | 1.3 |
| 52 | 🇸🇳 Senegal | 1.3 |
| 53 | 🇹🇿 Tanzania | 1.3 |
| 54 | 🇪🇹 Ethiopia | 1.1 |
| 55 | 🇰🇪 Kenya | 1.0 |
| 56 | 🇹🇩 Chad | 0.9 |
| 57 | 🇲🇿 Mozambique | 0.8 |
| 58 | 🇹🇬 Togo | 0.8 |
| 59 | 🇪🇷 Eritrea | 0.7 |
| 60 | 🇲🇼 Malawi | 0.5 |
| 61 | 🇸🇱 Sierra Leone | 0.4 |
| 62 | 🇬🇳 Guinea | 0.2 |
| 63 | 🇳🇪 Niger | 0.2 |
| N/A | 🌍 World | 17.2 |
Note: Countries with 2022 data only.
Meanwhile, eight African countries have fewer than 1 doctor per 10,000 population. According to the Africa Report, medical students from the continent move abroad to complete their education, but often don’t return.
However, Cabo Verde, a small nation of 10 islands off the coast of Africa is a big regional outlier with 44.6 doctors per 10,000 population. The country has made strides in expanding healthcare services since it gained independence in 1975. In the same time, life expectancy increased from 56 to 75, and the infant mortality rate dropped from 108 to 15 deaths per 1,000 births.
A Look at the G7 Countries
Finally, here’s a quick summary at how the G7 countries do in doctor density, as per the latest estimates from the World Health Organization.
Germany and Italy lead with 42–45 doctors per 10,000 people. The U.S., UK, and France are between 31–32 per 10,000 population. Japan and Canada are significantly lower at 25–26 for 10,000 residents.


Maps
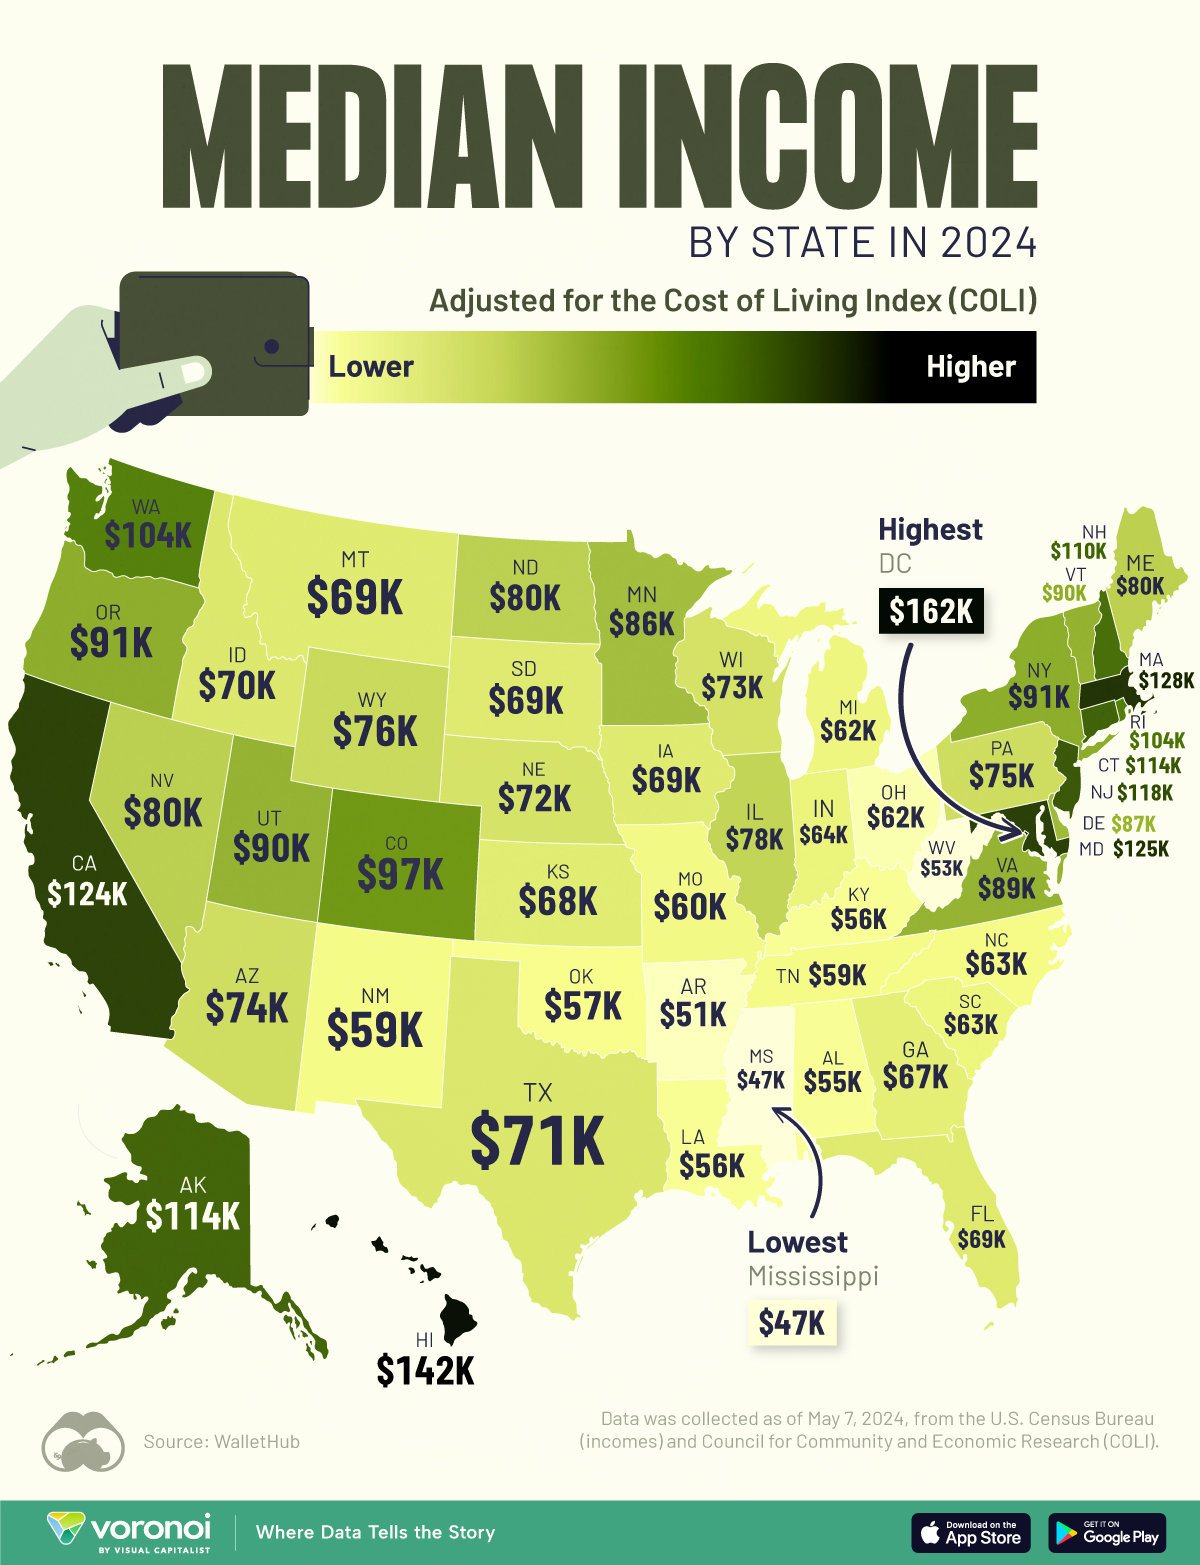
Mapped: Median Income by State in 2024
This graphic shows median income by state in 2024, adjusted for cost of living. Can you guess where it’s the highest?
Median Income by State in 2024, Adjusted for Cost of Living
This was originally posted on our Voronoi app. Download the app for free on iOS or Android and discover incredible data-driven charts from a variety of trusted sources.
To gain insight into the U.S. economy, we’ve visualized the median income by state, as of May 2024. These figures come from WalletHub, which sourced income data from the U.S. Census Bureau and adjusted it for cost of living according to the Cost of Living Index (COLI).
Data and Key Takeaways
All of the numbers we used to create this graphic are listed in the table below.
| Rank | State | Median Annual Income (adjusted for cost of living) |
|---|---|---|
| 1 | DC | $162,265 |
| 2 | Hawaii | $141,832 |
| 3 | Massachusetts | $127,760 |
| 4 | Maryland | $124,693 |
| 5 | California | $123,988 |
| 6 | New Jersey | $117,847 |
| 7 | Connecticut | $114,156 |
| 8 | Alaska | $113,934 |
| 9 | New Hampshire | $110,205 |
| 10 | Rhode Island | $104,252 |
| 11 | Washington | $103,748 |
| 12 | Colorado | $97,301 |
| 13 | New York | $91,366 |
| 14 | Oregon | $91,100 |
| 15 | Utah | $89,786 |
| 16 | Vermont | $89,695 |
| 17 | Virginia | $89,393 |
| 18 | Delaware | $87,173 |
| 19 | Minnesota | $86,364 |
| 20 | Nevada | $80,366 |
| 21 | North Dakota | $79,874 |
| 22 | Maine | $79,800 |
| 23 | Illinois | $78,304 |
| 24 | Wyoming | $76,307 |
| 25 | Pennsylvania | $74,711 |
| 26 | Arizona | $74,375 |
| 27 | Wisconsin | $72,602 |
| 28 | Nebraska | $72,384 |
| 29 | Texas | $70,513 |
| 30 | Idaho | $70,041 |
| 31 | South Dakota | $69,266 |
| 32 | Iowa | $68,974 |
| 33 | Montana | $68,937 |
| 34 | Florida | $68,818 |
| 35 | Kansas | $68,489 |
| 36 | Georgia | $66,612 |
| 37 | Indiana | $64,170 |
| 38 | North Carolina | $63,025 |
| 39 | South Carolina | $62,909 |
| 40 | Michigan | $62,446 |
| 41 | Ohio | $61,904 |
| 42 | Missouri | $59,715 |
| 43 | Tennessee | $59,077 |
| 44 | New Mexico | $58,911 |
| 45 | Oklahoma | $57,215 |
| 46 | Louisiana | $56,282 |
| 47 | Kentucky | $55,629 |
| 48 | Alabama | $55,480 |
| 49 | West Virginia | $52,719 |
| 50 | Arkansas | $51,032 |
| 51 | Mississippi | $46,880 |
The Cost of Living Index, published by the Council for Community and Economic Research (C2ER), was established in 1968, and allows for consistent place-to-place cost comparisons.
The index considers six categories of spending: groceries, housing, utilities, transportation, health care, and miscellaneous.
After adjusting for COLI, the top three states by median income are the District of Columbia (DC) (technically a district), Hawaii, and Massachusetts.
In DC, federal government agencies are the biggest employers. Many of them offer high-paying jobs that require higher education and specialized skills. DC, like Hawaii, also has a relatively higher cost of living, which may push up the average salary.
In the case of Massachusetts, the state is home to many of the world’s most prestigious universities and research institutions, as well as high-earning sectors like healthcare and tech.
See More U.S. Maps From Visual Capitalist
If you enjoyed this post, be sure to check out Mapped: The Income Needed to Live Comfortably in Every U.S. State

-

 Misc1 week ago
Where Unemployment Benefits are the Highest, in OECD Countries
-

 Money1 week ago
Ranked: The World’s Top 10 Billionaires in 2024
-

 Stocks1 week ago
All of the World’s Trillion-Dollar Companies in One Chart
-

 Markets1 week ago
The Growth of $100 Invested in Jim Simons’ Medallion Fund
-

 Stocks1 week ago
Charted: Four Decades of U.S. Tech IPOs
-

 Retail1 week ago
Ranked: The 20 Top Retailers Worldwide, by Revenue
-

 Sports1 week ago
Ranked: Which NBA Team Takes Home the Most Revenue?
-

 Markets1 week ago
Charted: Stock Buybacks by the Magnificent Seven