Money
Visualizing the Wealth of Nations
Visualizing the Wealth of Nations
Just as there exists a longstanding inequality in the distribution of household wealth, so exists a considerable differential in the amount of wealth held by countries on the international stage.
Simply put, some nations are “haves”, while many others are “have-nots”.
“Wherever there is great property, there is great inequality.”
– Adam Smith, The Wealth of Nations
Ranking Riches
We previously showed you how the ranking of the richest countries in the world has changed over the course of the last 10 years (2008-2018).
Today’s chart keys on a slightly different question.
What are the wealthiest nations today, both in absolute and per capita terms, and how is this list projected to change over the next decade? Let’s see how the wealth of nations stack up.
Private Wealth: Now and in the Future
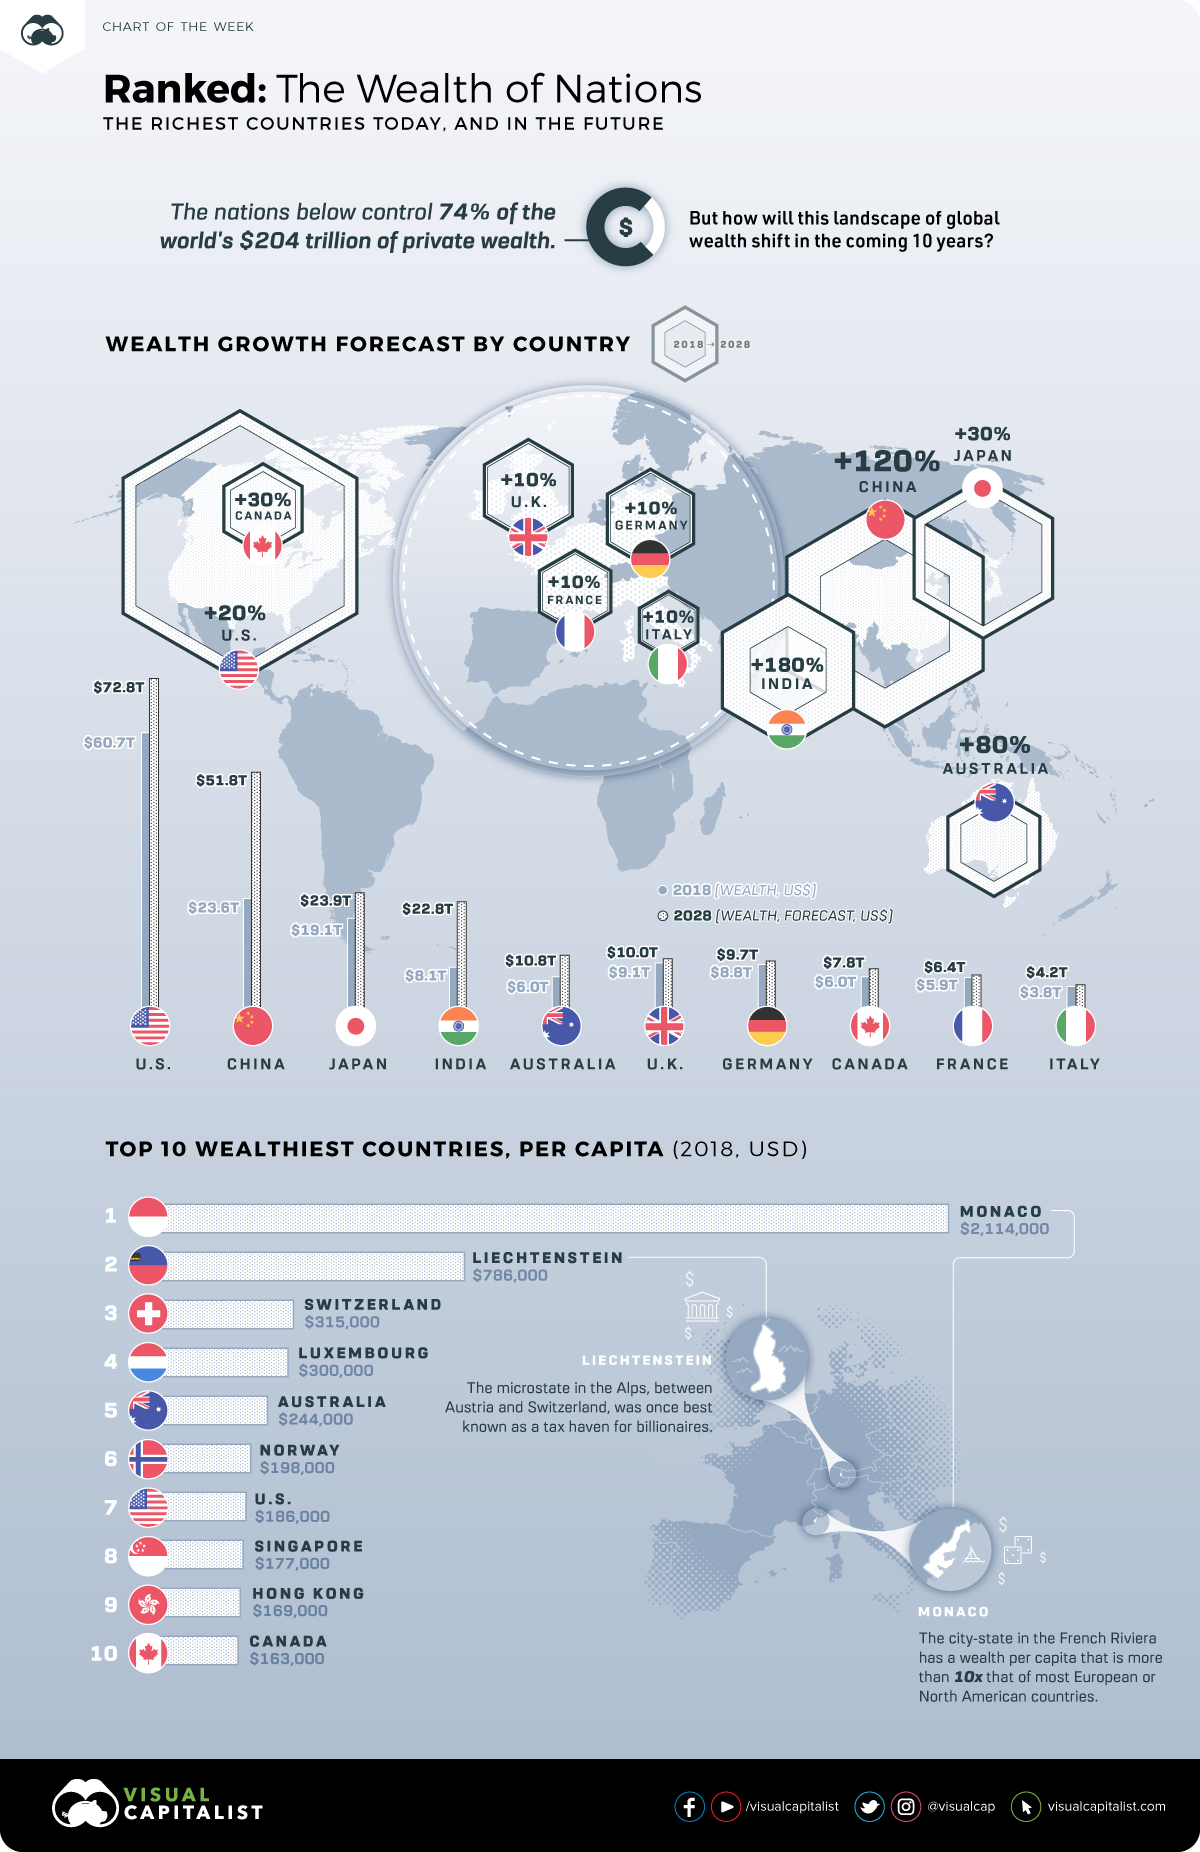
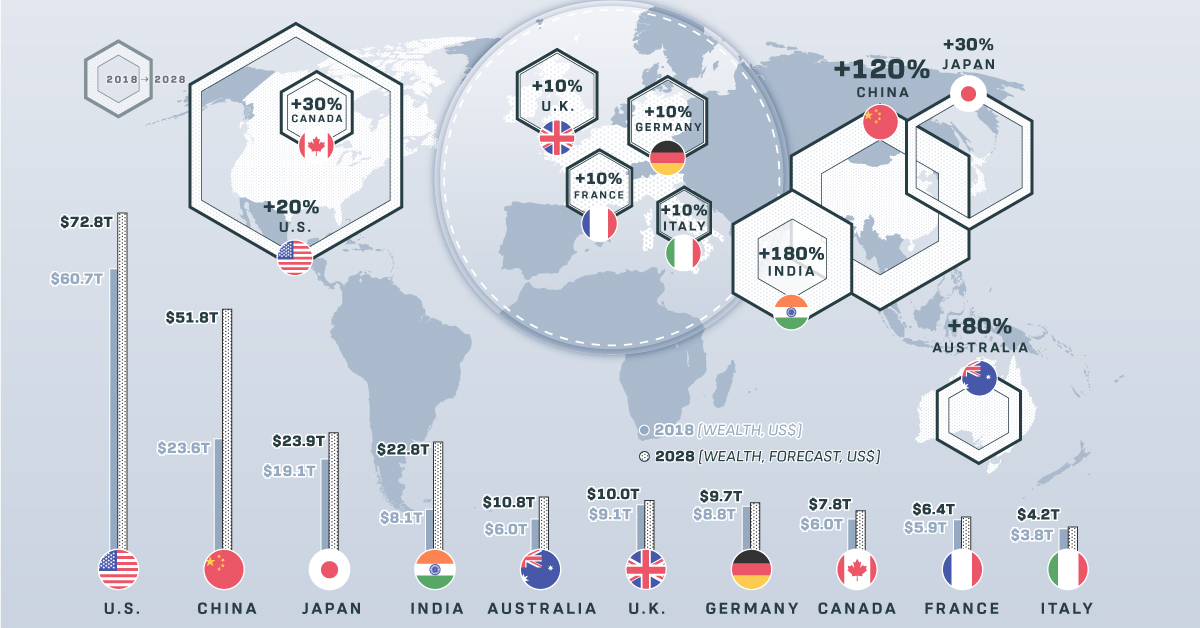
Using data from the Global Wealth Migration Review, here are the 10 wealthiest nations both now and as forecasted in 2028.
| Rank | Country | Wealth (2018) | Wealth (2028F) | Approx. Growth |
|---|---|---|---|---|
| #1 | 🇺🇸 United States | $60.7 trillion | $72.8 trillion | 20% |
| #2 | 🇨🇳 China | $23.6 trillion | $51.8 trillion | 120% |
| #3 | 🇯🇵 Japan | $19.1 trillion | $24.9 trillion | 30% |
| #4 | 🇮🇳 India | $8.1 trillion | $22.8 trillion | 180% |
| #5 | 🇦🇺 Australia | $6.0 trillion | $10.8 trillion | 80% |
| #6 | 🇬🇧 United Kingdom | $9.1 trillion | $10.0 trillion | 10% |
| #7 | 🇩🇪 Germany | $8.8 trillion | $9.7 trillion | 10% |
| #8 | 🇨🇦 Canada | $6.0 trillion | $7.8 trillion | 30% |
| #9 | 🇫🇷 France | $5.9 trillion | $6.4 trillion | 10% |
| #10 | 🇮🇹 Italy | $3.8 trillion | $4.2 trillion | 10% |
It’s worth noting that these figures are meant to represent wealth, which is defined as the total amount of private wealth held by individuals in each country. It includes assets like property, cash, equities, and business interests, minus any liabilities.
China has been the best performing wealth market in the last decade, and these projections show the country as continuing on that track. In fact, both China and India are expected to see triple-digit growth in private wealth between now and 2028.
As far as developed countries go, it’s not surprising that growth rates are much more modest. In Europe, countries like Great Britain, Germany, France, and Italy are only expected to add 10% to private wealth in 10 years, while Canada (30%) and the U.S. (20%) do marginally better.
One notable exception here is Australia, which is expected to add 80% to private wealth over the timeframe – and it will leapfrog both Germany and the U.K. in the rankings in the process.
Wealth per Capita
Here’s a look at the wealth of nations in a different way, this time with numbers adjusted on a per capita basis.
| Rank | Country | Est. Population | Wealth per capita (2018) |
|---|---|---|---|
| #1 | 🇲🇨 Monaco | 38,695 | $2,114,000 |
| #2 | 🇱🇮 Liechtenstein | 37,810 | $786,000 |
| #3 | 🇨🇭 Switzerland | 8,420,000 | $315,000 |
| #4 | 🇱🇺 Luxembourg | 590,667 | $300,000 |
| #5 | 🇦🇺 Australia | 24,600,000 | $244,000 |
| #6 | 🇳🇴 Norway | 5,258,000 | $198,000 |
| #7 | 🇺🇸 United States | 327,200,000 | $186,000 |
| #8 | 🇸🇬 Singapore | 5,612,000 | $177,000 |
| #9 | 🇭🇰 Hong Kong | 7,392,000 | $169,000 |
| #10 | 🇨🇦 Canada | 36,540,000 | $163,000 |
When using per capita numbers, it’s absolutely no contest.
Monaco, the city-state on the French Riviera, is a money magnet with $2.1 million of private wealth per citizen. This means the average Monacan is at least 10 times richer than the average North American or European.
Liechtenstein, a microstate that sits in the Alps between Switzerland and Austria, also has a high average wealth of $786,000 per person. Like Monaco, its population is well under 50,000 people.
Finally, it’s worth mentioning that three countries on the per capita list also made the overall list. Put another way, the countries of Australia, Canada, and the United States can all claim to be among the wealthiest of nations in both absolute and per capita terms.


Money
Charted: Who Has Savings in This Economy?
Older, better-educated adults are winning the savings game, reveals a January survey by the National Opinion Research Center at the University of Chicago.


Who Has Savings in This Economy?
This was originally posted on our Voronoi app. Download the app for free on iOS or Android and discover incredible data-driven charts from a variety of trusted sources.
Two full years of inflation have taken their toll on American households. In 2023, the country’s collective credit card debt crossed $1 trillion for the first time. So who is managing to save money in the current economic environment?
We visualize the percentage of respondents to the statement “I have money leftover at the end of the month” categorized by age and education qualifications. Data is sourced from a National Endowment for Financial Education (NEFE) report, published last month.
The survey for NEFE was conducted from January 12-14, 2024, by the National Opinion Research Center at the University of Chicago. It involved 1,222 adults aged 18+ and aimed to be representative of the U.S. population.
Older Americans Save More Than Their Younger Counterparts
General trends from this dataset indicate that as respondents get older, a higher percentage of them are able to save.
| Age | Always/Often | Sometimes | Rarely/Never |
|---|---|---|---|
| 18–29 | 29% | 33% | 38% |
| 30–44 | 36% | 27% | 37% |
| 45–59 | 39% | 23% | 38% |
| Above 60 | 49% | 28% | 23% |
| All Adults | 39% | 33% | 27% |
Note: Percentages are rounded and may not sum to 100.
Perhaps not surprisingly, those aged 60+ are the age group with the highest percentage saying they have leftover money at the end of the month. This age group spent the most time making peak earnings in their careers, are more likely to have investments, and are more likely to have paid off major expenses like a mortgage or raising a family.
The Impact of Higher Education on Earnings and Savings
Based on this survey, higher education dramatically improves one’s ability to save. Shown in the table below, those with a bachelor’s degree or higher are three times more likely to have leftover money than those without a high school diploma.
| Education | Always/Often | Sometimes | Rarely/Never |
|---|---|---|---|
| No HS Diploma | 18% | 26% | 56% |
| HS Diploma | 28% | 33% | 39% |
| Associate Degree | 33% | 31% | 36% |
| Bachelor/Higher Degree | 59% | 21% | 20% |
| All Adults | 39% | 33% | 27% |
Note: Percentages are rounded and may not sum to 100.
As the Bureau of Labor Statistics notes, earnings improve with every level of education completed.
For example, those with a high school diploma made 25% more than those without in 2022. And as the qualifications increase, the effects keep stacking.
Meanwhile, a Federal Reserve study also found that those with more education tended to make financial decisions that contributed to building wealth, of which the first step is to save.

-

 Markets1 week ago
U.S. Debt Interest Payments Reach $1 Trillion
-

 Markets2 weeks ago
Ranked: The Most Valuable Housing Markets in America
-

 Money2 weeks ago
Which States Have the Highest Minimum Wage in America?
-

 AI2 weeks ago
Ranked: Semiconductor Companies by Industry Revenue Share
-

 Markets2 weeks ago
Ranked: The World’s Top Flight Routes, by Revenue
-

 Countries2 weeks ago
Population Projections: The World’s 6 Largest Countries in 2075
-

 Markets2 weeks ago
The Top 10 States by Real GDP Growth in 2023
-

 Money2 weeks ago
The Smallest Gender Wage Gaps in OECD Countries